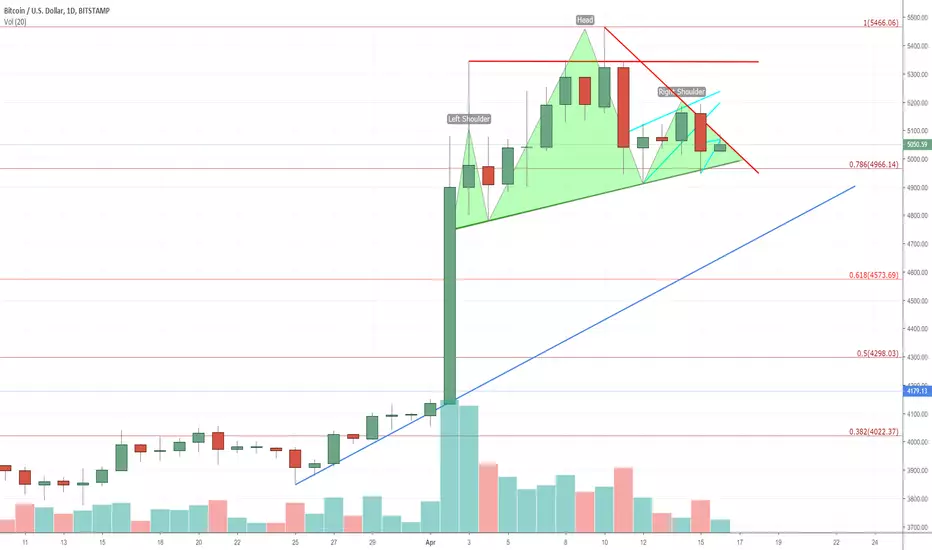
Gentlemen, hold your breath.Both BTC and ETH are at risk of H&S.
Daily NVT not looking good as well.
Please use some caution here.
Buy the dip, but no hurry.
Shoulders
forexTrdr sell Gold: HEAD SHOULDERS KNEES WATCH YOUR TOESGood morning traders
Last week we went long gold at 1295 targeting the formation of a head and shoulder pattern around 1301. Four days later and we see that right hand shoulder pattern forming and therefore look to short gold at market level.
If you look at our chart work on the uk trading view website you can see four failed attempts on 4 hourly charts to breach 1304.8 area before pulling back. We are looking for the market to once again pull back from this area and head lower to the upward tilting neckline of the head and shoulder pattern. An area around 1296 is where we will look to exit the trade.
In addition to the pattern formation and failure to reach last weeks right shoulder high of 1306.4 we have seen the formation of a bearish engulfing candle on the hourly timeframe.

Bitcoin USD - Inverse Head & Shoulder FormingBitcoin in a Bullish channel heading towards the overhead resistance again.
A nice Head and shoulders pattern has formed, hoping for this to finally break this overhead resistance and continue on its bullish charge.

GOLD - Short setup with head and shoulders inside decision zoneWelcome to this mid-term analysis of GOLD. Since October until mid February, GOLD traded within a bearish rising wedge. This pattern got a high success rate and is worth taking note of when it’s showing up on charts.
Once we fell out of the wedge, it happened with strength and volatility. Fortunately GOLD stopped where it should, the top $1200s. This zone was the chop from the flag prior to the local top and naturally got a fair amount of strength to it. It’s likely we will flag around the orange zone and down to $1280 based on the fact the flag prior to the local top lasted 30days.
This price action have possibly created the well-known pattern head and shoulders. We had a flag before breaking $1300 acting as the first shoulder, a rally up to $1340 as the head, then a dump down to $1280, the neckline, and we’re now flagging as the second shoulder below $1300.
If you think this setup will play out, I would place a short SL above $1307 to be stopped out ABOVE a local level, and not below it. The potential risk/reward rate is very good if we close this daily candle below $1300.
The orange zone marked have a history of being a point of decision and indecision. This is basically a zone well respected by chartists and traders, and is naturally a turn point for the price action. Several pumps and dumps have ended up inside this orange zone and immediately reversed. This didn’t happen this time, making me think we could have more downside coming.
There’s a certain possibility of GOLD continuing up, so you shouldn’t risk all your cards on the head and shoulders playing out. In case we continue up, I’m looking to close some longs and re-add to my shorts inside the red zone. If the head and shoulders pattern plays out, I will take profit inside the green boxes, and move my SL down manually, trailing the price. My plan is to re-add to my longs around $1210.
That’s it for now! Feel free to share your opinion in the comment section or ask me any question you’d like! Goodbye for now :]
If you like it and would like to receive future updates - Please, follow me on TradingView!
If you follow me, I guarantee you will receive timely updates to this chart, and all other interesting tickers. This will allow you to stay on top of the assets current trend and hopefully maximize your profits!
For support, sign up to Binance and Bitmex with these links for referral
www.bitmex.com
www.binance.com
If you agree, please, Like this Idea - This would be the best feedback and encouragement for me!

USDCHF Head And Shoulders formed?Not great in spotting H&S yet. We did have some bullish sentiment in the market and now formed this, that seems to fit in the plan of a H&S.
The shoulders are not higher than the head (the difference is not that great) but the neckline fits in quite well.
When the markets open tomorrow I expect to get an answer on the Idea Title.
Thanks for reading and please give me some feedback on this one.

Potential 4hr chart falling wedge confluence w/ h&s drop targetThe current price action is starting to form a potential falling wedge on the 4hr chart...interestingly enough the apex of that potential falling wedge is at the exact same point as the drop target from the 4 hour chart head and shoulders pattern we recently broke down from. I find that confluence very interesting and something that gives more credence to this four hour wedge being legitimate. However with such a big support line as the weekly 200ma just below I'm not gonna be trying to do any limit sells or even shorts here because that support could easily bust us up out of this pattern logn before it reaches the wedge apex/h&s drop target. For this reason this idea will be left neutral.

Possible head and shoulder breakdown here...Target 3290Leaving this idea neutral but leaning more short....the head and shoudler pattern on the 4hour chart appears to be triggering a breakdown. We may need a follow up 4 hour candle to confirm this so a fakeout is still possible...but if confirmed we have a drop target of $3290. Of course there is the massive weekly 200ma support just above it that could rpevent thee breakdown to reach its full target were a breakdown to be validated...so watch for a bounce there should it be validated. Odds are good it will be triggered however as we are already seeing lots of volume on this candle. Probability favors a breakdown more so than a fakeout at this point.

GOLD SellHead and shoulders forming, already traded the smaller head and shoulders within the bigger one now forming.

XRP Triggers 1hr IH&S pattern breaks up out of Falling WedgeAs expected XRP has busted upward form its inverted head and shoulder pattern on the 1 hour chart. The breakout target of that should have been right at the top trendline of the 4hr chart falling wedge but the price action has exploded well above that and seems like it will very likely trigger the falling wedge breakout as well. So now the price target we are looking for next is 39 cents. We are quite overextended on the stochrsi though so we may consolidate sideways in a bull flag first before continuing upward to the 39 cent target. The current 4hr volume candle is absolutely massive which is a great sign for the bulls. Expect exciting fundamental developments from xrp in the coming days/weeks.

A Wedge In Shoulders Clothing.H&s that braks down to negative 20 cents or a falling wedge thatha sa breakout that isn't a negative number...I'm siding with the falling wedge on this one.

Smells like a fakeout…Looks like a fakeout…Is that the fakeout?Here on the XRPUSD 1day chart we have a pattern of a massive head and shoulders on xrp formed conveniently during a downward trend with a breakdown target of negative 20 cents. The Stoch RSI also bottomed out and is ready to travel upward again so there's not enough bearish momentum available to warrant such a breakdown. The downtrend makes it very unlikely a good head and shoulders because the h&s chart patterns that get validated are usually ones that act as reversal patterns at the top of trends not continuation patterns.Sure there are rare exceptions of when a continuation h&s happens but in reality those are just failed patterns that didnt trigger in my eyes. Still with it looking so obviously like a fakeout it makes one wonder if the whales are trying to fake us out with a fake fakeout...thats the only way I see something like this triggering. On the bitfinex chart this pattern is invalid but It appears to be valid for now on bitstamp,coinbase,and kraken. Its for this fake fakeout fakeout reason that I leave this idea neutral....but with a breakdown target of negative 20 cents, it seems like a ridiculous notion to believe it ever could be anything other than a fakeout.

Huge H&S got rejected by resistanceResistance in BTC proving bulls are standing their ground. Expect a push up to 4k levels

Bottom very near. One more final breakdown?A temporary short idea here but the target of this drop could be one of 7 potential targets shown here. To play it safe I am going to be setting a limit buy up right buy the 1 week 200ma(shown here in sky blue) it is conveniently lined up right with the neckline of the larger head and shoulders pattern so I anticipate the price action could attempt a head and shoulder breakdown fakeout and then have the 200 week moving average bounce the price action back up thereby essentially double bottoming off the 200 weekly MA coupled with the last bounce it did off of it at our most recent low and we could see a big bounce from there. However if the 200 weekly ma doesn't hold..I see 6 more potential big support zones here that I have linked and labelled with corresponding color price target boxes accordingly. I plan to limit buy the 200ma and buy the dip on each additional target it drops to..so even though this idea is short on the long term I'm very bullish.

USDMXN long Head and shoulders forming on usdmxn, has hit a long support and is also breaking the downtrend, good risk reward ratio

Ethereum close to completeing 4hr h&s + 4hr deathcrossthis idea is gonna remain neutral for now because fakeouts are always a possibility in crypto but we can see we are about to potentially complete a right shoulder on a very ugly looking head and shoulder pattern on ethusd's 4hr chart....we can also see that the 4hr chart is once again quickly approaching a 4hr deathcross....xrp had its 4hr death cross which led to downside followed by bitcoin which just had its and seems to be leaning towards more downside so if ethereum also gets a 4hr deathcross I'm guessing more downside is very probable...looking left on our chart we can see what kind of downside came with the last 4hr death cross...it wasn't pretty so should this 4hr deathcross occur here I think it is very very likely we will see ethereum trigger this head and shoulders breakdown which could potentially send it all the way down to $65 if this happend hopefully that will mean that the bottom of the bear market is very very near. Of course a sudden huge green candle could prevent all of this so be prepared for a fakeout around the neckline as always. It is that possibility that has me leaving this idea neutral instead of marking it as short.

Bitcoin Inverse Head and Shoulders.There is a solid looking head and shoulders pattern forming on the BTC-USDT daily chart. already had a minor breakout from the ascending triangle pattern setting us up for a good rise in price if the price action manages to break the neckline of the H&S pattern.

SHAMPOOOOOOOO!Hey guys,
Looks like we have a potential inverse H&S breakout to me. Just need some more volume to seal the deal. (Yellow line is the neckline, green outlines inverse H&S pattern)
Lemme know what you think.

1hr head and shoulder pattern forming at end of diamond patternWe can see a 1 hour head and shoulder pattern is threatening to break the neckline right now and if it were to do so we would essentially have a breakdown of the bearish continuation diamond pattern. We eliminated the possibility of it being a diamond bottom pattern when no volume accompanied the fakeout bullis breakout and nwo it is crawling back inside the diamond pattern at the last second to be able to turn it into a bearish continuation diamond with help from a 1 hour head and shoulder pattern breakdown. The target should the head and shoulder pattern breakdown but not not trigger the diamond is 3.6k and the secondary target should it also trigger the diamond breakdown we can see is much lower...I anticipate at the very least the head and shoulder breakdown occurring considering weekends are pretty infamous for dumping. However 4hr stochrsi is alreay pretty overextended on the bearish side so I can see a rebound happening by the time the 1 day stochrsi reaches that zone as well. However it is completely within the realm of possibility for us to also dip to the bearish continuation diamond target and even to the bottom trendline of the larger descending broadening wedge pattern we are seeing...if we do indeed fall below the 4hr 50ma(in orange) for too long of a period of time that gives us a real possibility of having the deathcross on the 4hr timeframe occur again which will inevitably lead to more downside...but I am hopefully we wont go farther down than the bottom trendline of the descending broadening wedge. These scenarios are only in pla in my mind if we first trigger the 1 hr chart head and shoulders...it will be what starts the dominoes on this one...if not we may just bounce back above the 4hr 50ma but probability does not favor this.

bitcoin testing neckline of 4hr head & shoulder patternAs I was anticipating we have now broken down from the bear flag we were consolidating in on the 4hr chart...and now shown here in yellow is the 4hr head and shoulder pattern if it triggers the full potential drop target for it would be right around 3091 hopefully not as it could very easily invalidate our big 1 day chart inverted head and shoulder pattern...maybe it will get another big bounce when it revisits the 1 week charts 200ma (seen on bitstamp) we may be able to double bottom off that moving average. if not we could continue dipping somewhere between 2.8-2.9k and if that fails the bottom is likely around 1120. However hopefully the 200 weekly ma can save the price action and keep the inverted head and shoulder pattern from becoming invalidated.


DOW approaching inevitable deathcross + h&s triggeredThis is my first ever non crypto idea on tradingview but I couldn't refrain from commenting on what I'm currently seeing on the Dow Jones. We can see a big head and shoulder pattern seems to have been triggered which has a drop target all the way down to the 21k range. Meanwhile it seems within the next 2-3 days a death cross is set to occur on the 1 day chart and considering this head and shoulder pattern seems to have already been triggered/validated I don't see any way shape or form that the DJI will be avoiding this deathcross...some wise friends of mine who have been at this much longer than I have are getting involved into some inverse ETFs right now in anticipation of it. I personally will not be making any financial advice on what to do here as I am not a financial advisor but it does appear that the writing is plainly on the wall...I also find it very interesting that the crypto market is now experiencing a bit of a pump during the DJIs + S&Ps downfall. I think we are in for a very interesting 2019 in both markets.

Bitcoin 4hr goldencross has just occurred; Fakeout still in playWe can now see the 4hour golden cross has occurred on the 4hr chart...this may spark a rally and we can see that the stochrsi has reached a good boucne support area with room to go up....however before this downturn, we did not achieve a higher high(which would have been around 4.4k), also this year has been particularly unkind to price action the majority of the times we have gotten a 4hr golden cross. Look left in the chart and you can see at least 3 golden crosses previously that did not get sustained and were followed soon after by a big sell off so it would not surprise me if we repeat history again considering we once again also didn't hit our higher high...howeverwe could for once finally see a real sustainable 4hr golden cross and plow back up above the head and shoulders neckline and trigger the breakout which would give us a target of 5.2k or so....there is also the possibility that that disproportionate right shoulder was really just the head finishing and the recent breakdown is actually the beginning of the right shoulder being formed so thats what the new descending yellow trendline is now representing...if that becomes the new neckline then we still ahve a chance to come up and trigger that which would have a higher price target if it were validated than the current inv h&s we have been looking at. Currently its best to maintain your position until you see obvious signs we are going lower. I sold when we broke back under the neckline but if you didn't right now is a little late to sell if I was in that position right now I would not exit until I saw that 4k had been flipped back to solidified resistance...as long as 4k maintains support there's a chance that this inv h&s brakout can still occur...of course that's just what I would do and not financial advic by any means so you do what you feel is best for you...thanks for reading and good luck!

Possible Super inverse H&S is forming; Target:5.5kHello everyone,
If you follow my telegram channel you seen my call and the discovery of the june fractal playing out.
+ There is a big daily bullish divergence.
Here is the fractal comparison I made:
The fractal of june was part of a big inverse h&s formation. I'm considering that the fractal right now will also extend also in the same formation. If that is correct then the 5.5k target can be reached end of december.
I don't think this is the bottom. I think we will dump further from 5.5k towards 1.8-2.5k range to bottom out end of January or start of February.
