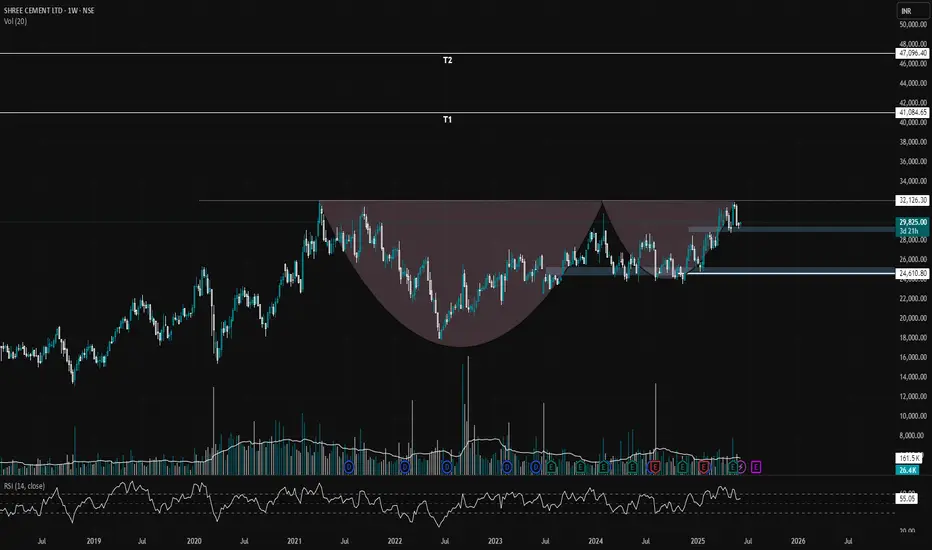
Shree CementCup and handle pattern formed , which is quite basic but the main reason for the trade is that it seems share is being acccumulatrd at every level and has not yet shown any specific upmove in any rally of nifty. so break out is awaited and tgt has been mentioned.
Shreecement
SHREECEM Bullish Buy
Flag formed in shreecem but there is resistance zone highlighted as block for this bullish pattern.

Shree cement-Inside bar-Swing Trade-W Pattern successful break?
09.07.2024
Buy- 27790
Target- 29897
Stop Loss- 26752
Risk Reward- 1:2
1. Inside bar about to Break in Day TF.
2. Perfect W Pattern with Retracement
3. Multiple Rejections of FVG in Day & Week TF
4. Previous Resistance converted to Support
and created double bottom at same level.
5. Price rejected at 0.382 Fibonacci
6. Rejection at 21 EMA & price above 50 EMA
NSE:SHREECEM

Shree Cement looking strong on charts supported by volumesShree Cement Ltd. engages in the manufacturing of cement and cement-related products. The company's brand names include Shree Ultra, Bangur, and Rock Strong. The firm's products include: Ordinary Portland Cement, Portland Pozzolona Cement, Portland Slag Cement, and Composite Cement.
CMP of the stock is Rs.25746.55. The Negative aspects of the company are Companies with growing costs YoY for long term projects , High PE (PE > 40), MFs decreased their shareholding last quarter and Declining cash from operations annual. The company's Positive aspects are No debt, Zero promoter pledge, Improving annual net profit.
Entry can be taken after closing above 25835. Targets in the stock will be 26000, 26733 and 27283. The long-term target in the stock will be 28317, 29210 and 30754. Stop loss in the stock should be maintained at Closing below 23767.
The above information is provided for educational purpose, analysis and paper trading only. Please don't treat this as a buy or sell recommendation for the stock. We do not guarantee any success in highly volatile market or otherwise. Stock market investment is subject to market risks which include global and regional risks. We will not be responsible for any Profit or loss that may occur due to any financial decision taken based on any data provided in this message.

Shree Cement Buy Trade as per Daily Demand.
Monthly Demand is formed and Price in lower timeframe has retraced into the Demand,
This Daily Demand has coincided into the Monthly Demand hence a valid Trade with defined risk.

Trading setup_wave 5 begins in SHREECEMShreeCement is expected to move from current levels towards 27500 mark in wave 5.
The stock is seen taking support from previous 4th wave lows.
Target - 27500
Sl - 25250

Shree Cement: Ascending Triangle Breakout and RetestShree Cement(stock symbol: SHREECEM) has been forming an ascending triangle pattern since April 2022, but recently it broke the pattern with a gap down. However, it managed to recover and is currently retesting the lower trendline. During this retesting phase, the stock is forming dojis, which could potentially act as a trigger for a further move. To implement a trading strategy, a stop-loss (SL) could be placed above the high of the doji, while the target levels are set at 22,623 as the first target and 21,853 as the second target.
Note: It's important to keep in mind that financial decisions should not be solely based on patterns or technical analysis, as market conditions are subject to change. It's advisable to conduct thorough research and consult with a financial advisor before making any investment decisions.

Getting ready for a BreakoutThe scrip is consolidating near resistance and there is a high possibility of breakout from the range. This can be a good short term bet, Keep in radar.

Head and shoulder in SHREECEMWhat the pattern yarrr. This is 3rd stock in today's analysis. Same pattern head and shoulder.
Shreecem in bullish trend with good pattern.

SHREECEMHi guys, In this chart i Drew My Best Levels in SHREECEM for Long, Observed these Levels based on price action and Demand & Supply. Don't Take any trades based on this Post...because this chart is for educational purpose only not for Buy or Sell Recommendation.. Thank Q

Shreecem good for upsideShree Cements in downtrend, yet at support in the down channel and market is supporting the upmove for shree cem. One can trade in future once it breaks the red horizontal line.

#SHREECEM can be longedPerdon! For my old brush tactis haha, but from here i feel SHREECEM can be longed!
WITH SL 23762 targets 24226 and at CMP

Good level ComingNSE:SHREECEM
can take at 26500 with sl of 25600 because it is comming to a very atractive demand zone

SHREECEM -NEoWaveSHREECEM is about to finish semetrical pattern and ready to go up, first target will be 30K, and 2nd will be 32K.

Double BottomStock Analysis: Shreecem has formed double bottom closing above the supply zone expect to reach the target given on the chart with below demand zone as stop loss..
Lets' see
Happy Trading..

SHREECEM - NEoWave LongIn SHREECEM complex wave-b is finished now it is running for wave-c. The first target will 32000 and if it goes for 61.8% then it will be 36500, if it extends to 138.2% then target will be much higher. Minimum time for this move will be end of Nov-2021.

Shree Cement Short Term BreakoutThe stock has broken out and retested the upper and lower trendline and found support near Rs.27000. Trade is supported by brokerage calls and Supports Nearby + 200EMA.
Risk Reward Ratio - 3:1
SL is placed below the support zone, Lower Trendline + 200 EMA. The target is placed near swing high.

Shree Cement (Only RSI above 40 in hourly can save bulls) Shree cement is forming head and shoulders pattern in daily time frame, if it breaks down neckline then it can show more down fall, and above neckline if it survive with rsi above 40 in hourly time frame, then only it can go for further up moves towards blue resistance line , between black neckline and blue resistance line it could be a sideways, and breakout above blue resistance line only can allow bulls to take charge.
Head and Shoulder Pattern in daily time frame
Black Neckline and Blue Resistance line
Key Levels in hourly
Lower key levels
Upper key levels
Daily MACD Negative Crossover and downtick
Weekly MACD Negative Crossover and downtick
Hourly MACD is Uptick and positive crossover
Disclaimer
I am not sebi registered analyst
My studies are Educational purpose only
Please consult with your Financial advisor before trading or investing

Shreecement for tradingToday it broke the trendline and retested it even, but formed a doji instead of buying candle, wait and take a position if you want to trade


POTENTIAL DIRECTION OF SHREE CEMENTPOTENTIAL DIRECTION OF SHREE CEMENTPOTENTIAL DIRECTION OF SHREE CEMENTPOTENTIAL DIRECTION OF SHREE CEMENTPOTENTIAL DIRECTION OF SHREE CEMENTPOTENTIAL DIRECTION OF SHREE CEMENTPOTENTIAL DIRECTION OF SHREE CEMENTPOTENTIAL DIRECTION OF SHREE CEMENTPOTENTIAL DIRECTION OF SHREE CEMENTPOTENTIAL DIRECTION OF SHREE CEMENTPOTENTIAL DIRECTION OF SHREE CEMENT

Analysis of heavy Return Stock - Shre Digvijay Cements this is the first time i recorded generally i analyse my chart and i personally took trades only
today, i recorded this video for all those guys those who want to trade the stock which is not very popular coz in popular stock generally heavy amount of buy/sell possible at any time
but, this small cap stock showed a emence rally returns
if you like then do let me know or if i need something to prove please dont forget to review me
thanks
god bless you all
