Gold steady near 3,350 after CPIHello everyone !
Gold prices remain steady around the 3,350 level, recovering notably from overnight lows following the release of U.S. inflation data.
July’s Consumer Price Index rose 2.7% year-on-year, slightly below the 2.8% forecast. However, core CPI climbed 3.1%, exceeding the 3.0% estimate and June’s 2.9% reading. These figures have reinforced market expectations for a 0.25% interest rate cut by the Federal Reserve on September 17.
The market also reacted to comments from U.S. President Donald Trump, who announced that imported gold would not face tariffs in the U.S. This decision has fueled volatility in gold over the past two sessions. Any tariff imposition on bullion could significantly impact global gold flows.
If the no-tariff policy is officially confirmed, gold prices may stabilize. However, any conflicting signals could trigger fresh price swings.
From a technical perspective, gold is consolidating in a sideways range after breaking below its trendline. The 3,360 to 3,380 zone is now acting as a strong resistance area. A strong rejection here could reignite the downtrend, targeting the 3,310 level initially, with a further drop towards the key 3,300 level.
Sideway

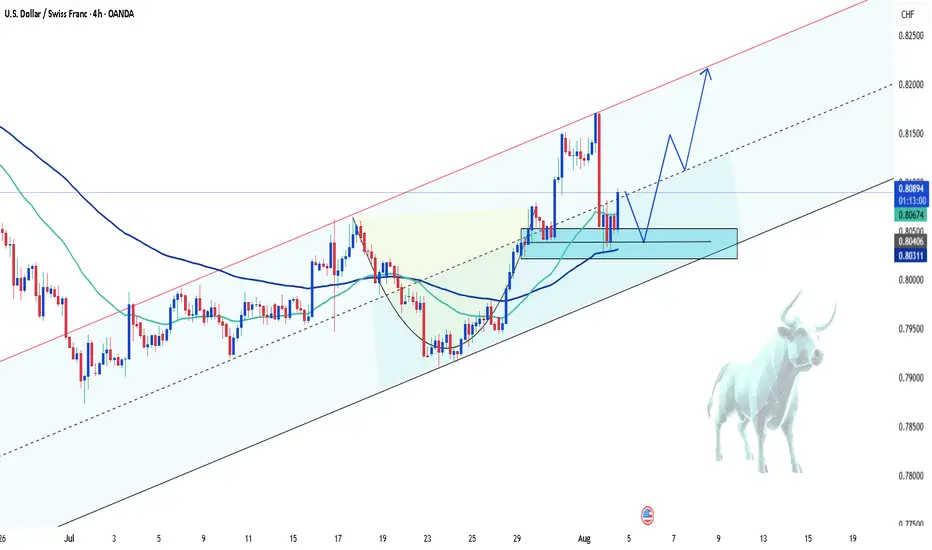
USDCHF – Bullish comeback in progress?Hey everyone! What’s your take on the current trend of USDCHF?
While the pair experienced a recent dip, take a step back and look at the bigger picture — doesn’t it still seem to be moving within an ascending channel?
Right now, USDCHF is hovering around 0.8092 and starting to bounce back. The recovery appears to be supported by a newly formed support zone and the confluence of the EMA 34 and 89. The pair seems to be eyeing the recent high, with potential to climb further toward the upper boundary of the channel.
My current bias? Bullish.
What about you — do you see the same opportunity?
Drop a comment and hit like if you’re on the same page!
EUR/USD Slips Again – Just a Pullback or More to Come?Hey everyone! Great to have you back for another market chat today.
As of writing, EUR/USD remains under significant bearish pressure, currently trading near 1.154 — marking a rather gloomy start to the new trading week. The euro is clearly struggling to attract buying interest as traders reassess the ECB’s stance and digest the newly announced EU–US trade agreement. Meanwhile, the U.S. dollar is gaining momentum, flipping the trend unexpectedly.
From a technical perspective, EUR/USD is showing clear weakness. The pair has broken below both its rising wedge and previous uptrend line, with candles closing firmly lower — a strong sign that the bears are in control.
In my personal view, I expect EUR/USD to continue sliding toward the next two support zones, although a minor pullback could occur first as part of a typical correction.
But what do you think? Is this just a dip… or the start of something bigger for EUR/USD? Let me know your take in the comments!

BTCUSDT pauses before the next big moveAfter a strong breakout in early July, BTCUSDT is now consolidating within a clear range between 116,000 and 120,000 USD. The price has repeatedly bounced from the bottom and faced rejection at the top, forming a well-defined sideways pattern on the H4 chart.
The EMA34 and EMA89 are providing solid support to this accumulation phase. If the 116,000 support zone holds and volume confirms, Bitcoin could resume its previous uptrend and aim for the 124,000 level.
At the moment, this looks like a “breather” zone before the market picks its next direction.
Personally, I’m still expecting another bullish leg—how about you?

ETHUSDT. Are waiting for a buyerOn the daily timeframe we have a sideways market. The bearish vector 5-6 has been played out. After the price interacts with the level of 3200 and the buyer’s strength shows, we can consider long positions with a target of 3722.

Euro will decrease after breaking the 1.08031 thresholdThe Euro is predicted to encounter resistance levels early at its highest point of 1.0981, followed by 1.0936.
However, looking at the chart, it is observed that the EMA 34 has crossed below the EMA 89, indicating a downward trend in the Euro and the likelihood of breaking through the support zone at 1.08031 and heading straight downward.

How is the gold market performing today?From a technical standpoint, the price of gold has experienced a period of stability and upward movement over the past two weeks. This indicates that the price oscillation range is still holding within the area of resistance turned support, with prospects for a breakout to the upside.
On the other hand, recent downward adjustments have found support around the $2,173 region, before the range of $2,164-2,163. Next is around the $2,146 mark, where a breach could potentially trigger strong selling activity in gold.

BTCUSDT : SIDEWAY
"Hello BTCUSDT Traders,
Today, Bitcoin is carving out a resistance level at the $52,000 USD/BTC mark amid the latest U.S. macroeconomic data falling short of expectations. According to analyses from TradingView, BTC's price action has stagnated during the last week's trading session and into the start of this week, showcasing a sideways movement.
For this week, I anticipate BTCUSDT to continue navigating within a defined range, with resistance at $52,800 and support around $50,500. What are your thoughts on this outlook?"

BTCUSDT Hello dear friends, what do you think about BTCUSDT!
Today continues to be a peaceful day for BTC as it still moves with a sideways trend and seems unchanged in price compared to yesterday.
It is currently accumulating around nearly 43,000 USD to prepare for a new breakthrough. Any break of support or resistance could accelerate a new trend for BTCUSDT.
And you, what do you think about BTCUSDT?

Gold continued to decline on the first day of the weekHello dear friends!
The price of gold has decreased by nearly 15 USD since the last closing of trading, marking a 0.74% decline for the day.
Currently, this precious metal is in a state of uncertainty as investors try to predict the next move of the Federal Reserve. For short-term trades, gold still leans towards a price decrease, based on the reversal signals from the 34 and 89 EMA lines.
Resistance level: 2045 USD Support level: 2030 USD.

GOLD held his breath waiting for newsHello dear friends !
Gold price today is trading around 2040 USD and has not changed much compared to yesterday. Up to now, the main trend of gold is still down with sideways in the short and medium term with resistance level 2050 USD and support level 2030 USD.
At the end of the day when non-farm payrolls are announced, gold is likely to fluctuate more quickly like other weekends.
-In case the news continues to support the USD, gold will break the support level and drop quickly to 2015 USD.
- In the second case, the resistance level is broken by the buyers and gold will have a chance to reach the peak of 2065 USD.
And you, which direction do you think gold will move in? Let's wait with Karina!

USOIL-USD: POSSIBLE TRADING PLANS IN A NON-TRENDING MARKETUSOIL-USD is moving sideways in a non-trending market. In this technical analysis , two trade plans are suggested in case of bullish or bearish movement of this commodity instrument over one hour time frame. Both Long and Short Trade plans are generated from the various Support and Resistance Levels of USOIL-USD pair.

Oil 38,2%-61,8% Fibonacci rangeThis week the oil price is moving in the range of $82.50-$87.00, and we need a break above or below for a potential future trend. By setting the Fibonacci on the chart, we see that the oil price movement is between 38.2% and 61.8% of the level.

eurusd bullish or bearish !!!!!!!!!!I think the dollar will go out of range this week
The blue range is from last week
There are three lower ranges and two higher ranges
which one ????

AUDCAD - Bearish GartleyA Bearish Gartley Pattern set up on the range bar chart could be a great trading idea when the market is chopping on the 1-hourly chart.
With that said, you need to know at which point is safer to engage, because you don't want to get whipsaw and got stop out.

cadchf trading plan Cadchf is still moving sideways so doing a relaxed strategy is best where to buy low and sell high. this will continue.
for now there is quite interesting potential
buying area
0.7207 - 0.7232
selling area
0.728- 0.73

Matic: New ATHs?I think Matic needs a little rest and it's hard to keep up.
Polygon's next move is related to BTC: If Bitcoin does not breash, I'm almost certain that we will see new ATHs, and that will be exciting :)

EURUSD (H4) - Finding opportunity
EURUSD has been moving within the Sideway range of 1.16173-1.16642 since Oct 19
Located at the key support of the range at 1.16173-1.16242
Relative Strength Index tends to drop below 50 but the H4 candle is not over yet
In case of a sharp drop, the pair will go up to 1.15784
In case of recovery, the pair will drop to 1.16567.

The next trend of Gold H1 time frame.
Structure: Sideway.
After the price surged and broke the sideway structure at 1804, there was no confirmation of the uptrend but the price retraced deeply to the 61.8 zone of the up move.
Back to the Sideway zone and there is no clear confirmation of the current trend.
Need to wait for another break out of the sideway and retest to confirm the trend to be able to trade with XAUUSD.
Two resistance levels to watch out for when price breaks are resistance 1809 and support 1780.
-----------------------------------------------------------------------------------------------
Wish you all have a good trading day!

BNB: Buying ZoneBNB seems to be going sideway/ slightly uptrend between 405-440. It failed to break above EMA100 so that is still our resistance for now (but once broken the uptrend will be strong). Most recent prices are above EMA30 which is a confirmation of the uptrend, in addition to higher highs/ lows.
I would wait for MFI to be below 25 and place my long entry as long as price are still in the “blue zone”. My tp would be 440 and sl at 404.
((Not a financial advice, use at your own risk))

Wait for confirmation of Price Action to execute buy orderH4 Time Frame
Structure: Breakout Sideway from 1790 to 1820.
Bias: Upside.
Wait for retest support 1820 and confirmation of Price Action to execute buy order.
Target is next resistance at 1850-1860.
-------------------------------------------------------------------------
Wish you all have a good trading day!

BTCUSDT Price Analysis (4h)The price is placed in a triangle pattern and if it crosses the triangle and the marked yellow lines, it becomes a position long or short .The triangle pattern is a corrective pattern and the reason for its formation is the existence of ambiguity in the market and sometimes it can move in the opposite direction of the previous trend. So we wait for the triangle pattern to break. (Horizontal white lines are drawn based on Price Action and we can wait for the price reaction to them) . BINANCE:BTCUSDT

BTC selloff was a bear trapBTC selloff was a bear trap,
BTC has managed to form a double down,
seems most likely to go sideways for a while before it attempts another run,
ALT trading will be interesting during this time.
