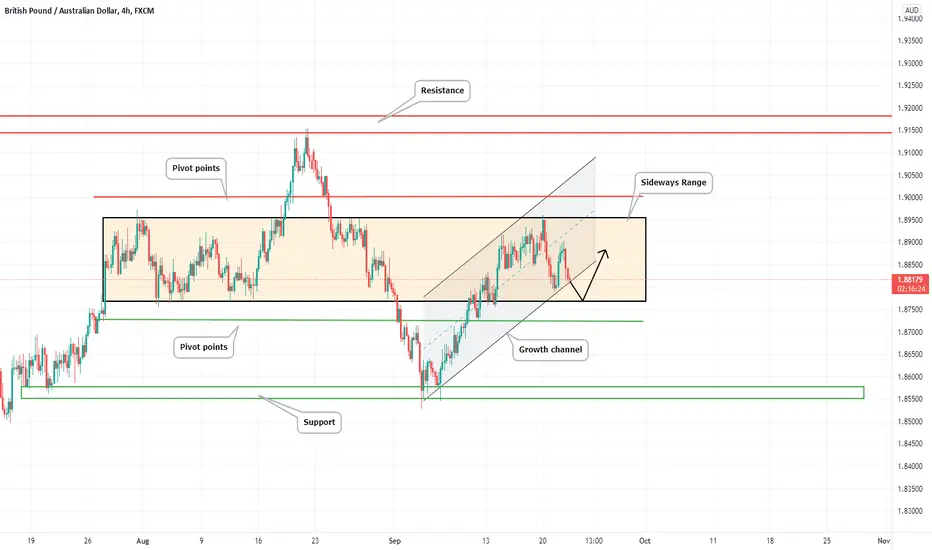
GBPAUD 📉Sideways Range⚡At the moment, the price is at the lower border of the ascending channel and is trading within the sideways trend. Further movement - a breakdown of the center of the channel and a hike to the upper border of the range!
Have a nice trade!
Sideways

Ascending triangle on 2hr chart strongly in progresson 2hr chart ascending triangle wedge is formed and btc act as consolidation with in the range. btc need to break 45100 to stay bullish. some more sideways up to 5 candles can invalidate the pattern.

BNBUSD🤑What will happen next?📈The price is at the support level. I expect a slight pullback to the lower border and further movement is up to the sideways range by next week.
Do you agree?)
Your Solldy.

USDJPY❗Sideways📈At the moment, the price has returned to the sideways range. Now the level of resistance is consulted. I expect a small rebound, breaking through the level and a hike to the upper border of the sideways trend.
Have a nice trade!

Silver Futures Trade The Range! Longs and Shorts Silver has been in the current sideways range for 410 days and within this time it had printed its ATH of 30$ back in Feb 21.
In August we tested the bottom of the current range to around 22$ with a 11% move to the upside thereafter followed
by a strong rejection at 24.90 to push silver back down to the August range Lows at $22 for the back test.
We are sitting at the bottom of that range so an obvious choice would be to long or you could wait and see what reaction you get
at the levels marked .
I have marked the area you can expect support to step in if this were to reject from 24XX for example and break down from the channel .
If of course Silver claims that level 23.90 as a support then the middle of the channel will pose some resistances , with the Point of control and the .618 and the middle of channel .
Taking some profits if you are long from the bottom would be a good idea or consider shorts from this region .
Trade the range Until it Breaks was some great advice that I was taught !
Always Know your Invalidation and Have a Trading Plan !
Share Comment and Like ..Appreciated

EURUSD.Trapped in a Tiny Range. Getting ready for the Breakout.EURUSD is trapped in a tiny rage between 1.1700-10 and 1.1745-50. Trend remains down as we can see clearly in the chart.
Today's announcement will lead outside these boundaries.
Upside Break will open the road for 1.1790-1800. A break below 1.1710 will eventually lead to 1.1660-65. The first touch of 1.1790-1800 could be used for Short term Sell positions. The opposite is true for 1.1660.
Next levels to watch are 1.1850 to the upside and 1.1600-10 to the downside.
We will update the idea with comments after the announcement...

BTCUSD ⚡ 45000$? 📈Now we will probably observe buyouts and then at lower TFs it will still be possible to see that with a double bottom sight 42000-43500-47000. This is ideal for bulls. But there is also a variant with rebounds from 40,000 upwards and then gradually breaking the support level with the formation of a triangle for a breakdown to 37000-38000.
Do you agree?)
Your Solldy.

GBPAUD 📉Decline to pivot points⚡As of today, ltrym has been trading sideways since July 27th. During this time, clear boundaries and control points of support were formed. Further price movement - when the sideways range is broken, I expect a descent to the pivot point and back into the range - a false exit. We are also now at the lower boundary of the local ascending channel. If we break it, then we go down to the border of the range and push off from it. The second idea has more chances of implementation, since the sideline is quite old, which means its boundaries are quite strong.
Have a nice trade!
USDJPY❗Exit down📈At the moment, the price has come out of the sideways downward trend and is trading in the range of 109.2-109.7. Further, if we do not break through the resistance level at 109.7, we go down, an important support block is marked in green. Both scenarios have the same chance of being realized.
Have a nice trade!

usdjpy buy if we look on daily timeframe USDJPY is on ranging condition
price right now is rejecting strong support
so i choose to took a buy with 3:1 Risk Reward

Weekly TA: BTC-USD (20th Sept)BTC witnessed a volatile last week as it traded in a range of $44,000 to $49,000, it faced strong selling pressure at the higher levels which triggered the downside rally. However, it closed the weekly candle in the green territory and formed a Doji kind of a candlestick pattern. Crypto markets started this week with negative sentiments as the top crypto assets fell by ~5-10%.
After gaining more than 60% from its July low levels, BTC seems to have started its pending contraction move as it is trading ~10% from its recent high of $52,945. Massive selling pressure is present in the range of $50K to $52K. As per the Fibonacci retracement levels drawn by connecting the July lows to the recent high, BTC is managing to sustain above its 0.382 level which is placed at $43,590 .
On the higher side, the immediate hurdle is present at $46.5K , post this, the next potential sell wall is present at $48K followed by the psychological level of $50K . On the lower side, the nearest support is present at $43.8K and if this level is broken decisively, selling pressure can continue till the level of $42K followed by $40K .

USDJPY❗ Sideways range📈At the moment, the price is in a sideways movement range, near the lower border. A false breakout with an exit to the top and a return to the sideways range is possible, but the scenario of a level retest with an exit to the top without a breakdown is more likely.
Have a nice trade!

GBPUSD📈Side formation?😨today, the price has returned to the range of trading 1.373 - 1.361, further movement should form a sideways trend in this range with a further upward movement, but there is an alternative scenario - a retest of the support level with a sharp upward movement.
Have a nice trade!

BTCUSD ⚡False exit? 📉BTCUSD
At the time, bitcoin came out of the sideways and broke through the resistance level, there are no prerequisites for further growth, so the most obvious scenario is that what is happening now is a false exit from the sideways and further prospects are the strait of the lower border and back into the sideways range
Do you agree?)
Your Solldy.

NVDA: Doing the most resilient type of correction!Hello traders and investors! Let’s see how NVDA is doing today!
Technically speaking, the purple line at $ 224 is a key point for us , and if NVDA defeats this price level, it’ll turn bullish, at least for a short period of time, and we’ll seek the ATH.
Keep in mind that NVDA is in a congestion , moving sideways, and not doing anything meaningful. However, since we are near a support level, at the bottom of this congestion, the risk/reward ratio starts to get interesting again.
Let’s see the daily chart for more clues:
Yes, NVDA is quite close to another support, the 21 ema in the daily chart. As far as I know, NVDA is doing what I like to call a “ Time Correction ”. This happens when the stock goes up a lot, and it needs to rest a little. But since we are talking about such a good company, the price simply can’t drop – but it can’t go higher anymore. Then we see a sideways movement, while the 21 ema gets closer to the price: A Time Correction.
A Price Correction occurs when the price actually drops to the previous supports, like the 21 ema or the Fibonacci’s Retracements . So far, NVDA is quite resilient, and there’s nothing indicating that the bull trend will reverse.
We could seek the retracements again, yes, but we must see a stronger bearish structure in the 1h chart for that.
If you liked this analysis, remember to follow me to keep in touch with my daily updates. And please, support this idea before you go, if you really read this far!
Have a good day.

The market will not crash- Be realistic for once.Keeping it short as always- look at the touches and look at how previous trend resistance turns into support.
Moving sideways is the most realistic way of thinking of the market none of this Youtube or other analysts claiming
going back to the 1970s bs support will happen unless ultimate chaos breaks in even I will doubt it.

AXS trappedAXS has been trapped in this range last 7 days, bouncing up and down. If this rock-solid support zone is lost, we could see a solid move down, and if finally break this resistance above, we could expect a nice upside. SMA 20 and 200 are almost flattened on 30mins chart and this could be a nice base for catching the next move. Set alarms and don't miss this. Good luck traders

Dust Settles In A Trading Range (More Accumulation!)Hi all,
My last post was at the begining of the uptrend which is still in play however with a correction and sideways accumulation right under the sell wall.
That said, there's nothing concerning right now and i did not make any changes to my position.
However, since we are in a sideways trading range, we have an opportunity to take a short at the top and long at the bottom.
So, i will be looking for invalidation of an upswing at 49k before taking a short and vice versa for the downswing at 43k.
For risk management and hedging purposes, i'll not short 100% of my account, but instead between 15% - 50% and keep both positions open, unless one of them gets invalidated.
BTW, My 100k target has changed as we have continued accumulation. I'm now looking at $123k as the pnf horizontal count suggests and we keep on accumulating!
Normally i don't trade intraday charts, but this is a good opportunity i don't want to miss and besides, i'd like to practice some swing trade as i have lots of free time now :)
As always, trade safe!

BTCUSD ⚡ News for today 📈BTC broke through the $ 52,230 mark for the first time since May, breaking through the local sideways (marked on the chart with red). Further, I expect that we will reach $ 528.13, there will be a weekly pivot R2, after which we will go down to the support zone S3, S4. These are quite important levels, and if we break through them, the price will go lower - 48800, but if it pushes off, we will go up to $ 55000.
Do you agree?)
Your Solldy.

ACST.JK , trying to reverse from its down trendAfter trying to break out from its down tred, IDX:ACST now in rather sideways movement. Clearly price level 300 was being tested several times before the price plunged down to 220 on 23th August 2021.
The interesting thing is, after that date, price movement is going up; with several corrections along the way. As you can see each time the price was corrected, it was followed by weak volume. The candle was not trying to make lower low, but rather higher high.
Today, 6th September, with positive MACD, the price heading up, with also previous correction was followed by weak volume.
As per 6th September 2021:
Close price at 268
S1 264
S2 234
S3 208
R / Target 300. Would be nice if 300 can become support.

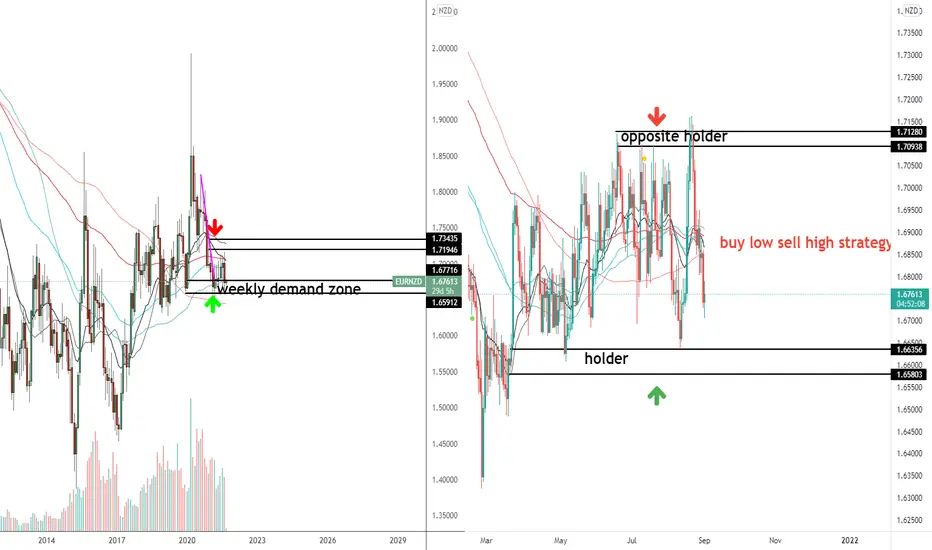
JICPT|EURNZD long setup on sideway structure!Hello everyone. On Aug 18th, I published an idea titled 'EURNZD short setup on sideways structure' . The pair had a false breakout of the upper zone before falling all the way back. Actually, there is a retest entry opportunity on the 60m. You can check the linked idea below.
Now, price has come closer to the bottom zone. We know the best trading strategy for sideways structure is buy low and sell high.
So, I set an alert for trigger.
What's your opinion? Give me a like if you're with me!
BTC approaches importance key priceH4 time frame.
Structure: Uptrend.
The upside momentum is waning as the price approaches the critical resistance at 50000.
In the bullish case, a clear move, as well as important confirmation, is needed to avoid a false breakout as the current bullish momentum is very weak.
There is a high probability that the price will continue to move the Sideway between 46000 and 49000.
Here wait for the sell signals down to the 46000 support until there is a clear breakout and confirmation.
-----------------------------------------------------------------------------------------------
Wish you all have a good trading day!

USDCAD Sideways Trading PlanUSDCAD price is going sideways after it was rejected from the resistance level. ( check Daily timeframe )
But the price is now consolidating in the support area. We are looking for a breakout. Either up or down.
2 trading plans are in motion, waiting for confirmation.
Manage your risk.
Disclaimer: This content is intended to be used and must be used for information and education purposes only. It is very important to do your own analysis before making any investment based on your own personal circumstances. Accordingly, the writer will not be liable in respect of any damage, expense, or other loss you may suffer arising out of such information or any reliance you may place upon such information.
