PLTR: Complete study for the weekend (H, D and W charts)!Hello traders and investors! Let’s see how PLTR is doing today!
It is impressive, but today’s drop was just a pullback to the previous support at $ 23.69 (we hit $ 23.67), and it is reacting again. The movement was extremely technical, and it looks like a sideways correction , rather than a real sell-off.
When we look at the daily chart, we see that PLTR simple can’t drop, but since it wen’t up a lot after earnings, it can’t keep flying. A sideways correction is the best scenario for PLTR, and it is getting closer to the 21 ema now.
Since we are near the 21 ema in the daily chart, and we just retested the support at $ 23.69 in the 1h chart, I see a good buy opportunity on PLTR.
In addition, if you plan to hold PLTR for a while, the situation is looking great:
In the weekly chart, we have the classic Ignition Bar followed by a Gift candlestick pattern. The high volume reinforces this incredibly bullish pattern. I bought PLTR around the $ 20s with my followers, but if you ask me, there’s still time to buy it , even after it is going up almost 20% for us.
We have a pivot point at $ 27.47 (red line), and if PLTR defeats it, the $ 45 is the next technical target. Therefore, there’s a lot of room for PLTR to go up.
If you liked this analysis, remember to follow me to keep in touch with my daily updates on stocks and indices.
Have a good weekend!
Sideways

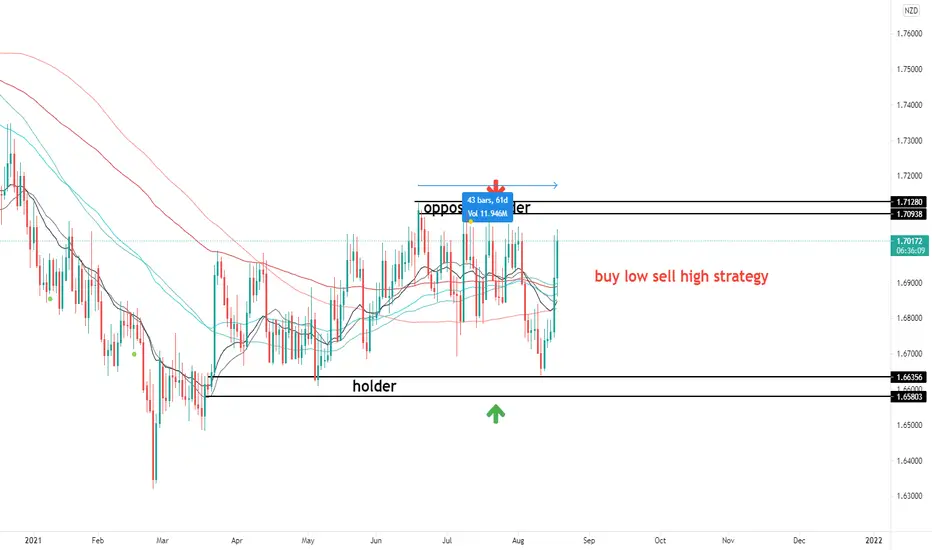
JICPT| EURNZD short setup on sideways structureHello everyone. This is a pretty simple sideway trading strategy.
The range is 1.6580-1.7128 which has been respected 61 days. I already set the alerts around the bottom and the top. The scenario might be as below:
1. Sideway continuation : Price could go through the upper zone. Looking for bearish formation on 1H or 4H chart. Target is the opposing zone.
2. Sideway terminated with strong momentum to the upside : Momentum is strong and zone got violated. I plan to long for the pullback.
Sideways structure are easy to trade. In one word, buy low & sell high. It works until it doesn't. That's fine.
Give me a like if you're with me.
Doge coin is trading in channelDogecoin has been trading in fix range, if the Doge break this channel then there will be a clear path to touch $0.30 which is more than 15 % up from the current price.
Doge is perfectly bouncing back from the 21 EMA and 50 EMA which is good signal to add more.

BTC Bouncing Around Between the 200 SMA and 200 EMA, Daily ChartThe chart shows the potential for some further sideways movement as a game of price ping pong plays out. Price seems to be respecting these two moving averages.

significant resistance for ETHETHUDT chart shows that ETH should breaks the significant resistances.

Adanient - Elliott wave analysis - ABC correction Adanient is in sideways complex B wave correction and can go up to 1600-1635 zone before it will end it and start moving down for C leg. Above trend channel of abc move (last leg) it can go up to mentioned level of even slight higher. If it failed to go above W wave high of B, then there is a possibility of triangle as B wave.

JICPT| Gold continues sideways, waiting for job data tomorrowHello everyone. It's been a bit wild for gold those days. Currently it's siting in the middle of a range between 1792 and 1833 for about one month.
In my opinion, the Non-farm payroll data may give us a clue of where the price might go. According to forexfactory, the forecasted data for NFD and unemployment rate is 870K and 5.7%. So there are two possible scenarios as below:
1. The data is better than forecast: It indicate economy is better than expected. Fed may hike rate sooner, so bad news for gold and possibly stock index as well, e.g. Nasdaq. The bottom of the range may be violated. I tend to have bearish setup in this situation.
2. The data is worse than forecast: It indicate economy is not so good as expected. The possibility of raise interest rate is low. Good news for bullish gold buyers. The supply zone may be penetrated. I would prefer to bullish setup in this scenario.
To make things simple, I ignored mixed results. For example, the NFP is worse and unemployment is better, or vice versa. In addition, 'Average Hourly Earnings m/m' may also impact the markets as higher earning suggested higher inflation.
If it's too hard to trade the news. I recommend you waiting for 15 or 30 mins before jumping in new trades. Or, trade unrelated stuff, like cross currency pairs , e.g. CADJPY.
Trade safe and stay safe. Give me a like if you're with me.

Volume ProfileAs I mentioned in previous posts, #BTC reached a significant resistance. It seems that it tends to touch the middle of the side-way zone. considering the volume profile of the last up trend within this side-way region, one can see the important levels. I believe that regions around $38200, $34200 and $32200 are possible targets for down trend.
According to the volume profile, there are many orders around $42000. So, this zone could be stop hunter region where BTC just hit it by a shadow(wick) not to break it.
I would be glad to have your comments and ideas.
please leave me your comments

Looks like there could be some sideways movementMy publishing are for my personal references and made public for anyone that can find it useful.
Any opinions are welcome
Looks like we are entering a bullish trend for GRT
Support held up well and broke through the trendline while doing it
I am looking to trade this up until the resistance line where I would most likely sell and wait for the next move(depending on price action I could hold longer because there is a possibility of it going to the $2.20 mark)
I currently hold a position that I will be adding more to especially if it drops which it most likely will(im thinking in the .50-.55 range)
I like the odds on this one for a nice sideways movement
I will be holding this position for 3+ months or longer until one of these targets are hit.
I am not using any stop loss because I will just be adding to my position if it does not immediately just hit the target(you never know)
Thank you for checking it out!
There is a strong resistance at the .78 range which needs to be broken to hit the next target.

Two key resistances broken, The daily resistance (blue one) and the weekly resistance (black one) have just broken. The next stop will be $47800 in my estimation but, It’s also possible to have a sideways trend before.
If the price could stay above $40k , the next target will be $47800 .
Trend Key Points Indicator have been used to draw important key levels and key points.

Ethereum looks goodLooks like Ethereum is trying to form double bottom. I long it with small size and small leverage. (no advice)

Buy high, well higher in secure range The market ke in the sideways trend or secure range. The price travels between two strong support and resistance line.
Now, in the daily chart, we found engulfing pattern, and the price rise until the middle of the range. So the price will continue the movement until fake breakout.

BITCOIN READY FROM $30,500Bitcoin is in a range ($36,500-- $30,500) from 18 June 2021. And recently break its latest swing at 32800. So, According to my analysis: - - - - -
" if the price will retrace from here & unable to go up, fall & break the $32800 level again then We can create a Short position with the target of $30,500 or 1:2 reward ratio."
REMEMBER: Always do your own analysis before entry & take only 2-3% of risk per trade.
BEST OF LUCK
HAPPY TRADING

BTC/USDT Wyckoff Accumulation - 80% Accurate?BINANCE:BTCUSDT
My Cleanest that I can come up with.
What I did consider why somehow it is inaccurate.
1. Anticipation - Price where moved a bit and some are delayed in dip/pump. 1 reason: because of the market manipulation which will make this market a bit inaccurate down to 80% probability.
2. Fundamentals - Crypto fundamental analysis involves taking a deep dive into the available information about a financial asset. For instance, you might look at its use cases, the number of people using it, or the team behind the project. Your goal is to reach a conclusion on whether the asset is overvalued or undervalued.
3. Significant Dates - For example. the 12th of July 12AM and July 17 2021. These are significant dates because of the events that may come.
Example for that is GBTC wallet release for July 17th of 2021.
4. Technicalities - I am just allowing myself to have fun with the market it allows us to make educated guesses about whether a digital asset's price will increase or decrease in the future.
5. Market Psychology - my observance and collection of wallets to produce prevailing behaviors and aggregate sentiment of market actors at any point in time. The term is often used by the financial media and analysts to explain market movement that may not be explained by other metrics, such as fundamentals.
===========================================================================================================================
REF: www.investopedia.com
Phase A
The selling force decreases, and the downtrend starts to slow down. This phase is usually marked by an increase in trading volume . The Preliminary Support (PS) indicates that some buyers are showing up, but still not enough to stop the downward move.
The Selling Climax ( SC ) is formed by an intense selling activity as investors capitulate. This is often a point of high volatility , where panic selling creates big candlesticks and wicks. The strong drop quickly reverts into a bounce or Automatic Rally (AR), as the excess supply is absorbed by the buyers. In general, the trading range ( TR ) of an Accumulation Schematic is defined by the space between the SC low and the AR high.
As the name suggests, the Secondary Test (ST) happens when the market drops near the SC region, testing whether the downtrend is really over or not. At this point, the trading volume and market volatility tend to be lower. While the ST often forms a higher low in relation to the SC , that may not always be the case.
Phase B
Based on Wyckoff’s Law of Cause and Effect, Phase B may be seen as the Cause that leads to an Effect.
Essentially, Phase B is the consolidation stage, in which the Composite Man accumulates the highest number of assets. During this stage, the market tends to test both resistance and support levels of the trading range.
There may be numerous Secondary Tests (ST) during Phase B. In some cases, they may produce higher highs (bull traps) and lower lows (bear traps) in relation to the SC and AR of Phase A.
Phase C
A typical Accumulation Phase C contains what is called a Spring . It often acts as the last bear trap before the market starts making higher lows. During Phase C, the Composite Man ensures that there is little supply left in the market, i.e., the ones that were to sell already did.
The Spring often breaks the support levels to stop out traders and mislead investors. We may describe it as a final attempt to buy shares at a lower price before the uptrend starts. The bear trap induces retail investors to give up their holdings.
In some cases, however, the support levels manage to hold, and the Spring simply does not occur. In other words, there may be Accumulation Schematics that present all other elements but not the Spring . Still, the overall scheme continues to be valid.
Phase D
Phase D represents the transition between Cause and Effect. It stands between the Accumulation zone (Phase C) and the breakout of the trading range (Phase E).
Typically, Phase D shows a significant increase in trading volume and volatility . It usually has a Last Point Support ( LPS ), making a higher low before the market moves higher. The LPS often precedes a breakout of the resistance levels, which in turn creates higher highs. This indicates Signs of Strength (SOS), as previous resistances become brand new supports.
Despite the somewhat confusing terminology, there may be more than one LPS during Phase D. They often have increased trading volume while testing the new support lines. In some cases, the price may create a small consolidation zone before effectively breaking the bigger trading range and moving to Phase E.
Phase E
Phase E is the last stage of an Accumulation Schematic. It is marked by an evident breakout of the trading range, caused by increased market demand. This is when the trading range is effectively broken, and the uptrend starts.

BITCOIN - Move Your Lazy Ass!!!Hello everyone, rouzwelt here
It's been a few days since my last post, but not much has happened in these few days, just sideways, no clear direction, no domination from either sides. My last short trade is still active at 34850, price couldn't reach the last swing high and therefore my SL is still at its place. Let me say that I still lean more towards the down side as price have not been able to print any higher high in these few days, but we can see a lower low (not with much difference, but still technically a lower low) and we see a bit more volume at impulse moves down compared to impulse moves up which indicates slightly more dominance from bears at this moment but not a definitive one.
You can see 2 red horizontal lines in the chart which I believe are the definitive lines for bitcoin to take out if it wants to get out of this current sideways channel. 35K would be the level for local uprise and 29K would be the level for downfall. I have projected the possible price actions for those scenarios if we see a breakout happening in next couple of days or so. But I should note that bitcoin might still stay in this channel and continue its sideways move for quite some time until one side can dominate the other and if the current condition we're in manages to continue it would favor the bears as the price is closer to the lower side of the 30/40k range and is getting closer to the end (crossing point) of the blue down trend line and 29/30k resistance area (forming a down-sloping triangle and potential bear-flag).
It's worth mentioning that right now we clearly see no enough sellers, but we don't see enough buyers neither and actually as price fails to print any local higher high it keeps more potential buyers away from entering which is clearly visible through the bars volumes, this makes it more favorable for bears to push further. Many talk about 30k being the bottom and that the price can't go any lower than that, or that the 30k support is so strong that it can't break, well it is a strong psychological support but that doesn't mean it can't break, it definitely can, as long as there are not enough buyers and interests at current price levels it can always break to find more interests again and build its base for the next leg up.
I'd like to talk briefly about Alts here, I believe if Bitcoin continues its current sideways move for couple of weeks, we can expect some bullish moves from alts, but if BTC start another sell-off then alts will follow obviously. So right now I'm starting to look for some potential short-term buy setups on some large-cap alts and I'll be sharing them here if I find any good one and It kinda would be a good hedge for me as well if I find any buying opportunity on them as my short position on BTC is still open.
That's all for now, if you find this post useful then consider supporting me by hitting like and write a comment if have any opinion about my analysis, I'd be happy to read your thoughts about it. Thank you and as always have fun and trade safe.

Gold has no concrete direction right now! After finishing an uptrend, the chart broke its parallel channel and entered a side way consolidation phase. In this current situation, there is no solid speculation for the future of the chart.
The only thing which is possible here is to short when we are near the top and open a long position near the bottom(supporting areas).
We should be cautious about tonight’s federal reserve’s statement. That news would make the markets move very extremely!
Good luck.

BTC Sideways + NEW Market Type Indicator for screening marketsBTC has been in a neutral/sideways market for quite some time now!
I'm stockpiling my coffers in preparation for an upwards breakout, retest, and continuation of the long term up trend.
Watching my latest indicator, Anticipated Market Type to signal when I should start using my trend trading strategy again.
In the meantime, I've been running a sideways/mean reversion strategy for capturing the consolidated market when the AMT indicator displays SIDEWAYS and I stop trading at NEUTRAL.
My DD has been consistently low and I avoid the low volume and low volatility periods when market is NEUTRAL.
If you've been holding on to cash while waiting for the the right moment, consider using my newest indicator (or their sub-components, MMI and FD ) in your next trading session.
Cheers

GBPUSD Sideway StructureGBPUSD has formed a sideway structure and you guys can sell at the resistance area and buy at support area. Good Luck

NIFTYNifty is in minor sideways, its now in sideways bottom. In one hour time frame if Nifty breaks and closes below 15630, then it will go to the major support 15458. If it doesnt break, then it will be in sideways ranging between 15634 to 15900. 15400 and 15900 Short strangle strategy would be better and it would give a decent profit.

🔴 GBPCHF [H4] Looking for sideway 🔴 GBPCHF Looking for sideway
Now GBPCHF prices in TF H4 have a sideway so the easiest trade is to follow this pattern.
Open Sell when price hits resistance and PA Bearlish occurs and open Buy when price hits support.
🚩🚩 Stoploss should be above the support or resistance as the pattern formed.
find more forex & crypto weekly forcast on my youtube channel
Goodluck Trader
Ton Trader
💲💲💲💲💲💲💲💲💲💲

JICPT| Gree is testing M bottom, creating buy opportunity Frankly speaking, I love Gree which is still the best Air conditioner manufacturer in China. I started to trade it back in 2012 and still hold some shares as of today.
The company has been up by more than 900% in the past ten years. It used to be must-have stock for value investors due to its outstanding financial performance. However, things started to change from 2018.
The below is my personal view for reference:
1. single-product line business strategy: No doubt, Gree makes the best AC with competitive price. But 92% of its revenue comes from AC. However, the AC sale has highly correlated with real estate. I recall annual sale of ACs are capped at 23-25 million per year. Against the backdrop of structure reform, government wants to replace the model with new one(innovation) to achieve GDP growth, not through selling properties. I don't see numbers will jump in the coming years.
2. Diversified development strategy failed: Gree announced to make phones, cars, and invest billions into chip companies. But all ended in failure. I think it's better for the management to focus on the home appliances, e.g. floor cleaning robot, window cleaning robot. Some Chinese companies are doing those stuff very well. Their share price soared into sky!
3. Rising input costs: With the super loosing monetary policy from central banks around the world, commodities, such as copper, created new highs. We know, copper accounts for approximately 30% of the cost of producing an air conditioner. it started to become an major issue for AC manufacturers, including Gree. I think they have no choice but to increase the price to hedge the rising cost. But that might impact consumers' willingness to buy. So, I need to read the half-year financial report to do my own research.
Back to the technical side, Price retreated to 61.8% fib level with M formation and Gap. The bad formation is the crossover of the MAs. So, price might go sideways for a while before buyers take control.
I think the 47-50 would be the bottom by checking the PE band of last 10 years.
Give me a like if you're with my idea.

USDMXNRemains into range $19.70 - $20.30, same vision since last year
Short term sideways into range 📉 📈
Of course bullish long term 📈
