Trade Ideas Educator: CADJPY ButterflyA bullish butterfly setup as a countertrend trade, take note of the strong bearish candle that may not come to a halt soon enough, I'll observe if the level stands before taking up this trade.
Sideways

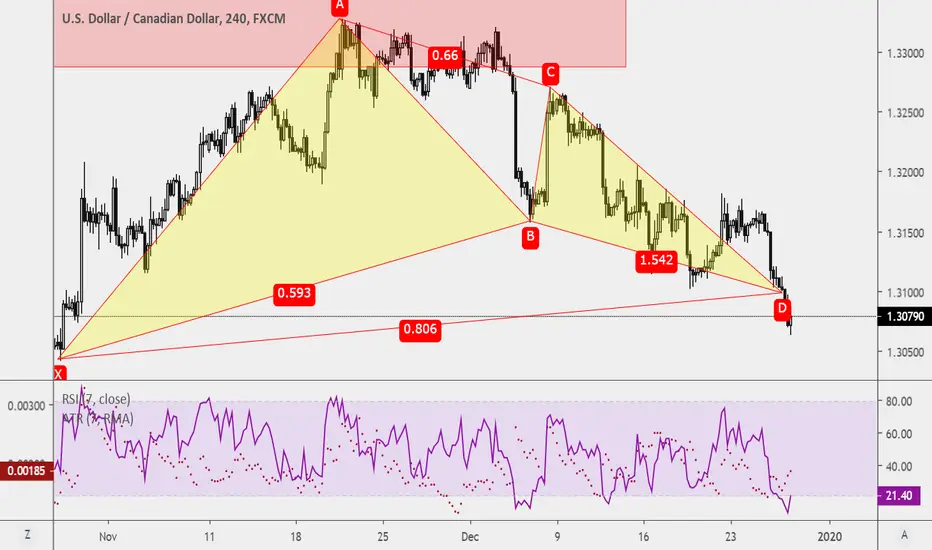
Trade Ideas Educator: USDCAD GartleyA bullish Gartley is waiting for a complete setup. The aggressive trader can wait for a double bottom on the 1-hourly chart for a buying opportunity, the conservative trader could wait for the confirmation of the Potential Reversal Zone(PRZ) for a buying opportunity.
The overall trend is moving towards a sideway market.
EURUSD-Weekly Market Analysis-Dec19,Wk5A 5-0pattern has completed, congrats to all traders who had long it. I'm looking for a type2 bearish shark setup. On the 1-hourly chart, I can wait for a double top to engage the trade within the new supply zone as a sideways trading opportunity.

EURUSD-Weekly Market Analysis-Dec19,Wk4The daily chart on EURUSD is a bearish trend but on the 4-hourly it is a sideway market.
A bearish shark setup has trigger driving the movement past the 5-0 pattern. At this moment, I'm waiting for a double top on the 1-hourly timeframe with an RSI Divergence to engage a 5-0 buying opportunity.
Check the link on my signature to access all my trade ideas.

Trade Ideas Position: EURUSD BatA bearish bat forms up within the supply zone I was waiting to engage after a retest of a double top, sweeten the deal.
What's better, this setup is within the supply zone of a bigger bearish bat pattern(that displayed a warning sign) on the 4-hourly timeframe(link can be found below).

EURUSD-Weekly Market Analysis-Dec19,Wk3Look at how the market respected the supply zone and slide down. The trade wasn't entered due to the UK General Election, I will be waiting for a retracement or retest of the high to engage the market.

Trade Ideas Position: AUDUSD SharkRested on the daily chart major resistance, the bearish shark pattern has formed and shared the same level as the deep gartley setup within the same timeframe.
Will be trading as a shark pattern as this is spotted before the gartley. Pending order set for this countertrend setup.

EURUSD-Weekly Market Analysis-Dec19,Wk2The bullish bat pattern is still valid, if the market head down and retest the entry price, I will engage a long trade after candle confirmation.
If the market extends upwards, I will short it. reason being, on the higher timeframe, is shows consolidation and either side of the market expansion is possible, that is because my trading style having the 1st target reach, I will shift stops to entry and keep the winner, therefore event market didn't expand, I'm ok with it too.
Because once market reaches the 1st target I will have no downside, only upside.

GBPUSD-Weekly Market Analysis-Dec19,Wk1A roomful of bats. that's what I love to call it, but do note that if the bearish bat is activated the bullish bat will be invalid.
This also means that the market may move into a sideways consolidation.
Within the supply and demand zone prices are expected to have rebound.


Trade Ideas Position: CADJPY BatA bearish bat setup that I've engaged as overall is a more bearish setting.
Due to recent low volatility, this setup for 2nd target does not have 2:1 setup.

ORLY HFT Gap Up to New All-Time HighORLY broke out of its sideways pattern with a High Frequency Trader gap up. It is now at another new all time high.

GBPCHF out of a 5-week congestion period!GBPCHF seems to have the necessary strength to get out of a 5-week congestion phase. that is quite unusual for such a volatile currency pair.
Buyers seem to push the price higher, already attempting once to break the resistance formed by the sideways trend. Bad news is that the price is currently also forming lower highs, showing a very tight pennant on the chart.
In this case, we need to have a second confirmation by buyers, so we will wait for a stronger action that would push the price out of the long term sideways trend and the short term pennant.

Trade Ideas Position: NZDJPYA bearish shark formation forms inline within the minimum requirement.
I will wait for a close of the 1-hourly candle and plan in for this countertrend trade within the sideways bounce setup, did I not mention it is also a bearish bat type2 setup. It will be a stack trade.

CELG Shifts SidewaysCELG hit a strong resistance level after a 3-week momentum trend. This resistance is strong. The consolidation has Professional Trader footprints.

Trade Ideas Educator: NZDJPY BatA bearish bat setup within the sideway bounce and within the type2 bearish shark setup on the 4-hourly timeframe is like the most amazing setup that enables me to stack trade.
Yeap, that's the new term I'm calling it, low-risk, high-return. Having any consolidation before the near completion of the pattern worries me and got me really uncomfortable. I will need confirmation to engage this trade.

GBPJPY getting out of the congestion period?GBPJPY recently has shown good action by buyers. I'm waiting to see if this action continues and is strong enough to take GBPJPY out of a sideways trend that seems to be very solid in the last period. I place my buy stop entry order out of the congestion phase to confirm the breakout and the strength by buyers.
Risk to reward is great for this trade :)

Trade Ideas Position: CADJPY SharkA shark pattern within another shark pattern setup on this trade. I was waiting for a retest but vola, I've spotted another bullish shark that provides a deeper entry for me to engage the trade.
If point C for the baby shark is not broken then I will have a deeper entry opportunity.

Trade Ideas Position: CADJPY SharkA bullish shark pattern has completed, as well as the 5-0pattern. Right now I'm waiting for the check-back(retest of the support) for a Type2 shark entry.
Pending order has been set, while I'm off to enjoy my weekend.


Trade Ideas Position: CADJPY SharkA bullish shark pattern setup as a countertrend trade on a sideways market.
I will wait for market confirmation to engage this trade and as this is a countertrend trade I will not extend any targets, personal preference.

GBPCHF Short Term Trend Reversal (Deep Pullback) Strategy
STRATEGY: Support and Resistance - Short Term Reversal Strategy
Long Term Trend Time Frame: 1D/4H
Focus Time Frame: 4H
Market Condition
1D Short Term: Sideways
1D Long Term: Uptrend
Area of Value (AOV)
Resistance: 1.2953 - 1.28901
Support: 1.24809 - 1.23807
Entry Trigger
4H: Price Rejection / Inside Bar
Entry Price (EP): 1.27482
Stop Loss (SL): 1.28223
Take Profit (TP): 1.24894
RRR: 3.49
Analysis
1D - Looking at 1D TF, we can see that the long term trend shows uptrend (86 days since Aug 11, 2019) and currently consolidating since Oct 17, 2019 (22 days). Current price is respecting 10 EMA which might be broken anytime soon. Once it breaks down, it might find support at 50 EMA on, Previous Resistance turned Support, or at Ascending Trend Line.
4H - Looking at 4H TF, price formed a descending channel which shows trend weakness. If it gets broken, the price may perform a deep pullback at Ascending Trend Line/50 EMA or at Previous Resistance Turned Support at 1D Time frame.
NOTE: This post is for my reference/journal purposes only. Trade at your own risk.

Trade Ideas Educator: GBPAUD BatA bearish Bat pattern forming up on the daily chart may hit sooner than expected due to the optimism of recent development of brexit deal.
Next week pose treat to this currency as both GBP and AUD will be of a highlight.
GBP due to Brexit talks and potential of dissolving the parliament and Queen's speech.
AUD is affected due to the development of China-USA trade war, though it's better now but any changes or development will affect AUD.
