Silver, Symmetrical Triangle AnalysisSilver has slowly created a long-term Symmetrical Triangle Pattern. There is also a Strong Support that already did his job many times, so there's no doubt that it will continue doing it even after the Triangle Breakout will arrive.
But now there's a even more important pattern doing very well ; the Rectangle is actually stronger than the Triangle and this pattern can be considered as a long-term Accumulation phase after the big downward trend finished at the beggining of 2016.
What do i think it's gonna happen now?
Well, i think that price is going to break the bearish resistance of the Triangle (the red line) and retest the resistance of the channel . In my opinion, the probability for it to break the long-term support (green area) is very low and just in the case it will, the area around 15 can be used as a new support level.
Sky is not the Limit
The informations and the strategies discussed are NOT recommendation to buy, sell or trade any securities. They are strictly for educational and illustrative purposes.
Sideways

BTC Puts On a Pink Floyd CD and Takes The Day Off.Oh wow man.
I'd tell you to eat my shorts, but I can't remember where they are.
Got any chips?
Oh yeah. And some Ice Cream?
And if your head is full of dark forebodings too...
I'll see you on the Dark Side of The Moon.

EUR/USD in sideways on this week.I believe that the EUR/USD will sideways in this week, with a small correction of the TVC:DXY , before turn way down more.

Ready for bulls?If the blue wave count is correct, another new high is not so far away
alternatively, complex sub wave e is also possible OR sub wave d is still unfolding (although less likely)

USDCAD Sideway weekUSDCAD moves in sideway since last week, we notice it's moving in rising channels inside the sideway, So we expect it's continuing in its move until exit from the yellow rectangle,
We expect big move once exciting, and pending that, We advice safe buy @1.2824 and sell @1.2885

Gold:Sideway trend ...We got our major structure levels.
And if we looking for pattern a nice Little 3 drives.
Nothing else to see.
Just a boring sideway trend.

BTC: Bulls Hesitant on Follow Through [MicroAnalysis]BTC Microanalysis: "Forest for the trees but the trees still make the forest."
After a good consolidation and pump, bulls are giving up the momentum a little too early by failing the 5th-wave breakout on smaller time frames, taking all 5 wave attempts just to reach the 141 extension. Normal follow through after a consolidation/pump will typically reach the 161 by the 5th wave at minimum, many times by the 3rd wave.
As long as BTC holds above 9k, the Adam & Eve scenario is still looking good, but this does point to some sideways action and raises the potential risk of downside for the time being.

BTC USD - Who will win? Bulls or bears?Morning traders! Here we are with the bitcoin! Easy setup for it , is moving sideways between 7.8k and 8.4k , a lot of people are waiting for a breakout of this rectangle to understand the next move of the BTC , meanwhile in daily timeframe the price is going to reach EMA 200 and 100 , It could act as resistance zone. Be patient!

EURUSD we are in a sideways moveHi Guys, I posted an idea in past about eurusd downside, but to me this downside looks corrective than impulsive, that means eurusd is now on upside for long term, for now we are in big sideways correction that might take pretty long time.

Intraday OpportunityHello buddies,
Last prediction is reached.
Let's see today forecast.
Today my algo shows the daily target is within 6,855-6,858 level,
which is already reached by today's transactions.
Market may be in sideways mood.
The activity range could be between 6660-ish level to 6890-ish level.
There is a possibility that market could reach 6,916-ish level.
Hit:Miss ratio is 48:52, which is not promising.
However, the accuracy for being higher then the opening price is around 80%.
The market is in temporal long.
Have a nice day.

BTC -INVERSE BART SIMPSON HEAD AT PLAYOn my last chart i gave you that Pennant, that i commented meant nothing. It broke down in the beginning but bounced upwards after, manipulation is at play. So TA is incredibly hard to get accurate at the moment...
As for now, Inverse Bart head on the 2h
Will we create his neck line?
Doesn't seem likely , 6900 has been a resistance for BTC as of recently. Bulls tried several times, and volume is low.
Maybe while i sleep some new Bulls will break it. If not we shouldn't have much of a drop so not to worry. Sorry about the bland chart btw, i don't feel comfortable making a call on BTC recently because it isn't following most TA rules. If you see the top authors they are mostly wrong, a few times being right.

long term closing triangleRemoved many in-analysis parameters & indicators for provide clear vision to readers.
Here is the long term lines on both ways. Blue line comes from 25 May 2017 . it is on 7500 $ level. strong support level.
If down more, have red line comes from July 2017. it is on 7000 $ level currently. buying around support levels and sell at orange level can be useful. If it will down below red line, stop loss can save life.
this triangle will be close latest at 17 April and will have new trend.
Watch and see.
EURGBP trend analysisThis post (comment) is for educational purposes only. Past trading results
DO NOT guarantee future performance.
Hi everyone i was doing analysis for EUR/GBP currency pair, now i see somekind of consolidation of this pair, the market is in balance. If the balance is going to be broken, we can have a continuation bearish trend.

ALT SEASON OR BTC BULL RUN?They say people only see what they want to believe, that markets exist to make fools of the overly hopeful...
Well, half of the crowd is calling for an alt season, and the other half for a new BTC all time high. IMO both groups are jumping the gun as we are still in a downtrend! In order for either to occur BTC needs to enter a sideways accumulation phase first.
On the log 1D I see a clear uptrend & downtrend, based on which I can assume we will narrowly escape this downward spiral in mid-April and have ourselves an alt-season. Why not a BTC bull run? Simple - we can't start another BTC run-up until we consolidate, and historically we see that when BTC consolidates, alts flourish! BTC has yet to move sideways whereas many alts have been bottomed out for months already.
Of course, neither alt nor BTC can flourish with the low volume we're having lately - we need a newfound public optimism in the cryptosphere to proceed. Furthermore, for 2018 to be the biggest year for crypto yet, we will need institutional money to enter as well, which we all know is waiting for the green light from regulators. With most of the FUD from this past quarter exhausted, & though its contradictory to my opening sentence, I feel HOPEFUL for the remainder of 2018 :).
Just my thoughts, happy trading!

EurGbp cypher Bullish on the daily, with the "sideway trend" "Hello! Hope u all have a great weekend.
Here we are looking on the EurGbp, and the daily time frame, we got a sideway trend, it doesen't know wich way the want to move.
And behind the lines, we got a cypher pattern.
We will just wait for the D leg to complete.
D complete on : 0.87511.
Targets 1: 0.88320
Targets 2: 0.88842
Stop loss: 0.86667
1:1 trade.
RSI: close to oversold.

Possible sideways for GVT pre alpha release... then ATHGVT has shown prolonged periods of sideways movement after every correction with erratic peaks and dips between the start and end of each wave.
note: the lowest dip of that third curve (crossover between wave 4 and wave 5, aka bearish to bullish) is right on 31st March... alpha release :-)

Will BTCUSD break out of the sideways trend today?We will see another test of the red dashed upper borderline of the down channel and the support line S1 at 8486. The sideways trend remains intact until the support level S1 will be broken.
There is a target of the double top formation at 6852. The overall sentiment remains bearish as long as BTCUSD is below Pivot point.

Bitcoin is just hanging about. BTCUSD is still goofing around the upper borderline (red dashed line) of the down channel. It is also near Pivot point (9267) and we expect another day of sideways movement.

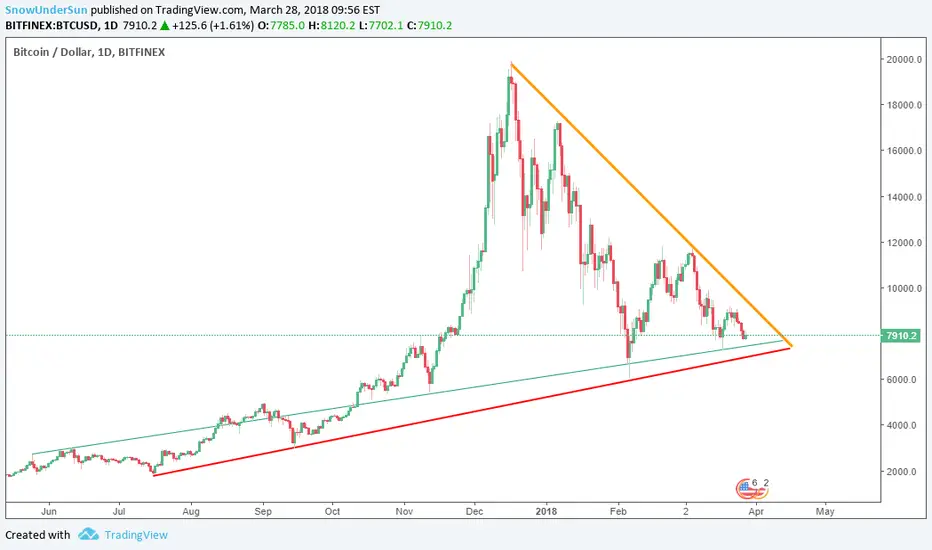
cold weather on Bitcoin.Yesterday stormed all indicators with panic sells after loosing trust on a exchange platform. we are already below of 50 days MA. we are at edge of line.
If BTC can not move above channel in today close, it may down to 200 days MA ( orange line ) or more lower edges ( blue and red ) of triange.
if recover in daily close, still have hope to see sun.
both options are still on table. watch closely
educational purposes only. take your own risk

BTCUSD is still locked inside a sideways trend.The daily chart is still locked in a sideways channel between 9280 and 11788. Watch out for an outbreak of this channel.
Pivot point is at 10070.

LITECOIN - Jack in the box! Just be patient.LTC looking for a break we have now been in a downward trend for a few days, we are now in accumulation within the red channel the longer we are here the bigger the break.
I will not be trading LTC until we confirm a breakout it could be days, weeks but once we close above the red line on top of channel its a buy.
Current resistance is the 20 day EMA at .0186
RSI needs to break redline and hold above as the first signal to then monitor for the break and candle to close over the red line.
I will not buy until a candle closes over the top of .0186
If your holding LTC expect some sideways action I would personally exit and renter later to not have funds tied up dead.
Earn and learn people!

Trading in channel, sideways until we break high...TRST is currently going sideways but the RSI showing signs of a positive divergence and high probability we will break the channel high.
You can profit from this until we see the break buy the red line sell the green line. Only sell the green line when you have see that you have a downward bar maybe go down to hourly candles for this.
If we break the top green line hold but set stop loss on the green bar.
Easy trade 2-5% profit per day, safe trade, slow trade boring for some to me profit is profit I will take it.

Litecoin Short Term TA Day 16Happy monday everyone. Litecoin hasn't been to exciting the last few days. We have been closing in a newly formed pennant (green trend lines). We still have a few days before that closes in, so I expect us to continue moving sideways bouncing off both the support and resistance. This could of course change any moment as you know with cryptos.
Currently, we are trying to maintain our short term support of our current bullish pattern. The Stoch Rsi is suggesting a bounce off the support as expected, but lets see if it can hold up. If we want to continue this trend, we will need to get past the $216 mark. That is where our main resistance is and breaking that will break our current pennant that I mentioned earlier. Personally, I expect us to bounce off it, but you never know...
If we do break our current short term support, our next main support will be in the upper $200's. I don't expect us to go any lower than $206 unless the volume increases and there is a sell off.
I apologize that I have not posted any new updated TA's last week. I have been busy with mid terms and just now caught a break. It worked out though because LTC has pretty much only been moving sideways and nothing to crazy has happened.
If we break our main resistance or support, I will update this. Otherwise, I expect us to continue moving sideways.
Check out my previous day TA'S in the related ideas section and please like/follow if you would like to stay updated with my daily TA's. Have a great guys
