Gold Surges on Weak NFP Hello everyone, what’s your take on XAUUSD?
Gold prices soared at the end of the last session and are now trading around $3,380. This sharp rise followed a weaker-than-expected U.S. Non-Farm Payrolls (NFP) report, which shifted market sentiment toward expectations that the Fed may delay interest rate cuts. As a result, the U.S. dollar weakened and demand for gold as a safe haven surged.
Technically, gold appears to be forming a cup and handle pattern, with the first resistance target at $3,400, followed by $3,435.
What do you think? Could this rally continue? Let us know in the comments!
Signal

EURUSD Faces Renewed Selling PressureHello, what are your thoughts on EURUSD?
After failing to break above the 1.1600 level, the EUR/USD pair is now facing strong selling pressure again, currently testing the mid-1.1500s on Monday. Meanwhile, the US Dollar has seen a modest rebound across the board as investors digest Friday’s sharp drop following weaker-than-expected US jobs data.
From a technical standpoint, this setup may lead EURUSD to even lower levels. The recent movement aligns well with our previous outlook and follows the Dow Theory principles.
I'm expecting the price to continue its correction—what about you?
EURUSD – Which Way Will It Break?Hello everyone, what are your thoughts on the EURUSD trend?
EURUSD is currently experiencing a Bollinger Bands squeeze, signaling a potential breakout in either direction. The price is trading near the lower limit, hovering around 1.157 , with two potential scenarios unfolding:
Bullish scenario: The price could break upward toward 1.172, testing the upper resistance zone.
Bearish scenario: If the price falls below the lower limit, it could head towards the sell target at 1.140.
💬 For me, I’m leaning toward FOMO (Fear of Missing Out) and following the sell trend with a target of 1.140. What about you? Let me know your thoughts in the comments below!

GBPUSD – Trendline Broken, More Downside Ahead?Hello traders! What’s your take on GBPUSD?
The GBP/USD pair has broken below its long-term ascending trendline and is now trading beneath a key resistance zone. After a failed breakout at the newly formed trendline, price quickly reversed and dropped sharply.
This resistance zone previously acted as a strong support level but has now been flipped to resistance. If price fails to reclaim this area during the next pullback, the bearish outlook will be further confirmed.
💬 Do you think GBPUSD will bounce from the 1.32 region, or will it continue falling toward the lower targets? Share your thoughts below!

GBPUSD – Bearish Bounce Loading?Hello TradingView Family / Fellow Traders. This is Richard, also known as theSignalyst.
📈GBPUSD has been overall bearish trading within the falling channel marked in red and it is currently in a correction phase.
Moreover, the blue zone is a strong supply.
📚 As per my trading style:
As #GBPUSD approaches the red circle zone, I will be looking for bearish reversal setups (like a double top pattern, trendline break , and so on...)
📚 Always follow your trading plan regarding entry, risk management, and trade management.
Good luck!
All Strategies Are Good; If Managed Properly!
~Rich
Disclosure: I am part of Trade Nation's Influencer program and receive a monthly fee for using their TradingView charts in my analysis.

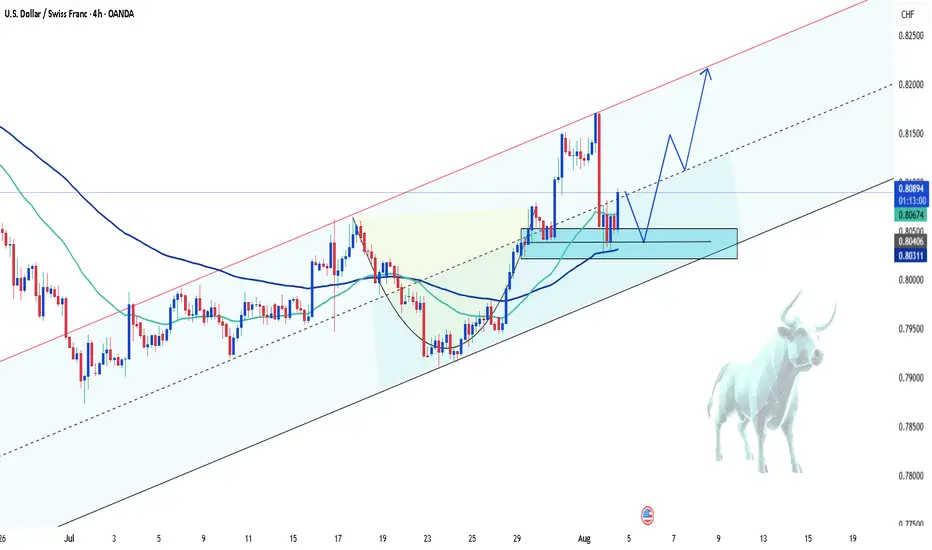
USDCHF – Bullish comeback in progress?Hey everyone! What’s your take on the current trend of USDCHF?
While the pair experienced a recent dip, take a step back and look at the bigger picture — doesn’t it still seem to be moving within an ascending channel?
Right now, USDCHF is hovering around 0.8092 and starting to bounce back. The recovery appears to be supported by a newly formed support zone and the confluence of the EMA 34 and 89. The pair seems to be eyeing the recent high, with potential to climb further toward the upper boundary of the channel.
My current bias? Bullish.
What about you — do you see the same opportunity?
Drop a comment and hit like if you’re on the same page!
AUD/USD Long Trade Setup – Buying at the Channel LowOANDA:AUDUSD
🔍 Technical Overview:
The pair is trading within a well-defined ascending channel.
A potential bullish reversal is forming at the confluence of:
Channel support
Local structural support (highlighted in orange circle)
Bullish wick rejections and slowing downside momentum
📈 Trade Idea: BUY AUD/USD
Entry: Market buy or buy near 0.6450 – 0.6465
Stop-Loss: Below the swing low and channel support at 0.64160
Target 1: 0.65150
Target 2: 0.6566
Target 3: 0.66160
Risk-to-Reward: ~1:3 R:R ratio
Monitor price action near mid-channel resistance
🧠 “If the structure speaks to you, let it echo.” – Let the price action confirm your bias before committing fully.
Previous Sell Setup at the top of channel:
Psychology Always Matters:

Gold Set to Reach Historic HighsHello everyone, great to see you again!
Gold has been on a strong upward trajectory, breaking previous bearish structures and showing solid growth momentum. Market sentiment is heavily supported by the weakening of global currencies, particularly the US dollar, and expectations surrounding the potential interest rate cuts by the Federal Reserve.
Looking at the technical picture, we are approaching the historic peak of $3,433. The gold market is showing significant strength, confirmed by EMA 34 and EMA 89, as well as new support zones, signaling a trend reversal and confirming the bullish outlook.
The next few trading sessions could play a critical role in confirming whether the precious metal can break the all-time highs.
What do you think? Is gold about to make history? Let me know in the comments below!

USDJPY Bullish Momentum Continues ? Hello traders, what do you think about USDJPY?
As of now, USDJPY is showing a slight upward movement after the recent correction. The price is trading around 147.59, not changing much since the beginning of the session.
The Japanese yen remains under pressure due to Japan’s slow recovery and ongoing economic challenges, giving USD an edge to capitalize on recent gains.
From a technical standpoint, USDJPY is moving in an ascending wedge pattern. After testing the trendline support near 147, the pair could be headed toward the psychological target of 150, or even higher towards the upper trendline boundary in the coming days.
Keep an eye on the price action near key resistance levels as the market continues to evaluate global economic factors, especially the upcoming US jobs data and Fed policy outlook.
What’s your take on USDJPY? Do you expect this pair to rise further? Let me know in the comments below!

Gold - M30 Buy SetupOANDA:XAUUSD TVC:GOLD
Timeframe: m30
Risk Level: Low-Medium
🔹 Setup:
Price is testing the boundary of the ascending channel and retesting the support @ 3350
📈 Entry:
Current price zone: 3360-65
🎯 Targets (TP):
TP1: 3375
TP2: 3385
TP4: 3410
TP6: 3430
⛔ Stop Loss (SL):
3349
H4 Overview:
PEPPERSTONE:XAUUSD
#XAUUSD #GOLD #Buy #Signal #MJTrading
Psychology Always Matters:

GBPNZD Under Pressure! SELL!
My dear friends,
Please, find my technical outlook for GBPNZD below:
The price is coiling around a solid key level - 2.2531
Bias - Bearish
Technical Indicators: Pivot Points High anticipates a potential price reversal.
Super trend shows a clear sell, giving a perfect indicators' convergence.
Goal - 2.2463
About Used Indicators:
The pivot point itself is simply the average of the high, low and closing prices from the previous trading day.
Disclosure: I am part of Trade Nation's Influencer program and receive a monthly fee for using their TradingView charts in my analysis.
———————————
WISH YOU ALL LUCK

AUDUSD: Great Trading Opportunity
AUDUSD
- Classic bearish pattern
- Our team expects retracement
SUGGESTED TRADE:
Swing Trade
Sell AUDUSD
Entry - 0.6475
Stop - 0.6480
Take - 0.6464
Our Risk - 1%
Start protection of your profits from lower levels
Disclosure: I am part of Trade Nation's Influencer program and receive a monthly fee for using their TradingView charts in my analysis.
❤️Please, support our work with like & comment!❤️

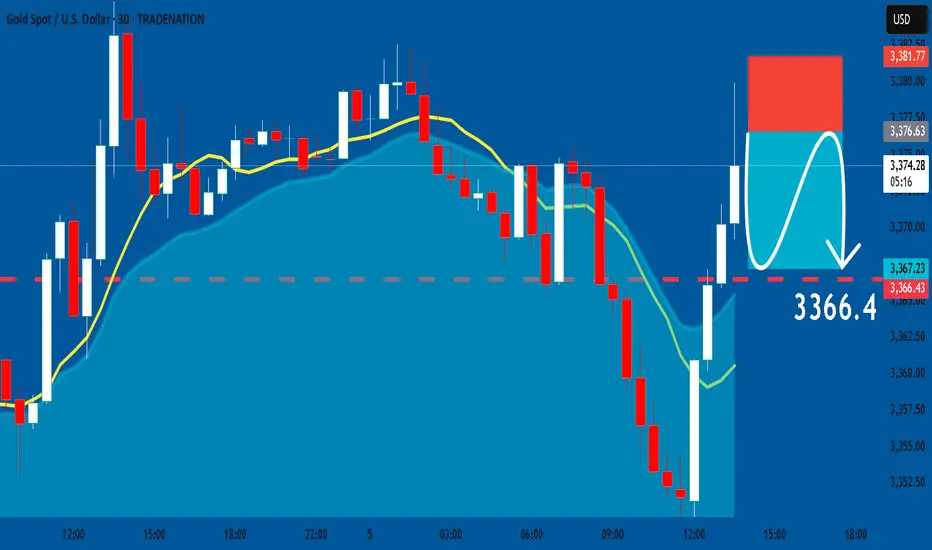
GOLD: Short Signal with Entry/SL/TP
GOLD
- Classic bearish setup
- Our team expects bearish continuation
SUGGESTED TRADE:
Swing Trade
Short GOLD
Entry Point - 3376.5
Stop Loss - 3381.7
Take Profit - 3366.4
Our Risk - 1%
Start protection of your profits from lower levels
Disclosure: I am part of Trade Nation's Influencer program and receive a monthly fee for using their TradingView charts in my analysis.
❤️ Please, support our work with like & comment! ❤️
GBPUSD Massive Short! SELL!
My dear friends,
My technical analysis for GBPUSD is below:
The market is trading on 1.3309 pivot level.
Bias - Bearish
Technical Indicators: Both Super Trend & Pivot HL indicate a highly probable Bearish continuation.
Target - 1.3295
Recommended Stop Loss - 1.3316
About Used Indicators:
A pivot point is a technical analysis indicator, or calculations, used to determine the overall trend of the market over different time frames.
Disclosure: I am part of Trade Nation's Influencer program and receive a monthly fee for using their TradingView charts in my analysis.
———————————
WISH YOU ALL LUCK

EURUSD What Next? BUY!
My dear subscribers,
EURUSD looks like it will make a good move, and here are the details:
The market is trading on 1.1551 pivot level.
Bias - Bullish
My Stop Loss - 1.1540
Technical Indicators: Both Super Trend & Pivot HL indicate a highly probable Bullish continuation.
Target - 1.1569
About Used Indicators:
The average true range (ATR) plays an important role in 'Supertrend' as the indicator uses ATR to calculate its value. The ATR indicator signals the degree of price volatility.
Disclosure: I am part of Trade Nation's Influencer program and receive a monthly fee for using their TradingView charts in my analysis.
———————————
WISH YOU ALL LUCK

EURCAD Buyers In Panic! SELL!
My dear subscribers,
This is my opinion on the EURCAD next move:
The instrument tests an important psychological level 1.5952
Bias - Bearish
Technical Indicators: Supper Trend gives a precise Bearish signal, while Pivot Point HL predicts price changes and potential reversals in the market.
Target - 1.5888
About Used Indicators:
On the subsequent day, trading above the pivot point is thought to indicate ongoing bullish sentiment, while trading below the pivot point indicates bearish sentiment.
Disclosure: I am part of Trade Nation's Influencer program and receive a monthly fee for using their TradingView charts in my analysis.
———————————
WISH YOU ALL LUCK

EURCAD What Next? BUY!
My dear friends,
My technical analysis for EURCAD is below:
The market is trading on 1.5784 pivot level.
Bias - Bullish
Technical Indicators: Both Super Trend & Pivot HL indicate a highly probable Bullish continuation.
Target - 1.5907
About Used Indicators:
A pivot point is a technical analysis indicator, or calculations, used to determine the overall trend of the market over different time frames.
Disclosure: I am part of Trade Nation's Influencer program and receive a monthly fee for using their TradingView charts in my analysis.
———————————
WISH YOU ALL LUCK

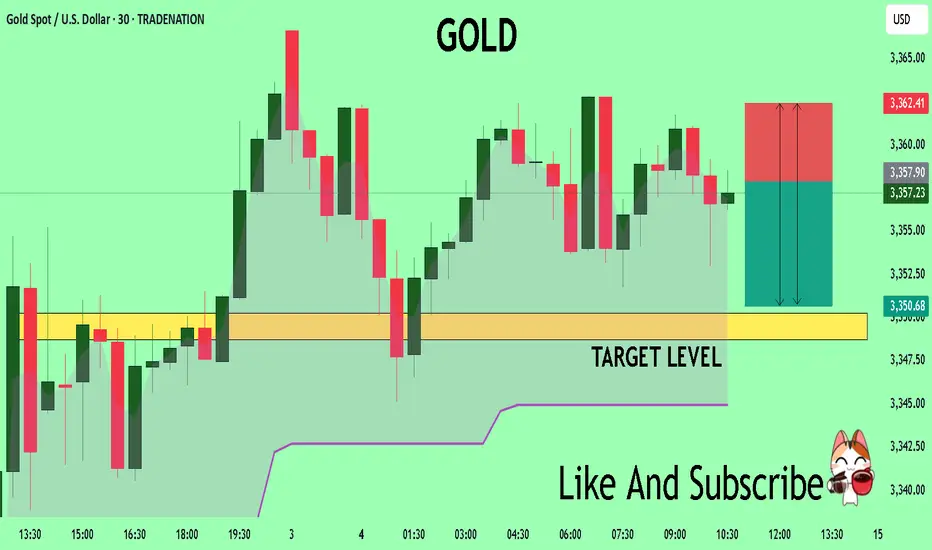
GOLD A Fall Expected! SELL!
My dear subscribers,
My technical analysis for GOLD is below:
The price is coiling around a solid key level - 3358.0
Bias - Bearish
Technical Indicators: Pivot Points Low anticipates a potential price reversal.
Super trend shows a clear sell, giving a perfect indicators' convergence.
Goal - 3350.7
My Stop Loss - 3362.4
About Used Indicators:
By the very nature of the supertrend indicator, it offers firm support and resistance levels for traders to enter and exit trades. Additionally, it also provides signals for setting stop losses
Disclosure: I am part of Trade Nation's Influencer program and receive a monthly fee for using their TradingView charts in my analysis.
———————————
WISH YOU ALL LUCK
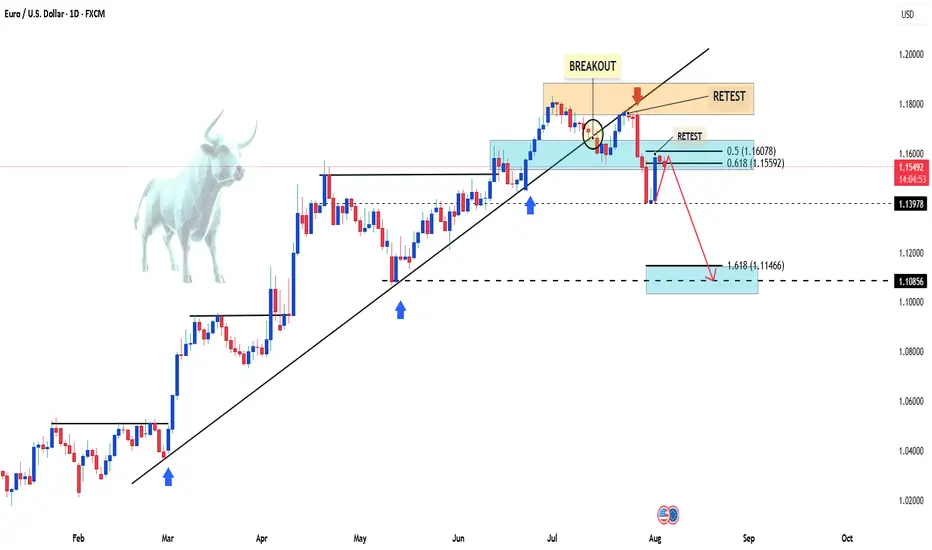
EURUSD – Bearish pullback in play ? EURUSD has broken the ascending trendline and dropped below the EMA confluence, confirming a bearish structure. The current rebound is testing the 0.5–0.618 Fibonacci zone, but weak buying pressure and rejection candles suggest it’s likely just a technical pullback.
If momentum holds, the pair may resume its downtrend toward 1.1400 and potentially 1.1296. The bears remain in control unless strong fundamentals shift the balance.

GOLD Buyers In Panic! SELL!
My dear friends,
Please, find my technical outlook for GOLD below:
The instrument tests an important psychological level 3309.2
Technical Indicators: Supper Trend gives a precise Bearish signal, while Pivot Point HL predicts price changes and potential reversals in the market.
Target - 3296.9
Recommended Stop Loss - 3316.4
About Used Indicators:
Super-trend indicator is more useful in trending markets where there are clear uptrends and downtrends in price.
Disclosure: I am part of Trade Nation's Influencer program and receive a monthly fee for using their TradingView charts in my analysis.
———————————
WISH YOU ALL LUCK

USDJPY My Opinion! BUY!
My dear friends,
My technical analysis for USDJPY is below:
The market is trading on 147.23 pivot level.
Bias - Bullish
Technical Indicators: Both Super Trend & Pivot HL indicate a highly probable Bullish continuation.
Target - 148.77
About Used Indicators:
A pivot point is a technical analysis indicator, or calculations, used to determine the overall trend of the market over different time frames.
Disclosure: I am part of Trade Nation's Influencer program and receive a monthly fee for using their TradingView charts in my analysis.
———————————
WISH YOU ALL LUCK

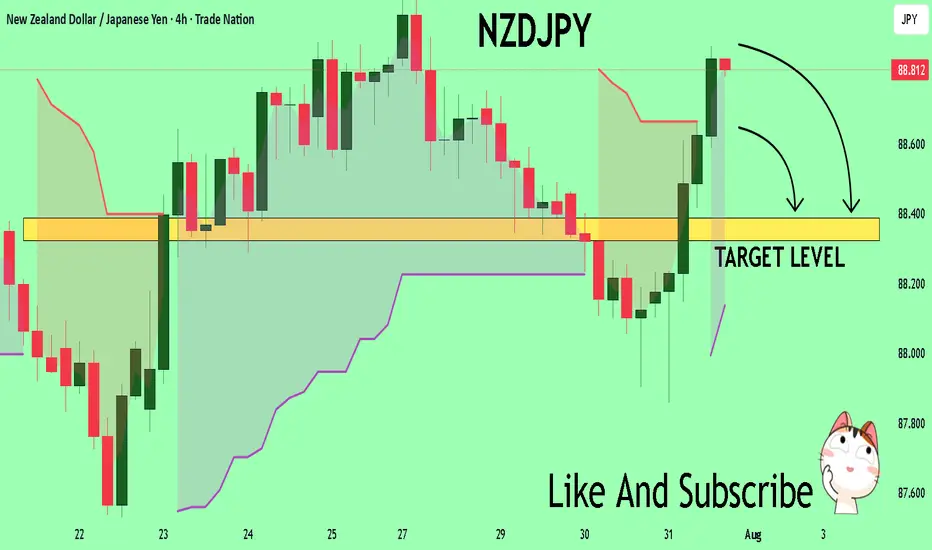
NZDJPY The Target Is DOWN! SELL!
My dear friends,
Please, find my technical outlook for NZDJPY below:
The price is coiling around a solid key level - 88.806
Bias - Bearish
Technical Indicators: Pivot Points Low anticipates a potential price reversal.
Super trend shows a clear sell, giving a perfect indicators' convergence.
Goal - 88.388
About Used Indicators:
The pivot point itself is simply the average of the high, low and closing prices from the previous trading day.
Disclosure: I am part of Trade Nation's Influencer program and receive a monthly fee for using their TradingView charts in my analysis.
———————————
WISH YOU ALL LUCK
GBPCHF: Short Signal with Entry/SL/TP
GBPCHF
- Classic bearish setup
- Our team expects bearish continuation
SUGGESTED TRADE:
Swing Trade
Short GBPCHF
Entry Point - 1.0741
Stop Loss - 1.0754
Take Profit - 1.0714
Our Risk - 1%
Start protection of your profits from lower levels
Disclosure: I am part of Trade Nation's Influencer program and receive a monthly fee for using their TradingView charts in my analysis.
❤️ Please, support our work with like & comment! ❤️
