QQQ Nasdaq 100 Year-End Price Target and Technical Rebound SetupIf you haven`t bought the previous oversold area on QQQ:
Now the Nasdaq-100 ETF (QQQ), which tracks the performance of the largest non-financial companies in the Nasdaq, has recently entered oversold territory, suggesting that a technical rebound may be imminent. Similar to the Russell 2000, QQQ has experienced significant selling pressure, driving key technical indicators into oversold zones and creating favorable conditions for a bounce.
The Relative Strength Index (RSI) has dropped below 30, a level that typically signals oversold conditions and the potential for a reversal. Additionally, QQQ is trading near key support levels, with a large portion of its components underperforming their 50-day and 200-day moving averages — a classic setup for a mean reversion rally.
From a historical perspective, QQQ has shown a tendency to rebound strongly after similar oversold conditions, particularly when macroeconomic factors stabilize and buying pressure returns. Given the current technical setup, my price target for QQQ is $550 by the end of the year. This represents a recovery of approximately 8-10% from current levels, aligning with previous post-oversold rallies in the index.
While downside risks remain — including potential volatility around Federal Reserve policy and broader economic data — the technical backdrop suggests that QQQ is well-positioned for a recovery in the coming months.
Signal

AUDJPY – Trade the Range… Until It EndsHello TradingView Family / Fellow Traders. This is Richard, also known as theSignalyst.
📈AUDJPY has been trading within a big range marked in red.
Moreover, the it is retesting the lower bound of its rising channel marked in blue.
🏹 Thus, the highlighted blue circle is a strong area to look for buy setups as it is the intersection of support and lower blue trendline acting as a non-horizontal support.
📚 As per my trading style:
As #AUDJPY approaches the blue circle zone, I will be looking for bullish reversal setups (like a double bottom pattern, trendline break , and so on...)
📚 Always follow your trading plan regarding entry, risk management, and trade management.
Good luck!
All Strategies Are Good; If Managed Properly!
~Rich
Disclosure: I am part of Trade Nation's Influencer program and receive a monthly fee for using their TradingView charts in my analysis.

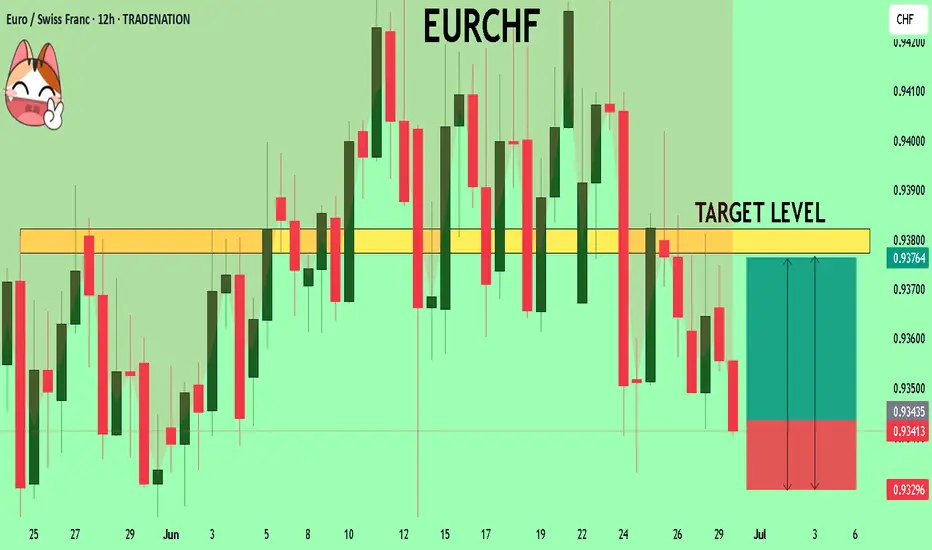
EURCHF What Next? BUY!
My dear friends,
Please, find my technical outlook for EURCHF below:
The instrument tests an important psychological level 0.9343
Bias - Bullish
Technical Indicators: Supper Trend gives a precise Bullish signal, while Pivot Point HL predicts price changes and potential reversals in the market.
Target - 0.9377
Recommended Stop Loss - 0.9329
About Used Indicators:
Super-trend indicator is more useful in trending markets where there are clear uptrends and downtrends in price.
Disclosure: I am part of Trade Nation's Influencer program and receive a monthly fee for using their TradingView charts in my analysis.
———————————
WISH YOU ALL LUCK
AUDCAD: Short Trade with Entry/SL/TP
AUDCAD
- Classic bearish formation
- Our team expects fall
SUGGESTED TRADE:
Swing Trade
Sell AUDCAD
Entry Level - 0.8940
Sl - 0.8963
Tp - 0.8889
Our Risk - 1%
Start protection of your profits from lower levels
Disclosure: I am part of Trade Nation's Influencer program and receive a monthly fee for using their TradingView charts in my analysis.
❤️ Please, support our work with like & comment! ❤️

EURUSD Under Pressure! SELL!
My dear subscribers,
My technical analysis for EURUSD is below:
The price is coiling around a solid key level - 1.1726
Bias - Bearish
Technical Indicators: Pivot Points High anticipates a potential price reversal.
Super trend shows a clear sell, giving a perfect indicators' convergence.
Goal - 1.1612
My Stop Loss - 1.1783
About Used Indicators:
By the very nature of the supertrend indicator, it offers firm support and resistance levels for traders to enter and exit trades. Additionally, it also provides signals for setting stop losses
Disclosure: I am part of Trade Nation's Influencer program and receive a monthly fee for using their TradingView charts in my analysis.
———————————
WISH YOU ALL LUCK

GBPCHF My Opinion! BUY!
My dear followers,
I analysed this chart on GBPCHF and concluded the following:
The market is trading on 1.0911 pivot level.
Bias - Bullish
Technical Indicators: Both Super Trend & Pivot HL indicate a highly probable Bullish continuation.
Target - 1.0951
About Used Indicators:
A super-trend indicator is plotted on either above or below the closing price to signal a buy or sell. The indicator changes color, based on whether or not you should be buying. If the super-trend indicator moves below the closing price, the indicator turns green, and it signals an entry point or points to buy.
Disclosure: I am part of Trade Nation's Influencer program and receive a monthly fee for using their TradingView charts in my analysis.
———————————
WISH YOU ALL LUCK

GBPCAD Set To Grow! BUY!
My dear friends,
GBPCAD looks like it will make a good move, and here are the details:
The market is trading on 1.8698 pivot level.
Bias - Bullish
Technical Indicators: Supper Trend generates a clear long signal while Pivot Point HL is currently determining the overall Bullish trend of the market.
Goal - 1.8728
About Used Indicators:
Pivot points are a great way to identify areas of support and resistance, but they work best when combined with other kinds of technical analysis
Disclosure: I am part of Trade Nation's Influencer program and receive a monthly fee for using their TradingView charts in my analysis.
———————————
WISH YOU ALL LUCK

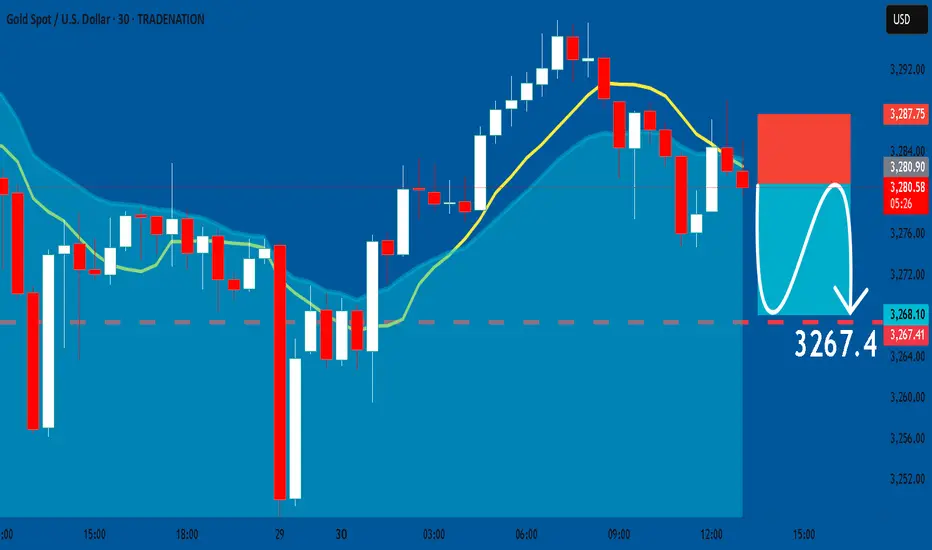
GOLD: Bearish Continuation & Short Signal
GOLD
- Classic bearish formation
- Our team expects pullback
SUGGESTED TRADE:
Swing Trade
Short GOLD
Entry - 3280.9
Sl - 3287.7
Tp - 3267.4
Our Risk - 1%
Start protection of your profits from lower levels
Disclosure: I am part of Trade Nation's Influencer program and receive a monthly fee for using their TradingView charts in my analysis.
❤️ Please, support our work with like & comment! ❤️
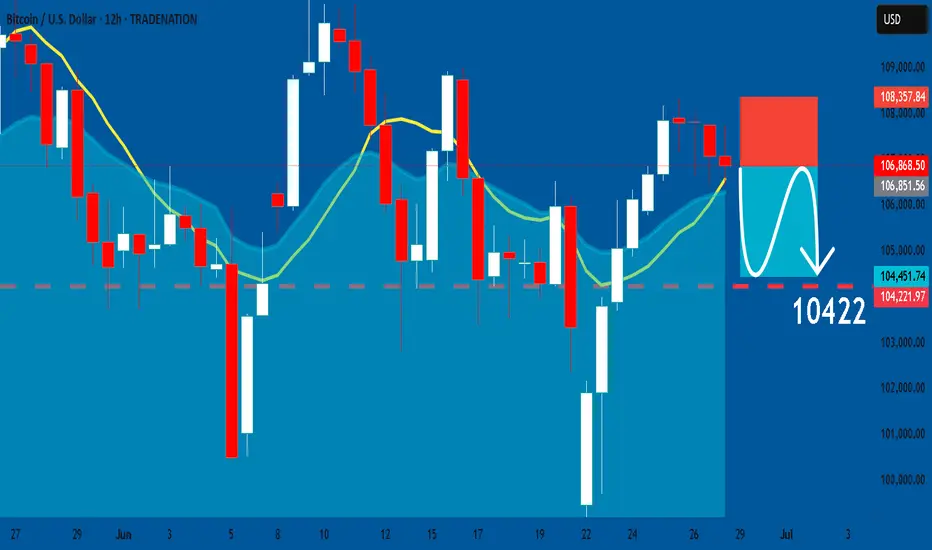
BTCUSD: Bearish Continuation & Short Signal
BTCUSD
- Classic bearish pattern
- Our team expects retracement
SUGGESTED TRADE:
Swing Trade
Sell BTCUSD
Entry - 10686
Stop - 10837
Take - 10422
Our Risk - 1%
Start protection of your profits from lower levels
Disclosure: I am part of Trade Nation's Influencer program and receive a monthly fee for using their TradingView charts in my analysis.
❤️ Please, support our work with like & comment! ❤️
USOIL The Target Is UP! BUY!
My dear friends,
USOIL looks like it will make a good move, and here are the details:
The market is trading on 65.03 pivot level.
Bias - Bullish
Technical Indicators: Supper Trend generates a clear long) signal while Pivot Point HL is currently determining the overall Bullish trend of the market.
Goal - 68.89
Recommended Stop Loss - 63.01
About Used Indicators:
Pivot points are a great way to identify areas of support and resistance, but they work best when combined with other kinds of technical analysis
Disclosure: I am part of Trade Nation's Influencer program and receive a monthly fee for using their TradingView charts in my analysis.
———————————
WISH YOU ALL LUCK

EURUSD: Short Trading Opportunity
EURUSD
- Classic bearish setup
- Our team expects bearish continuation
SUGGESTED TRADE:
Swing Trade
Short EURUSD
Entry Point - 1.1717
Stop Loss - 1.1764
Take Profit - 1.1614
Our Risk - 1%
Start protection of your profits from lower levels
Disclosure: I am part of Trade Nation's Influencer program and receive a monthly fee for using their TradingView charts in my analysis.
❤️ Please, support our work with like & comment! ❤️

SILVER Sellers In Panic! BUY!
My dear friends,
Please, find my technical outlook for SILVER below:
The price is coiling around a solid key level - 35.993
Bias -Bullish
Technical Indicators: Pivot Points Low anticipates a potential price reversal.
Super trend shows a clear buy, giving a perfect indicators' convergence.
Goal - 36.378
About Used Indicators:
The pivot point itself is simply the average of the high, low and closing prices from the previous trading day.
Disclosure: I am part of Trade Nation's Influencer program and receive a monthly fee for using their TradingView charts in my analysis.
———————————
WISH YOU ALL LUCK

BTCUSD – Major Decision Point at The Edge📍 By: MJTrading |||
Bitcoin has rallied sharply from ~$98K and is now testing a critical confluence zone — the top of the descending channel and a strong supply area, known as "The Edge."
EMAs are turning up, supporting bullish momentum
⏳ What’s Next?
At this stage, two scenarios emerge:
⚠️ This is a make-or-break zone:
🟩 Breakout above the channel signals trend reversal → next resistance: $111K
🟨 Rejection leads to a move back to the $103K or $100K levels
This setup offers a high-RR opportunity for both breakout traders and mean reversion players.
🧠 Trade the reaction at the edge, not the prediction.
Thanks for your attention...
Share your thoughts...
—
#BTCUSD #Bitcoin #CryptoTrading #TheEdge #BreakoutOrBounce #CryptoSetup #DescendingChannel #SmartMoney #TechnicalAnalysis #PriceAction #SwingTrade #EMA #RiskReward #MJTrading #4hChart #TrendDecision #SupplyZone

USOIL: Long Trading Opportunity
USOIL
- Classic bullish pattern
- Our team expects retracement
SUGGESTED TRADE:
Swing Trade
Buy USOIL
Entry - 65.03
Stop - 62.60
Take - 69.73
Our Risk - 1%
Start protection of your profits from lower levels
Disclosure: I am part of Trade Nation's Influencer program and receive a monthly fee for using their TradingView charts in my analysis.
❤️ Please, support our work with like & comment! ❤️

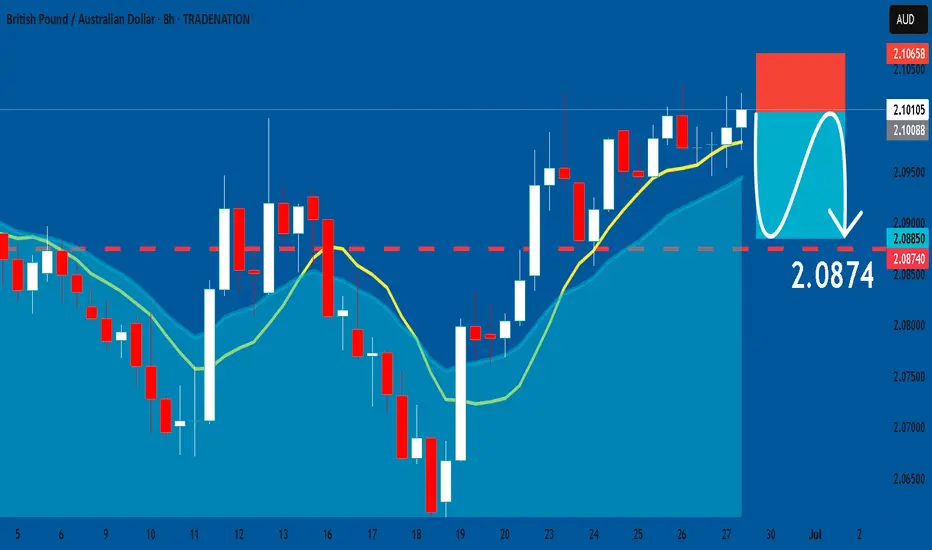
GBPAUD: Short Trade Explained
GBPAUD
- Classic bearish formation
- Our team expects fall
SUGGESTED TRADE:
Swing Trade
Sell GBPAUD
Entry Level - 2.1010
Sl - 2.1065
Tp - 2.0874
Our Risk - 1%
Start protection of your profits from lower levels
Disclosure: I am part of Trade Nation's Influencer program and receive a monthly fee for using their TradingView charts in my analysis.
❤️ Please, support our work with like & comment! ❤️
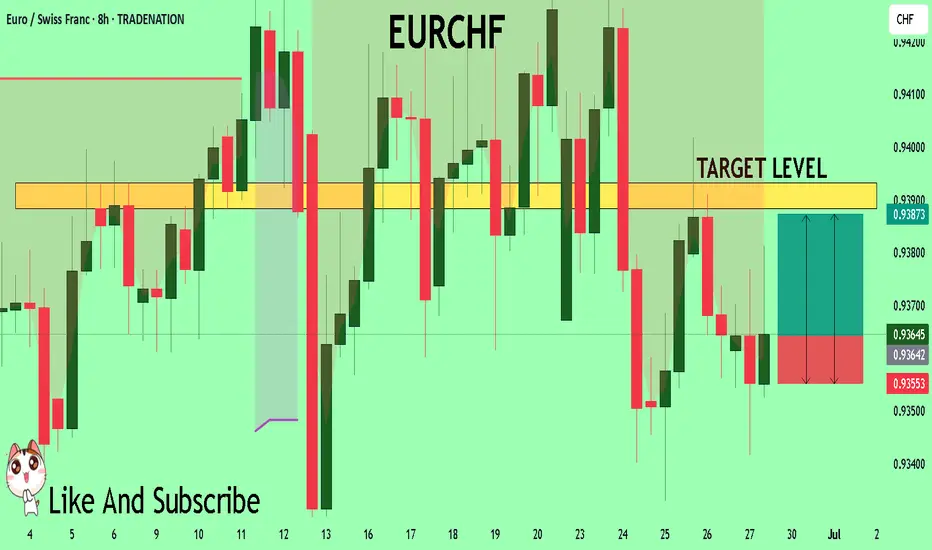
EURCHF Massive Long! BUY!
My dear friends,
Please, find my technical outlook for EURCHF below:
The price is coiling around a solid key level - 0.9364
Bias - Bullish
Technical Indicators: Pivot Points Low anticipates a potential price reversal.
Super trend shows a clear buy, giving a perfect indicators' convergence.
Goal - 0.9388
Safe Stop Loss - 0.9355
About Used Indicators:
The pivot point itself is simply the average of the high, low and closing prices from the previous trading day.
Disclosure: I am part of Trade Nation's Influencer program and receive a monthly fee for using their TradingView charts in my analysis.
———————————
WISH YOU ALL LUCK
EURUSD What Next? SELL!
My dear friends,
My technical analysis for EURUSD is below:
The market is trading on 1.1716 pivot level.
Bias - Bearish
Technical Indicators: Both Super Trend & Pivot HL indicate a highly probable Bearish continuation.
Target - 1.1635
About Used Indicators:
A pivot point is a technical analysis indicator, or calculations, used to determine the overall trend of the market over different time frames.
Disclosure: I am part of Trade Nation's Influencer program and receive a monthly fee for using their TradingView charts in my analysis.
———————————
WISH YOU ALL LUCK

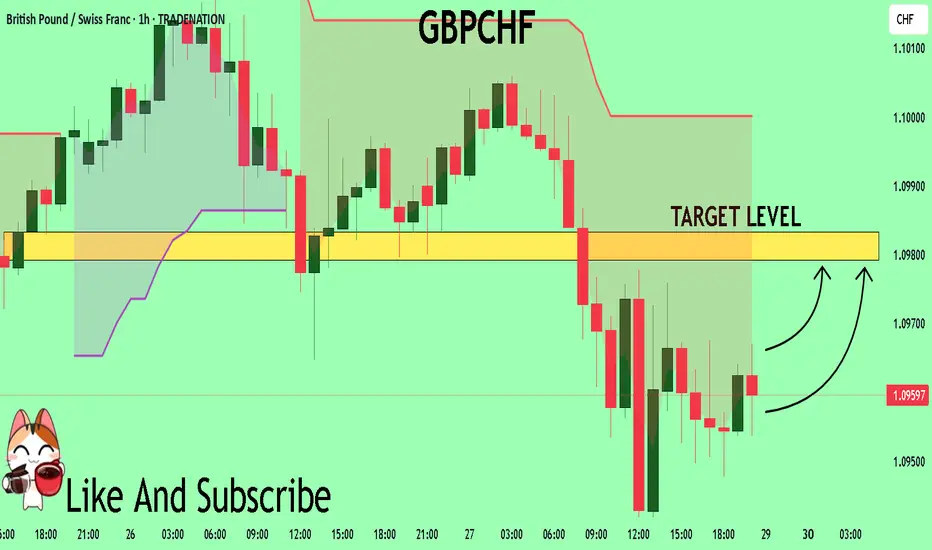
GBPCHF Technical Analysis! BUY!
My dear subscribers,
GBPCHF looks like it will make a good move, and here are the details:
The market is trading on 1.0959 pivot level.
Bias - Bullish
Technical Indicators: Both Super Trend & Pivot HL indicate a highly probable Bullish continuation.
Target - 1.0979
About Used Indicators:
The average true range (ATR) plays an important role in 'Supertrend' as the indicator uses ATR to calculate its value. The ATR indicator signals the degree of price volatility.
Disclosure: I am part of Trade Nation's Influencer program and receive a monthly fee for using their TradingView charts in my analysis.
———————————
WISH YOU ALL LUCK
AUDNZD The Target Is DOWN! SELL!
My dear followers,
I analysed this chart on AUDNZD and concluded the following:
The market is trading on 1.0803 pivot level.
Bias - Bearish
Technical Indicators: Both Super Trend & Pivot HL indicate a highly probable Bearish continuation.
Target - 1.0792
About Used Indicators:
A super-trend indicator is plotted on either above or below the closing price to signal a buy or sell. The indicator changes color, based on whether or not you should be buying. If the super-trend indicator moves below the closing price, the indicator turns green, and it signals an entry point or points to buy.
Disclosure: I am part of Trade Nation's Influencer program and receive a monthly fee for using their TradingView charts in my analysis.
———————————
WISH YOU ALL LUCK

EURUSD Will Collapse! SELL!
My dear subscribers,
My technical analysis for EURUSD is below:
The price is coiling around a solid key level - 1.1716
Bias - Bearish
Technical Indicators: Pivot Points Low anticipates a potential price reversal.
Super trend shows a clear sell, giving a perfect indicators' convergence.
Goal - 1.1644
About Used Indicators:
By the very nature of the supertrend indicator, it offers firm support and resistance levels for traders to enter and exit trades. Additionally, it also provides signals for setting stop losses
Disclosure: I am part of Trade Nation's Influencer program and receive a monthly fee for using their TradingView charts in my analysis.
———————————
WISH YOU ALL LUCK

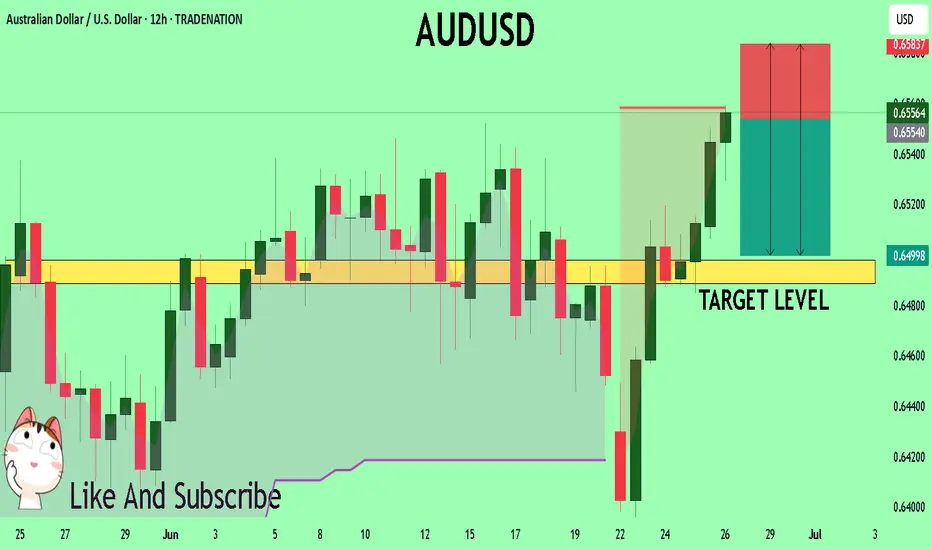
AUDUSD Set To Fall! SELL!
My dear followers,
This is my opinion on the AUDUSD next move:
The asset is approaching an important pivot point 0.6555
Bias - Bearish
Safe Stop Loss - 0.6583
Technical Indicators: Supper Trend generates a clear short signal while Pivot Point HL is currently determining the overall Bearish trend of the market.
Goal - 0.6497
About Used Indicators:
For more efficient signals, super-trend is used in combination with other indicators like Pivot Points.
Disclosure: I am part of Trade Nation's Influencer program and receive a monthly fee for using their TradingView charts in my analysis.
———————————
WISH YOU ALL LUCK
XAUUSD Long Trendline is broken. Mid Term Swing TradeXAUUSD, Long term trendline is now broken. Price should come up to that level to continue it's downward move.
* It's entirely my prediction with some logical reason but I will request everyone to see this as a reference, Thank you

EURNZD: Bearish Continuation & Short Trade
EURNZD
- Classic bearish formation
- Our team expects pullback
SUGGESTED TRADE:
Swing Trade
Short EURNZD
Entry - 1.9350
Sl - 1.9422
Tp - 1.9206
Our Risk - 1%
Start protection of your profits from lower levels
Disclosure: I am part of Trade Nation's Influencer program and receive a monthly fee for using their TradingView charts in my analysis.
❤️ Please, support our work with like & comment! ❤️
