USDCHF: Bullish Continuation & Long Trade
USDCHF
- Classic bullish formation
- Our team expects growth
SUGGESTED TRADE:
Swing Trade
Buy USDCHF
Entry Level - 0.8046
Sl - 0.8013
Tp - 0.8118
Our Risk - 1%
Start protection of your profits from lower levels
Disclosure: I am part of Trade Nation's Influencer program and receive a monthly fee for using their TradingView charts in my analysis.
❤️ Please, support our work with like & comment! ❤️
Signal

GBPUSD Technical Analysis! SELL!
My dear friends,
GBPUSD looks like it will make a good move, and here are the details:
The market is trading on 1.3622 pivot level.
Bias - Bearish
Technical Indicators: Supper Trend generates a clear short signal while Pivot Point HL is currently determining the overall Bearish trend of the market.
Goal - 1.3558
Recommended Stop Loss - 1.3653
About Used Indicators:
Pivot points are a great way to identify areas of support and resistance, but they work best when combined with other kinds of technical analysis
Disclosure: I am part of Trade Nation's Influencer program and receive a monthly fee for using their TradingView charts in my analysis.
———————————
WISH YOU ALL LUCK

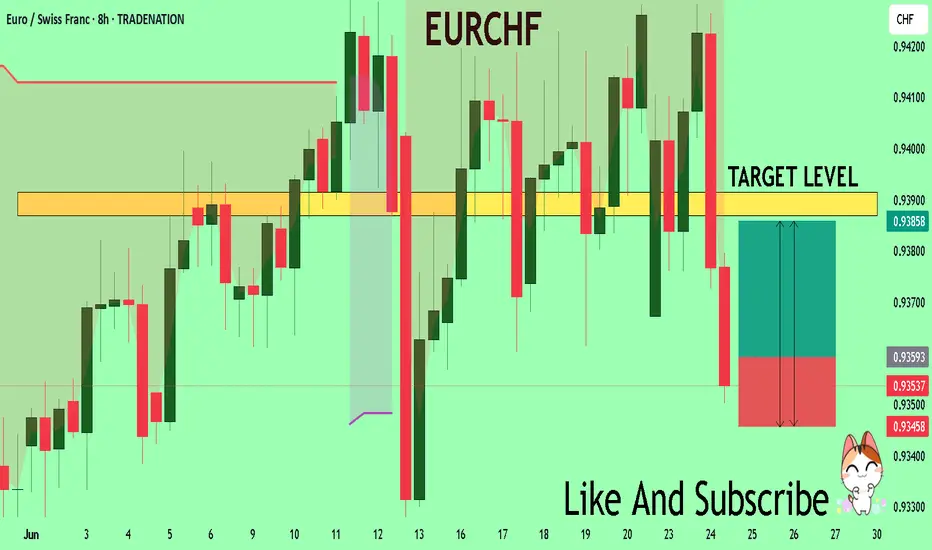
EURCHF Set To Grow! BUY!
My dear subscribers,
This is my opinion on the EURCHF next move:
The instrument tests an important psychological level 0.9359
Bias - Bullish
Technical Indicators: Supper Trend gives a precise Bullish signal, while Pivot Point HL predicts price changes and potential reversals in the market.
Target - 0.9386
My Stop Loss - 0.9345
About Used Indicators:
On the subsequent day, trading above the pivot point is thought to indicate ongoing bullish sentiment, while trading below the pivot point indicates bearish sentiment.
Disclosure: I am part of Trade Nation's Influencer program and receive a monthly fee for using their TradingView charts in my analysis.
———————————
WISH YOU ALL LUCK
GOLD: Long Signal Explained
GOLD
- Classic bullish formation
- Our team expects pullback
SUGGESTED TRADE:
Swing Trade
Long GOLD
Entry - 3306.4
Sl - 3294.6
Tp - 3332.6
Our Risk - 1%
Start protection of your profits from lower levels
Disclosure: I am part of Trade Nation's Influencer program and receive a monthly fee for using their TradingView charts in my analysis.
❤️ Please, support our work with like & comment! ❤️

EURUSD A Fall Expected! SELL!
My dear friends,
Please, find my technical outlook for EURUSD below:
The price is coiling around a solid key level - 1.1609
Bias - Bearish
Technical Indicators: Pivot Points Low anticipates a potential price reversal.
Super trend shows a clear sell, giving a perfect indicators' convergence.
Goal - 1.1532
About Used Indicators:
The pivot point itself is simply the average of the high, low and closing prices from the previous trading day.
Disclosure: I am part of Trade Nation's Influencer program and receive a monthly fee for using their TradingView charts in my analysis.
———————————
WISH YOU ALL LUCK

GBPUSD - Over-Bought!Hello TradingView Family / Fellow Traders. This is Richard, also known as theSignalyst.
📈GBPUSD has been hovering within a big range marked in red and blue.
This week, GBPUSD is retesting the upper bound of the range acting as a resistance.
As long as the resistance holds, we will be looking for shorts on lower timeframes, targeting the lower bound of the range.
📚 Always follow your trading plan regarding entry, risk management, and trade management.
Good luck!
All Strategies Are Good; If Managed Properly!
~Rich
Disclosure: I am part of Trade Nation's Influencer program and receive a monthly fee for using their TradingView charts in my analysis.


EURGBP - Bullish No More!Hello TradingView Family / Fellow Traders. This is Richard, also known as theSignalyst.
📈 EURGBP has been overall bullish trading within the rising channel marked in blue. And it is currently retesting the upper bound of the channel.
Moreover, the orange zone is a strong weekly resistance.
🏹 Thus, the highlighted red circle is a strong area to look for sell setups as it is the intersection of the upper blue trendline and resistance.
📚 As per my trading style:
As #EURGBP is around the red circle zone, I will be looking for bearish reversal setups (like a double top pattern, trendline break , and so on...)
📚 Always follow your trading plan regarding entry, risk management, and trade management.
Good luck!
All Strategies Are Good; If Managed Properly!
~Rich
Disclosure: I am part of Trade Nation's Influencer program and receive a monthly fee for using their TradingView charts in my analysis.

EURUSD - Shifting from Bearish to Bullish Soon!Hello TradingView Family / Fellow Traders. This is Richard, also known as theSignalyst.
📈EURUSD has been overall bullish trading within the rising wedge marked in blue.
Moreover, the orange zone is a strong support!
🏹 Thus, the highlighted blue circle is a strong area to look for buy setups as it is the intersection of support and lower blue trendline acting as a non-horizontal support.
📚 As per my trading style:
As #EURUSD approaches the blue circle zone, I will be looking for bullish reversal setups (like a double bottom pattern, trendline break , and so on...)
📚 Always follow your trading plan regarding entry, risk management, and trade management.
Good luck!
All Strategies Are Good; If Managed Properly!
~Rich
Disclosure: I am part of Trade Nation's Influencer program and receive a monthly fee for using their TradingView charts in my analysis.

TONUSDT: Short the Rejection,Buy the Capitulation – A Dual-Level
📉 TONUSDT Technical Analysis – Trending in a Long-Term Descending Channel, Is the Ideal Short Entry Coming?
TONUSDT is currently trading inside a long-term descending channel, with clear bearish momentum dominating the structure.
🔻 Scenario 1 (Early & Risky Entry):
Traders may consider opening a short position from the current level, but this setup carries higher risk, as the price could still push upward toward the upper boundary of the channel.
Stop-loss level is clearly marked on the chart.
🧭 Scenario 2 (Smarter, Low-Risk Entry):
A more calculated approach is to wait for the price to revisit the upper resistance zone of the descending channel (marked as Entry 1 on the chart).
This zone offers a clean low-risk, high-reward short opportunity, with a tight stop-loss and excellent setup.
🎯 Defined Targets in This Analysis:
Target 1: The midline of the descending channel
Target 2: The bottom of the long-term descending channel
💎 Important Insight:
If this bearish scenario completes and the price reaches the bottom of the descending channel, that zone could be a prime buying opportunity for long-term holders.
Technically, it's a major support level and psychologically, it's where smart money often steps in.
⚠️ Disclaimer:
This is not financial advice. This analysis is for educational purposes only. Always wait for confirmation and apply strict risk management when trading.
📩 What’s your opinion on this setup? Do you agree with the short plan, or see another scenario unfolding? 👇

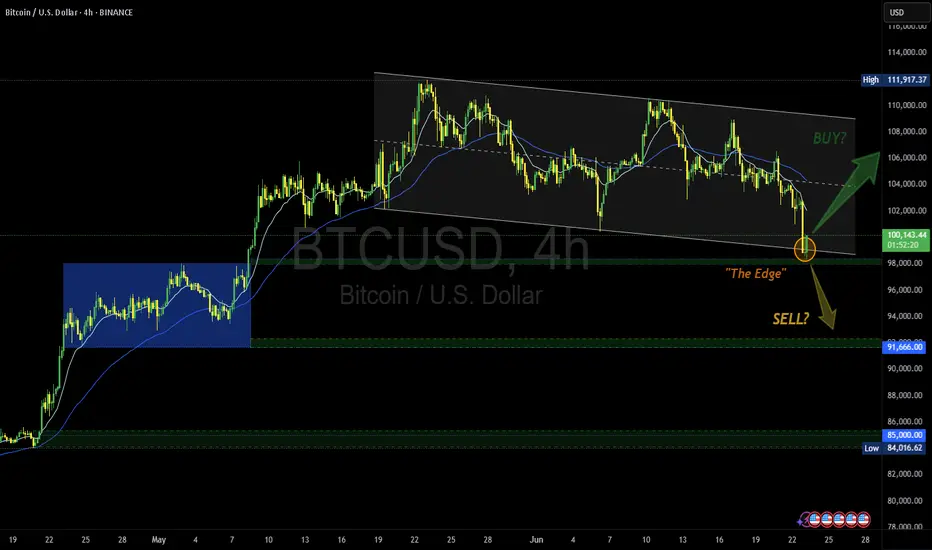
Another Edge - Decision time | Buy? or Sell? share your opinionTitle: BTCUSD: At The Edge – Decision Time Looms
Idea: Bitcoin is currently flirting with "The Edge"—a key decision zone near $98,000 where trend dynamics could shift sharply. After touching the lower boundary of a descending channel, BTC is testing support that could mark either a springboard for a bullish reversal or a trapdoor for further downside.
If bulls reclaim territory above the descending resistance line and push toward $104,000, we may see a trend breakout and renewed upside momentum. Confirmation with volume would strengthen the case for a long position, targeting the $111,917 level.
However, failure to hold "The Edge" could open the door to a swift move lower toward the $91,666 then $85,000 support zone, especially if accompanied by broader risk-off sentiment.
Trade Plan:
• Long above $100K with confirmation and strong volume;
target $111,917.
Stop below $97K.
• Short on breakdown below $97K with bearish momentum;
target $91,666.
Stop above $100K.
Watching: Volume spikes, macro news, and behavior around the channel boundaries.
🚀 Will Bitcoin bounce off the edge—or fall into the abyss?
#MJTrading #BTC #Bitcoin #Buy #long #chart #signal #forex
AUDCAD: Long Signal with Entry/SL/TP
AUDCAD
- Classic bullish pattern
- Our team expects retracement
SUGGESTED TRADE:
Swing Trade
Buy AUDCAD
Entry - 0.8836
Stop -0.8817
Take - 0.8871
Our Risk - 1%
Start protection of your profits from lower levels
Disclosure: I am part of Trade Nation's Influencer program and receive a monthly fee for using their TradingView charts in my analysis.
❤️ Please, support our work with like & comment! ❤️

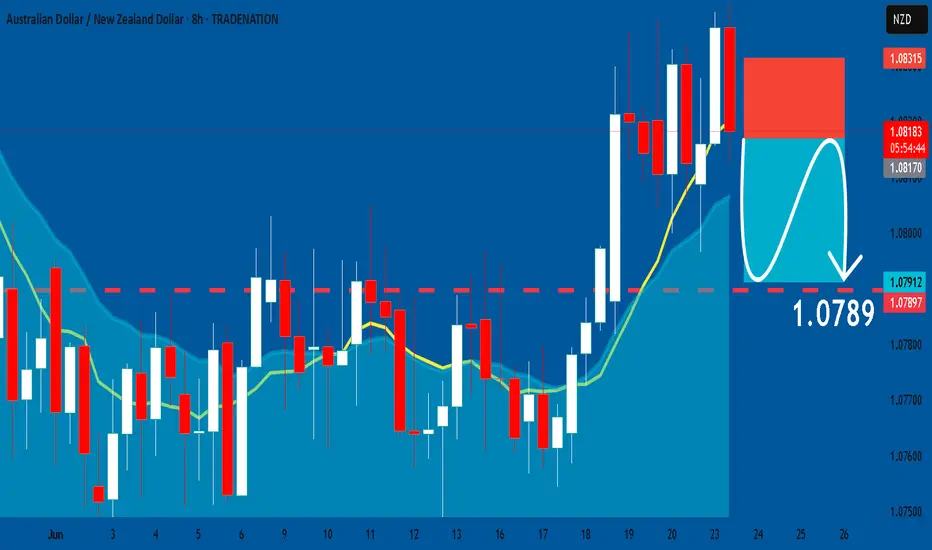
AUDNZD: Short Trading Opportunity
AUDNZD
- Classic bearish formation
- Our team expects pullback
SUGGESTED TRADE:
Swing Trade
Short AUDNZD
Entry - 1.0817
Sl - 1.0831
Tp - 1.0789
Our Risk - 1%
Start protection of your profits from lower levels
Disclosure: I am part of Trade Nation's Influencer program and receive a monthly fee for using their TradingView charts in my analysis.
❤️ Please, support our work with like & comment! ❤️
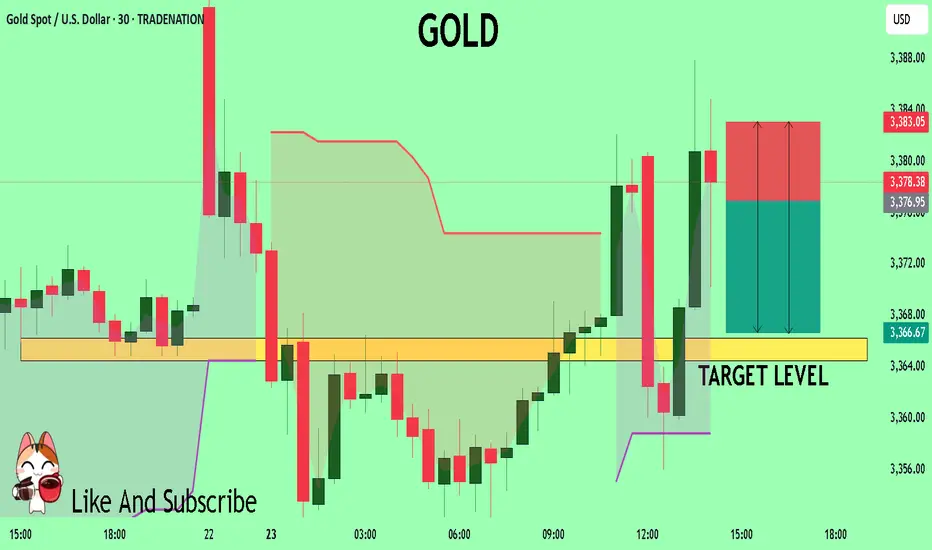
GOLD What Next? SELL!
My dear friends,
My technical analysis for GOLD is below:
The market is trading on 3376.9 pivot level.
Bias - Bearish
Technical Indicators: Both Super Trend & Pivot HL indicate a highly probable Bearish continuation.
Target - 3366.2
Recommended Stop Loss - 3383.0
About Used Indicators:
A pivot point is a technical analysis indicator, or calculations, used to determine the overall trend of the market over different time frames.
Disclosure: I am part of Trade Nation's Influencer program and receive a monthly fee for using their TradingView charts in my analysis.
———————————
WISH YOU ALL LUCK
Breakout from Demand Zone🟡 XAU/USD – 2H Chart Analysis
Title: “Compression Breakout From Demand Zone – Room to Revisit Highs”
Bias: Bullish (Momentum Confirmation)
Timeframe: 2H
Chart Reference: MJTrading – June 23, 2025
📍 Context & Structure:
Gold has just broken out of a multi-candle compression range after tapping into a well-defined demand zone between $3,333 – $3,346. This area acted as the launchpad for previous rallies and is now showing fresh signs of accumulation.
Two EMAs (15 & 60) are attempting a bullish crossover, supporting a shift in momentum.
📈 Trade Setup (Long Bias):
Entry: ✅ Market or retest at $3,366
Stop Loss: 🔴 Below the recent demand base at $3,330
Target 1: 🟢 $3,415 (local swing high)
Target 2: 🟢 $3,460–$3,480 (upper major supply / range top)
R/R Ratio: 🔁 ~2
🔍 Why It Matters:
✅ Price defended key demand zone
✅ Strong engulfing candle with decent volume signals a reversal
⚖️ MJTrading Note:
“Gold thrives on uncertainty — and this bounce from a high-confluence demand zone could be the beginning of a push back toward the highs, especially if macro data shifts in favor.”
#MJTrading #Gold #XAUUSD #Forex #chart #signal #buy #long

Gold Slumps Sharply – Has the Rate-Cut Hope Faded?Gold prices are under intense selling pressure after the Bank of England, the Swiss National Bank, and the Federal Reserve all decided to keep interest rates elevated. This unified stance underscores persistent inflation concerns, driving up the opportunity cost of holding non-yielding assets like gold. As a result, investors rushed to take profits, sending XAUUSD down over 200 pips in just one session.
Adding fuel to the fire, the Fed’s latest monetary policy report to Congress warned that inflation could rise to 3% by year-end, higher than previous projections. Moreover, the Fed trimmed expectations for rate cuts in 2025 and beyond, signaling a longer road to policy easing.
🔎 What does this mean for gold's short-term outlook?
With high rates here to stay and the Fed's cautious stance, gold remains vulnerable to further downside in the near term. However, if upcoming U.S. economic data shows signs of significant weakness, gold may regain favor as a safe-haven asset.
At the time of writing, XAUUSD is trading around $3,347, a critical zone that may determine whether the current drop continues or finds a bottom.
Do you believe this dip will deepen—or is it a golden opportunity to buy the pullback? Share your thoughts below!
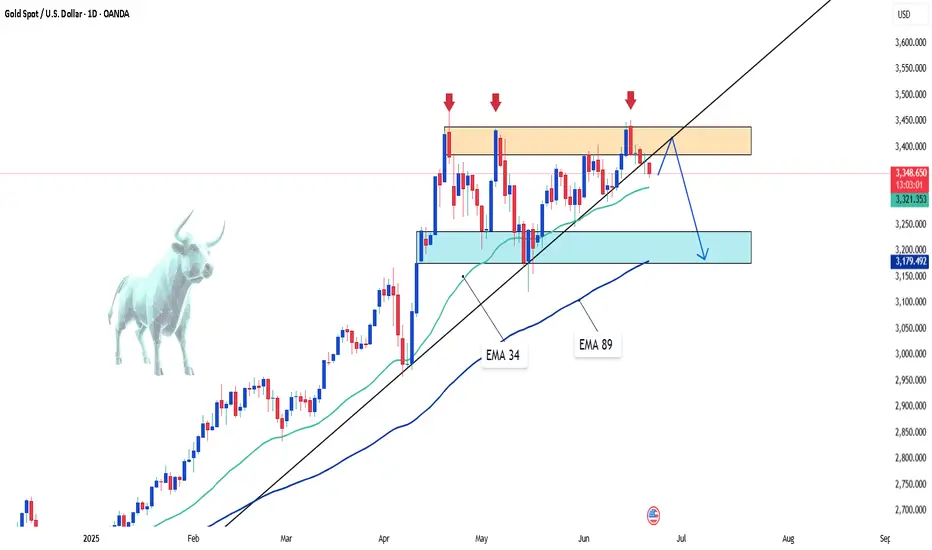
"XAUUSD – Hidden Strength Within the Accumulation Zone"Hello everyone, how are you currently evaluating XAUUSD?
Yesterday, gold remained relatively stable without major volatility, yet continued to be supported by a favorable macro environment. Escalating tensions between Israel and Iran have sustained safe-haven demand. While the U.S. has yet to make a direct military move, President Trump’s emergency meeting and firm stance have increased market caution, which in turn boosted interest in gold.
At the time of writing, gold is trading around $3,368, and the long-term trend still favors the bulls. But why do I say that?
From both a technical and macro perspective, gold is in a healthy accumulation phase. Although it hasn’t broken above the record high, XAUUSD remains safely above key support zones — especially above the EMA 34 — which continues to affirm its bullish structure.
EMA 34 remains a strong dynamic support, with a clear separation from EMA 89, reinforcing the momentum. Even if we see short-term pullbacks in the next few sessions, they are more likely technical retests rather than signs of reversal.
Adding to that, the rising trendline, higher support levels, and bullish candlestick patterns all strengthen the case for continued upward movement. These combined factors paint a positive technical outlook for gold in the medium to long term.
From my perspective, I remain confident in gold’s long-term uptrend. What about you? Feel free to share your thoughts!

GBPUSD: Bullish Continuation & Long Signal
GBPUSD
- Classic bullish setup
- Our team expects bullish continuation
SUGGESTED TRADE:
Swing Trade
Long GBPUSD
Entry Point - 1.3449
Stop Loss - 1.3413
Take Profit - 1.3520
Our Risk - 1%
Start protection of your profits from lower levels
Disclosure: I am part of Trade Nation's Influencer program and receive a monthly fee for using their TradingView charts in my analysis.
❤️ Please, support our work with like & comment! ❤️

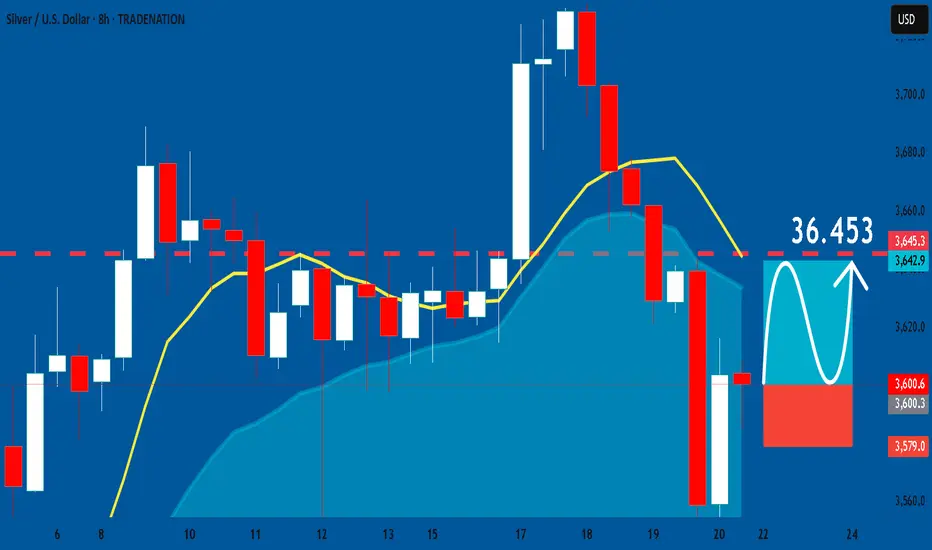
SILVER: Long Trading Opportunity
SILVER
- Classic bullish formation
- Our team expects growth
SUGGESTED TRADE:
Swing Trade
Buy SILVER
Entry Level -36.006
Sl - 35.790
Tp - 36.453
Our Risk - 1%
Start protection of your profits from lower levels
Disclosure: I am part of Trade Nation's Influencer program and receive a monthly fee for using their TradingView charts in my analysis.
❤️ Please, support our work with like & comment! ❤️
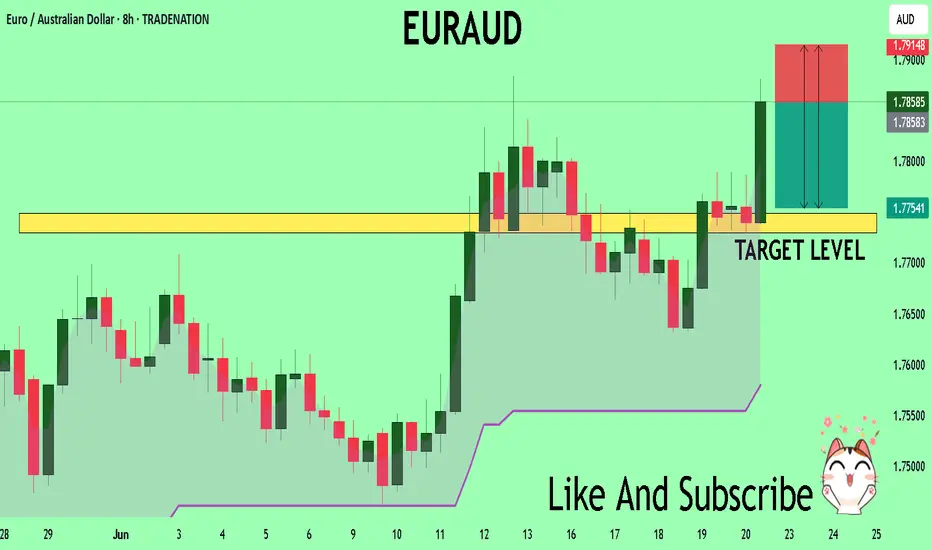
EURAUD My Opinion! SELL!
My dear followers,
This is my opinion on the EURAUD next move:
The asset is approaching an important pivot point 1.7858
Bias - Bearish
Safe Stop Loss - 1.7914
Technical Indicators: Supper Trend generates a clear short signal while Pivot Point HL is currently determining the overall Bearish trend of the market.
Goal - 1.7748
About Used Indicators:
For more efficient signals, super-trend is used in combination with other indicators like Pivot Points.
Disclosure: I am part of Trade Nation's Influencer program and receive a monthly fee for using their TradingView charts in my analysis.
———————————
WISH YOU ALL LUCK
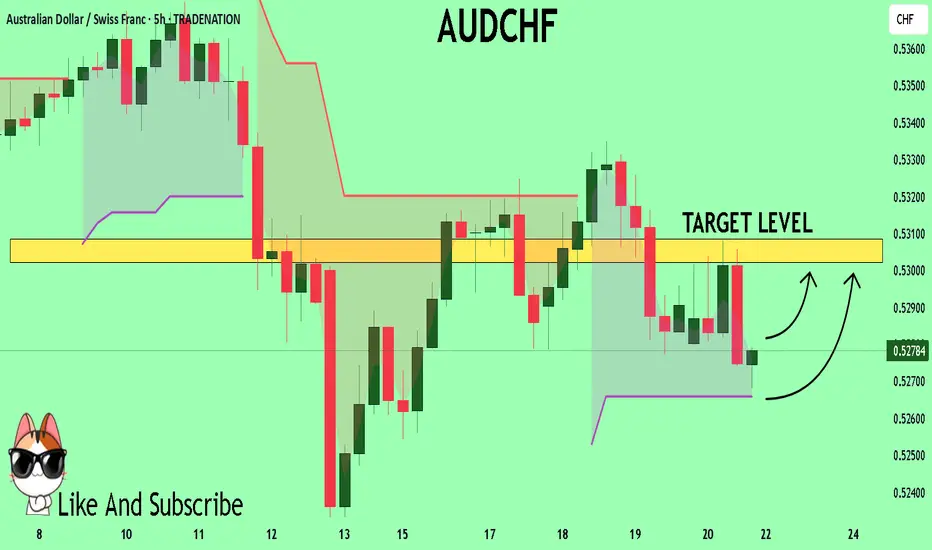
AUDCHF Technical Analysis! BUY!
My dear friends,
Please, find my technical outlook for AUDCHF below:
The instrument tests an important psychological level 0.5278
Bias - Bullish
Technical Indicators: Supper Trend gives a precise Bullish signal, while Pivot Point HL predicts price changes and potential reversals in the market.
Target - 0.5302
About Used Indicators:
Super-trend indicator is more useful in trending markets where there are clear uptrends and downtrends in price.
Disclosure: I am part of Trade Nation's Influencer program and receive a monthly fee for using their TradingView charts in my analysis.
———————————
WISH YOU ALL LUCK
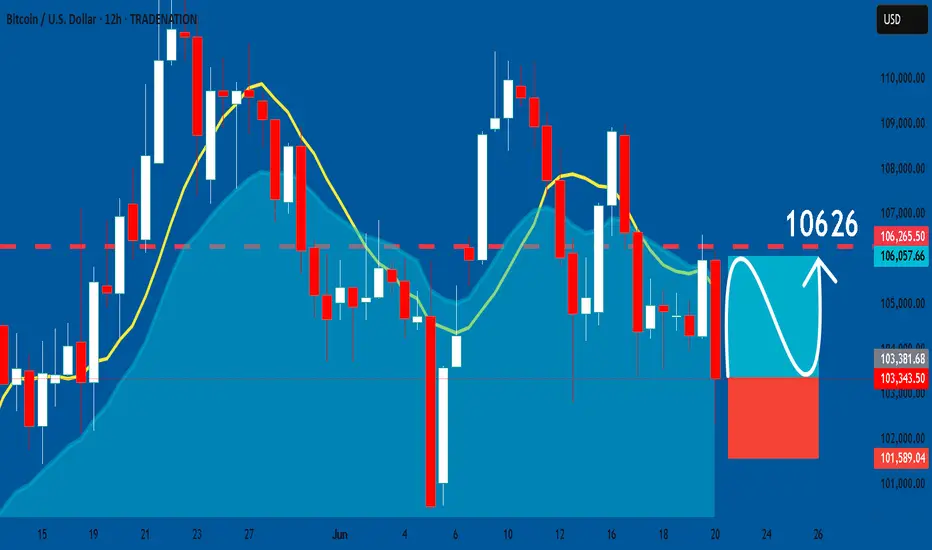
BTCUSD: Trading Signal From Our Team
BTCUSD
- Classic bullish formation
- Our team expects pullback
SUGGESTED TRADE:
Swing Trade
Long BTCUSD
Entry - 10334
Sl - 10158
Tp - 10626
Our Risk - 1%
Start protection of your profits from lower levels
Disclosure: I am part of Trade Nation's Influencer program and receive a monthly fee for using their TradingView charts in my analysis.
❤️ Please, support our work with like & comment! ❤️
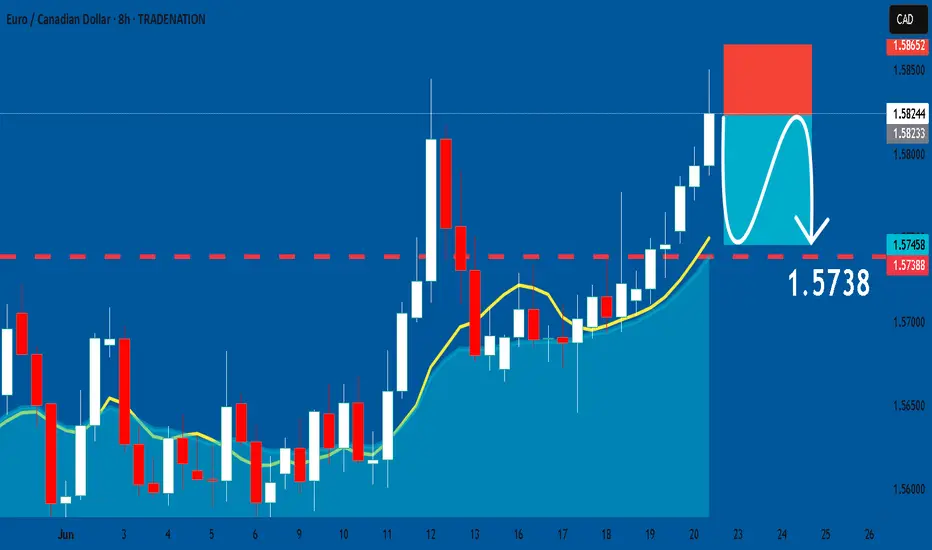
EURCAD: Short Trade Explained
EURCAD
- Classic bearish pattern
- Our team expects retracement
SUGGESTED TRADE:
Swing Trade
Sell EURCAD
Entry - 1.5823
Stop - 1.5865
Take - 1.5738
Our Risk - 1%
Start protection of your profits from lower levels
Disclosure: I am part of Trade Nation's Influencer program and receive a monthly fee for using their TradingView charts in my analysis.
❤️ Please, support our work with like & comment! ❤️