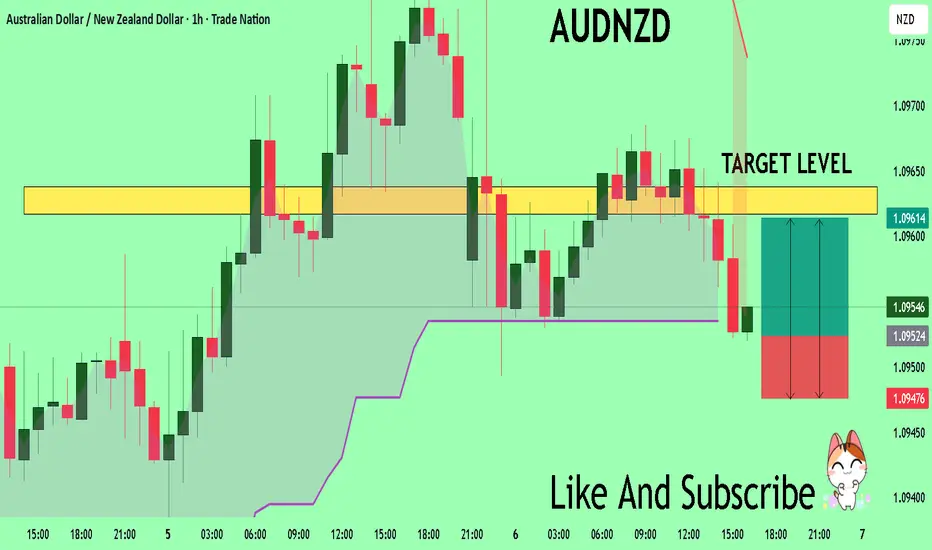
AUDNZD Trading Opportunity! BUY!
My dear subscribers,
This is my opinion on the AUDNZD next move:
The instrument tests an important psychological level 1.0952
Bias - Bullish
Technical Indicators: Supper Trend gives a precise Bullish signal, while Pivot Point HL predicts price changes and potential reversals in the market.
Target - 1.0961
My Stop Loss - 1.0947
About Used Indicators:
On the subsequent day, trading above the pivot point is thought to indicate ongoing bullish sentiment, while trading below the pivot point indicates bearish sentiment.
Disclosure: I am part of Trade Nation's Influencer program and receive a monthly fee for using their TradingView charts in my analysis.
———————————
WISH YOU ALL LUCK
Signal
EURUSD: Bearish Continuation & Short Trade
EURUSD
- Classic bearish formation
- Our team expects pullback
SUGGESTED TRADE:
Swing Trade
Short EURUSD
Entry - 1.1603
Sl - 1.1617
Tp - 1.1575
Our Risk - 1%
Start protection of your profits from lower levels
Disclosure: I am part of Trade Nation's Influencer program and receive a monthly fee for using their TradingView charts in my analysis.
❤️ Please, support our work with like & comment! ❤️

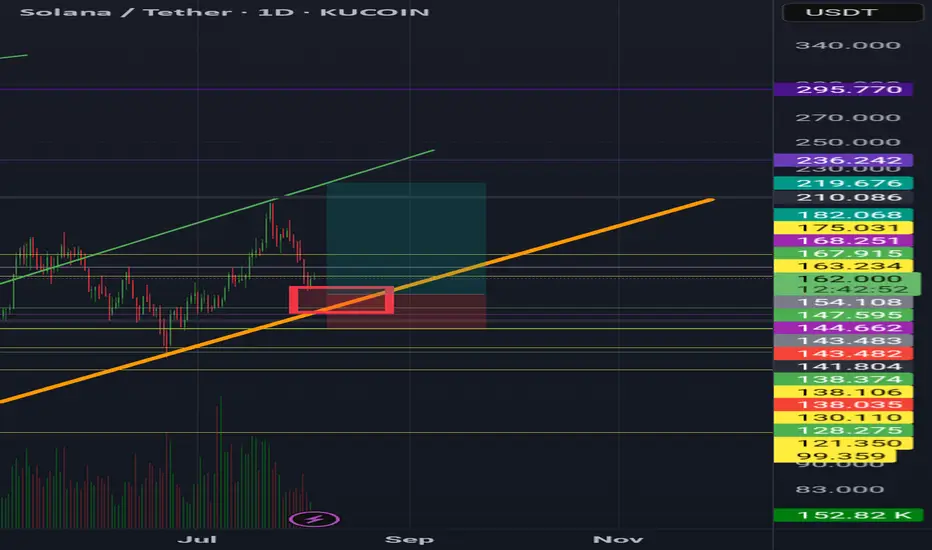
SOLUSDT📊 #SOLUSDT
⏱ TIME: 1D
⭕️risk: mid
📍The initial buying market: 168-169
📌TP1: 192$
📌TP2: 224$
⛔️SL: 144$
❌These analyzes are just to give a better perspective for you dear ones
Do not base on buying and selling❌

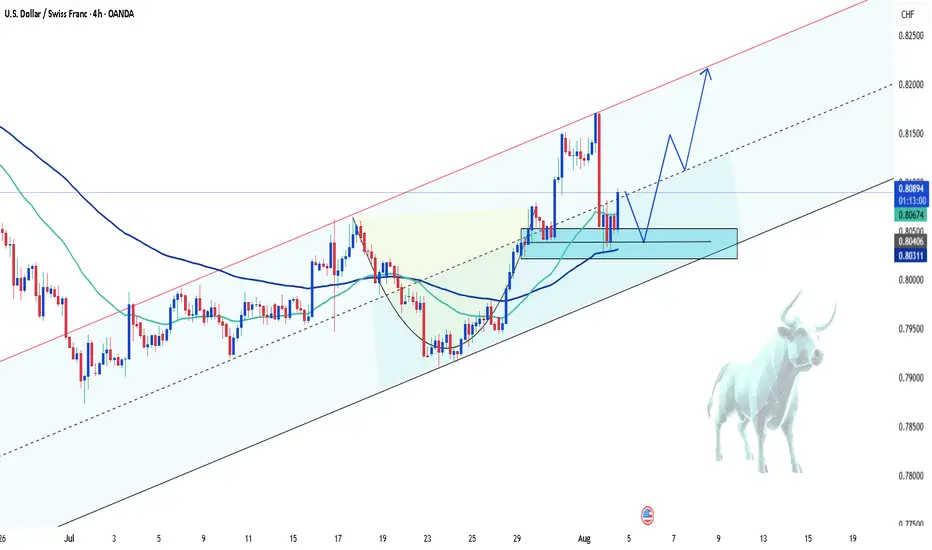
USDCHF – Bullish comeback in progress?Hey everyone! What’s your take on the current trend of USDCHF?
While the pair experienced a recent dip, take a step back and look at the bigger picture — doesn’t it still seem to be moving within an ascending channel?
Right now, USDCHF is hovering around 0.8092 and starting to bounce back. The recovery appears to be supported by a newly formed support zone and the confluence of the EMA 34 and 89. The pair seems to be eyeing the recent high, with potential to climb further toward the upper boundary of the channel.
My current bias? Bullish.
What about you — do you see the same opportunity?
Drop a comment and hit like if you’re on the same page!
GOLD Buyers In Panic! SELL!
My dear friends,
Please, find my technical outlook for GOLD below:
The instrument tests an important psychological level 3309.2
Technical Indicators: Supper Trend gives a precise Bearish signal, while Pivot Point HL predicts price changes and potential reversals in the market.
Target - 3296.9
Recommended Stop Loss - 3316.4
About Used Indicators:
Super-trend indicator is more useful in trending markets where there are clear uptrends and downtrends in price.
Disclosure: I am part of Trade Nation's Influencer program and receive a monthly fee for using their TradingView charts in my analysis.
———————————
WISH YOU ALL LUCK

EURCAD What Next? BUY!
My dear friends,
My technical analysis for EURCAD is below:
The market is trading on 1.5784 pivot level.
Bias - Bullish
Technical Indicators: Both Super Trend & Pivot HL indicate a highly probable Bullish continuation.
Target - 1.5907
About Used Indicators:
A pivot point is a technical analysis indicator, or calculations, used to determine the overall trend of the market over different time frames.
Disclosure: I am part of Trade Nation's Influencer program and receive a monthly fee for using their TradingView charts in my analysis.
———————————
WISH YOU ALL LUCK

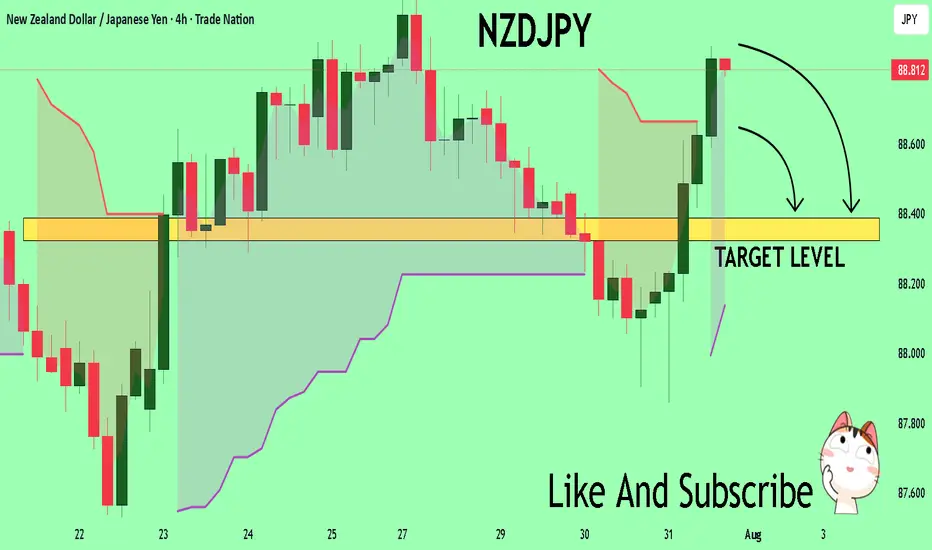
NZDJPY The Target Is DOWN! SELL!
My dear friends,
Please, find my technical outlook for NZDJPY below:
The price is coiling around a solid key level - 88.806
Bias - Bearish
Technical Indicators: Pivot Points Low anticipates a potential price reversal.
Super trend shows a clear sell, giving a perfect indicators' convergence.
Goal - 88.388
About Used Indicators:
The pivot point itself is simply the average of the high, low and closing prices from the previous trading day.
Disclosure: I am part of Trade Nation's Influencer program and receive a monthly fee for using their TradingView charts in my analysis.
———————————
WISH YOU ALL LUCK
GBPCHF: Short Signal with Entry/SL/TP
GBPCHF
- Classic bearish setup
- Our team expects bearish continuation
SUGGESTED TRADE:
Swing Trade
Short GBPCHF
Entry Point - 1.0741
Stop Loss - 1.0754
Take Profit - 1.0714
Our Risk - 1%
Start protection of your profits from lower levels
Disclosure: I am part of Trade Nation's Influencer program and receive a monthly fee for using their TradingView charts in my analysis.
❤️ Please, support our work with like & comment! ❤️

USDJPY My Opinion! BUY!
My dear friends,
My technical analysis for USDJPY is below:
The market is trading on 147.23 pivot level.
Bias - Bullish
Technical Indicators: Both Super Trend & Pivot HL indicate a highly probable Bullish continuation.
Target - 148.77
About Used Indicators:
A pivot point is a technical analysis indicator, or calculations, used to determine the overall trend of the market over different time frames.
Disclosure: I am part of Trade Nation's Influencer program and receive a monthly fee for using their TradingView charts in my analysis.
———————————
WISH YOU ALL LUCK

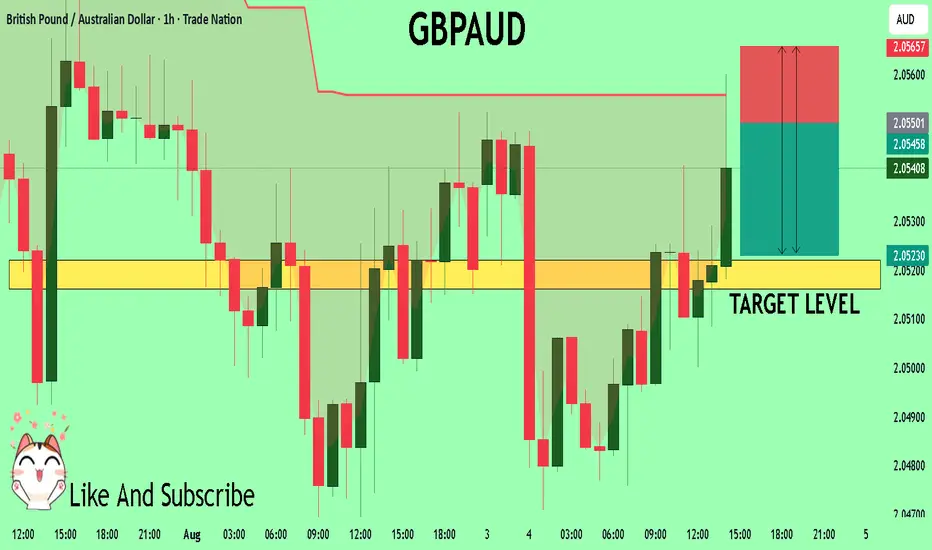
GBPAUD Technical Analysis! SELL!
My dear friends,
Please, find my technical outlook for GBPAUD below:
The instrument tests an important psychological level 2.0550
Bias - Bearish
Technical Indicators: Supper Trend gives a precise Bearish signal, while Pivot Point HL predicts price changes and potential reversals in the market.
Target - 2.0522
Recommended Stop Loss - 2.0565
About Used Indicators:
Super-trend indicator is more useful in trending markets where there are clear uptrends and downtrends in price.
Disclosure: I am part of Trade Nation's Influencer program and receive a monthly fee for using their TradingView charts in my analysis.
———————————
WISH YOU ALL LUCK
GBPUSD – Bearish Bounce Loading?Hello TradingView Family / Fellow Traders. This is Richard, also known as theSignalyst.
📈GBPUSD has been overall bearish trading within the falling channel marked in red and it is currently in a correction phase.
Moreover, the blue zone is a strong supply.
📚 As per my trading style:
As #GBPUSD approaches the red circle zone, I will be looking for bearish reversal setups (like a double top pattern, trendline break , and so on...)
📚 Always follow your trading plan regarding entry, risk management, and trade management.
Good luck!
All Strategies Are Good; If Managed Properly!
~Rich
Disclosure: I am part of Trade Nation's Influencer program and receive a monthly fee for using their TradingView charts in my analysis.

SolanaZol usdt daily analysis
Time frame daily
Position long
Target 219$
Risk rewards ratio >4 👌👈
Red box on the cart is the good erea to entrance long position
Orange uptrend line is a very strong support lines
I guess in this turn of upcoming, solana will reach my target
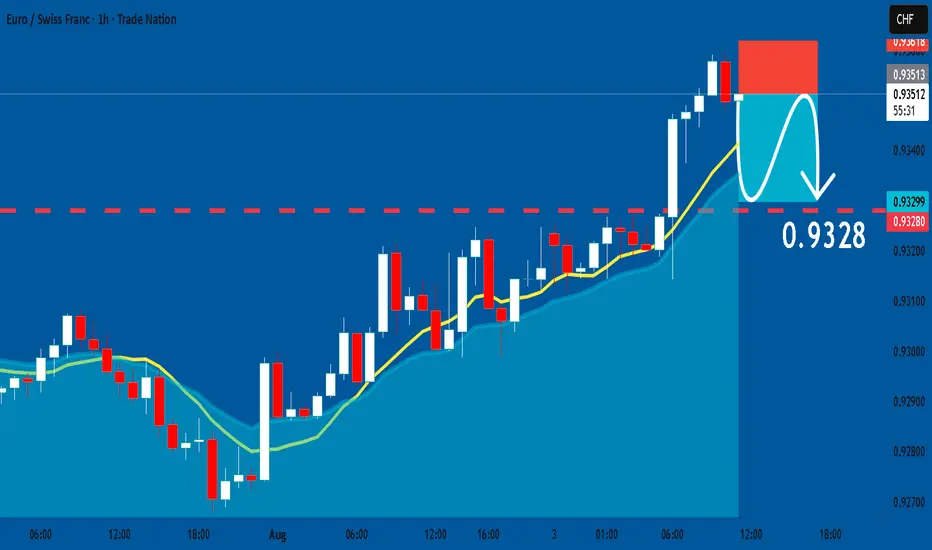
EURCHF: Short Signal Explained
EURCHF
- Classic bearish formation
- Our team expects fall
SUGGESTED TRADE:
Swing Trade
Sell EURCHF
Entry Level - 0.9350
Sl - 0.9361
Tp - 0.9328
Our Risk - 1%
Start protection of your profits from lower levels
Disclosure: I am part of Trade Nation's Influencer program and receive a monthly fee for using their TradingView charts in my analysis.
❤️ Please, support our work with like & comment! ❤️
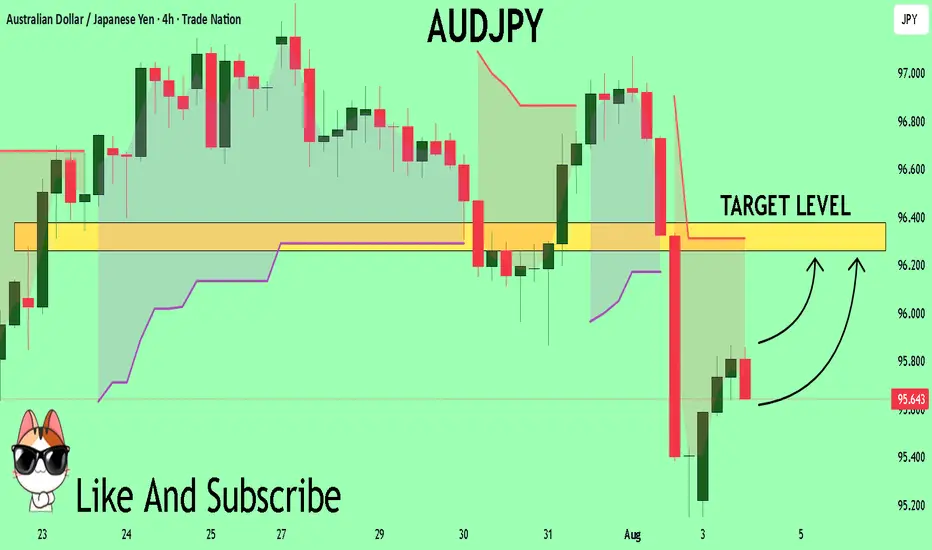
AUDJPY Set To Grow! BUY!
My dear subscribers,
AUDJPY looks like it will make a good move, and here are the details:
The market is trading on 95.649 pivot level.
Bias - Bullish
Technical Indicators: Both Super Trend & Pivot HL indicate a highly probable Bullish continuation.
Target - 96.260
About Used Indicators:
The average true range (ATR) plays an important role in 'Supertrend' as the indicator uses ATR to calculate its value. The ATR indicator signals the degree of price volatility.
Disclosure: I am part of Trade Nation's Influencer program and receive a monthly fee for using their TradingView charts in my analysis.
———————————
WISH YOU ALL LUCK
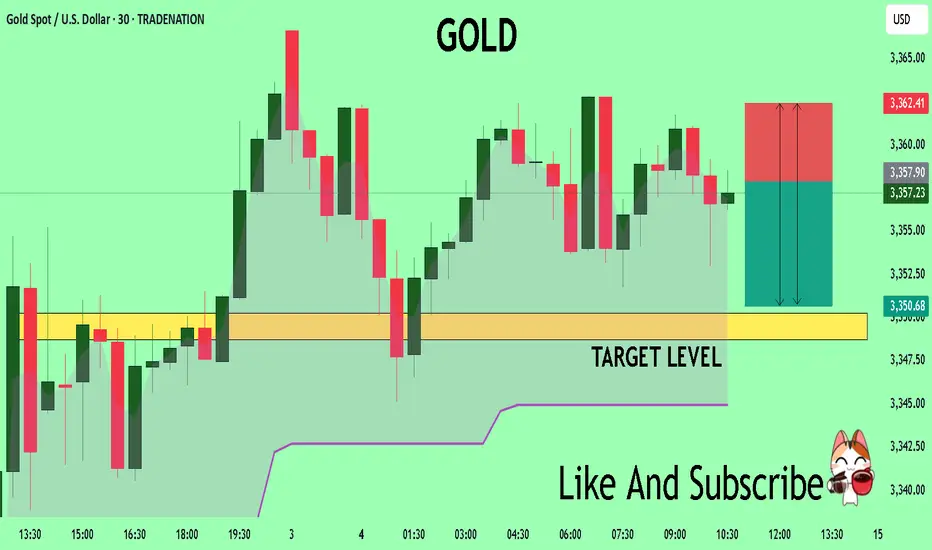
GOLD A Fall Expected! SELL!
My dear subscribers,
My technical analysis for GOLD is below:
The price is coiling around a solid key level - 3358.0
Bias - Bearish
Technical Indicators: Pivot Points Low anticipates a potential price reversal.
Super trend shows a clear sell, giving a perfect indicators' convergence.
Goal - 3350.7
My Stop Loss - 3362.4
About Used Indicators:
By the very nature of the supertrend indicator, it offers firm support and resistance levels for traders to enter and exit trades. Additionally, it also provides signals for setting stop losses
Disclosure: I am part of Trade Nation's Influencer program and receive a monthly fee for using their TradingView charts in my analysis.
———————————
WISH YOU ALL LUCK
Latest Gold Price Update TodayHey everyone! Let’s take a closer look at what’s happening with gold today.
Over the past week, the global gold market experienced dramatic swings. Prices tumbled following cautious remarks from Federal Reserve Chair Jerome Powell, only to rebound sharply after disappointing U.S. employment data.
On Wednesday, the Fed held interest rates steady, and Powell stated, “We haven’t made any decisions for September.” Though brief, that statement hinted that a rate cut isn’t guaranteed — dashing investor hopes and sending gold to its lowest level in four weeks.
But by Friday, the narrative flipped. A weaker-than-expected jobs report triggered a powerful rally. Within just two minutes of the data release, gold surged by $30, closing the week at $3,361 — a gain of over 2% in a single day.
These moves highlight just how sensitive gold is to Fed signals. A slight shift in tone or a single data point can spark major volatility.
From a technical perspective, falling U.S. Treasury yields have allowed XAU/USD to regain bullish momentum, as the market reassesses Fed rate expectations after the weak NFP print. If gold successfully breaks out of its current channel after a short-term pullback, the next target could be $3,400 — or even higher.
Do you agree with this outlook? Share your thoughts in the comments.
Good luck and happy trading!
EURUSD consider on support and resistance zone togetherEURUSD now on resistance area i expect the price will break and form head and shoulder
on the other hand, may this area is strong and the price make down trend ,but we should wait candle pattern on this area to take sell
you must wait price action to take good trade with risk to reward 1:3
good luck
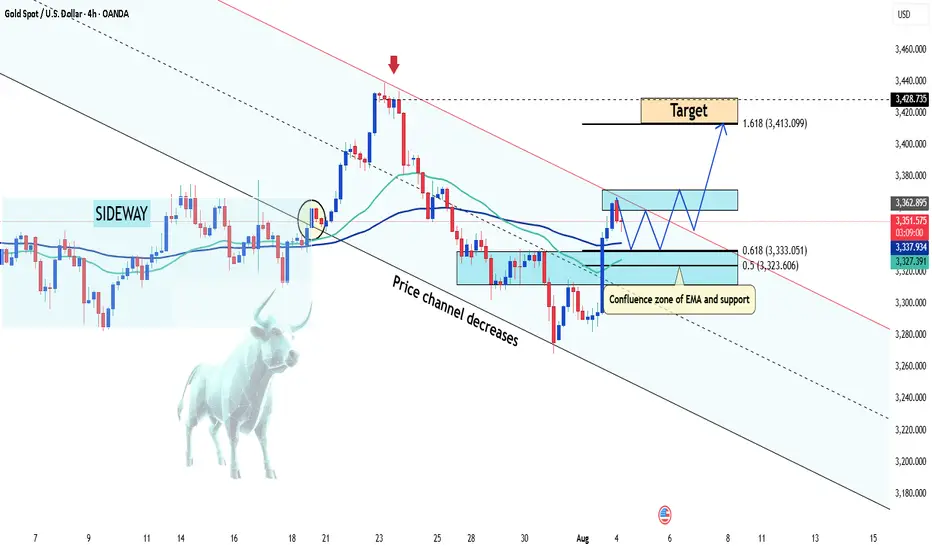
Gold suddenly increased sharply Hey everyone, let’s dive into what’s happening with XAUUSD!
Gold is experiencing a remarkable rally this weekend, skyrocketing from the $3,285 zone to around $3,362 — gaining over 700 pips. This sharp move comes amid weakening U.S. labor market data, which has fueled speculation that the Federal Reserve may begin cutting interest rates as early as September.
According to the U.S. Bureau of Labor Statistics (August 1st), non-farm payrolls rose by just 73,000 jobs in July — well below economists’ expectations of 106,000. The disappointing figures have shaken confidence in the U.S. economy and placed pressure on the U.S. dollar, as markets increasingly anticipate a dovish shift from the Fed.
For gold, this weak jobs report reinforces its role as a safe-haven asset, driving strong demand as investors seek protection from economic uncertainty. At the same time, lingering fears around global trade tensions and new tariffs imposed by President Donald Trump continue to support the flight to safety.
From a technical perspective, gold has broken out of its descending price channel and is moving fast. According to Dow Theory, a short-term correction may occur soon, but if price holds above key support levels, the rally could extend toward the $3,432 region — the 1.618 Fibonacci extension zone.
This move might mark the beginning of a new bullish phase after weeks of consolidation.
What do you think — is gold just getting started?
XAUUSD – Bullish Reversal or Just a Deep Correction?Last week was a wild one for Gold.
After a quiet start and some choppy price action, the market dropped hard on Wednesday, breaking not only the 3300 key level but also the 3280 horizontal support — and what followed was anything but calm.
As expected after a strong move, the price pulled back to retest the broken support.
But Friday changed everything.
Instead of continuing down, Gold reversed sharply, fueled by weaker-than-expected NFP data. Price surged 800 pips from low to high, breaking above both the 3310 resistance zone and the weekly high around 3335.
________________________________________
🧭 Key Question:
Are we back in the bullish trend, or is this just a strong correction of the 3440 → 3270 drop?
Since May, Gold has lacked a clear trend — so a step-by-step trading approach is the most advisable to adopt.
________________________________________
🔍 Outlook:
Given the strength of the reversal and the break above two important resistance levels, my bias is bullish.
• 📌 Support: 3335 — a pullback into this zone could offer a buy opportunity in line with the recent momentum.
• 📌 Resistance: 3375 is the next key level to watch.
• ❌ Invalidation: A drop below 3310 would cancel the current bullish scenario.
🧠 Final Thoughts
Gold’s recent move challenges both bulls and bears.
Yes, the bounce was strong. Yes, key resistance levels broke.
But with no clear trend since May, chasing long term direction can be risky.
That’s why a step-by-step approach is the most advisable to adopt — let the market confirm each move before committing to the next.
For now, the breakout above 3310 and 3335 leans the bias to the upside.
However, staying reactive — not being stuck with an idea — is the smartest approach.
Disclosure: I am part of TradeNation's Influencer program and receive a monthly fee for using their TradingView charts in my analyses and educational articles.

BTCUSD – bullish momentum is backBitcoin is making a strong comeback, breaking above short-term resistance and reestablishing its uptrend after a prolonged consolidation phase. The technical structure now shows clear control from the bulls, with higher highs and higher lows beginning to form.
Positive risk sentiment and growing expectations of capital flowing back into the crypto space—especially after a series of weak U.S. economic data—are fueling the current BTCUSD rally. If momentum holds, the next target could be the upper boundary of the price channel.
Keep an eye on how price reacts at key levels and trendlines — this might be the launchpad for the next bullish leg.
Good luck, and if you enjoyed this analysis, don’t forget to hit like and drop a comment!

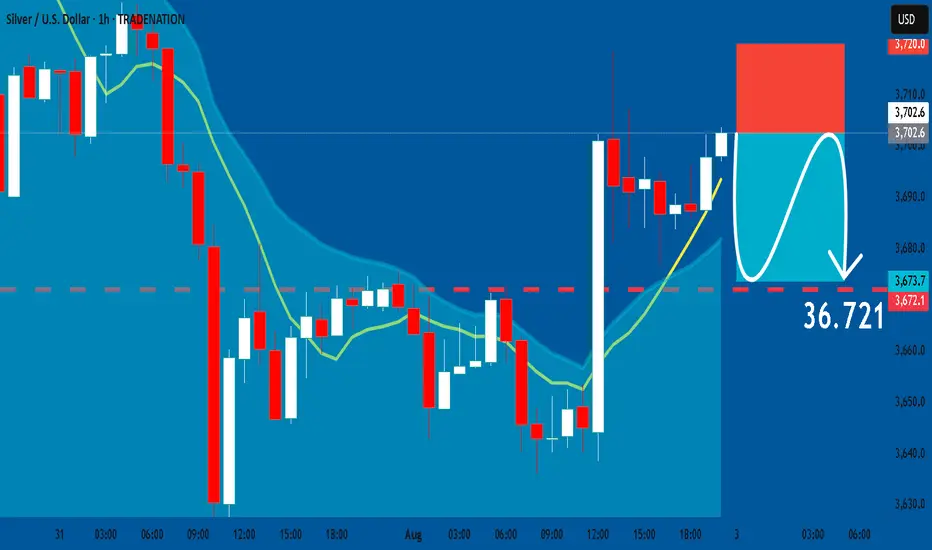
SILVER: Short Trade with Entry/SL/TP
SILVER
- Classic bearish formation
- Our team expects pullback
SUGGESTED TRADE:
Swing Trade
Short SILVER
Entry - 37.026
Sl - 37.200
Tp - 36.721
Our Risk - 1%
Start protection of your profits from lower levels
Disclosure: I am part of Trade Nation's Influencer program and receive a monthly fee for using their TradingView charts in my analysis.
❤️ Please, support our work with like & comment! ❤️
EURUSD Trading Opportunity! SELL!
My dear followers,
This is my opinion on the EURUSD next move:
The asset is approaching an important pivot point 1.1585
Bias - Bearish
Technical Indicators: Supper Trend generates a clear short signal while Pivot Point HL is currently determining the overall Bearish trend of the market.
Goal - 1.1497
About Used Indicators:
For more efficient signals, super-trend is used in combination with other indicators like Pivot Points.
Disclosure: I am part of Trade Nation's Influencer program and receive a monthly fee for using their TradingView charts in my analysis.
———————————
WISH YOU ALL LUCK

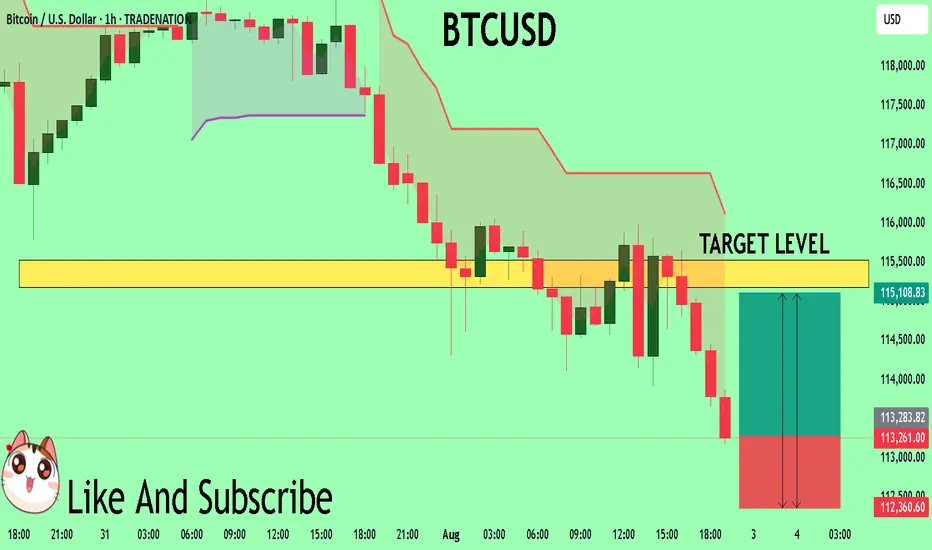
BTCUSD Will Explode! BUY!
My dear followers,
I analysed this chart on BTCUSD and concluded the following:
The market is trading on 11326 pivot level.
Bias - Bullish
Technical Indicators: Both Super Trend & Pivot HL indicate a highly probable Bullish continuation.
Target - 11517
Safe Stop Loss - 11236
About Used Indicators:
A super-trend indicator is plotted on either above or below the closing price to signal a buy or sell. The indicator changes color, based on whether or not you should be buying. If the super-trend indicator moves below the closing price, the indicator turns green, and it signals an entry point or points to buy.
Disclosure: I am part of Trade Nation's Influencer program and receive a monthly fee for using their TradingView charts in my analysis.
———————————
WISH YOU ALL LUCK