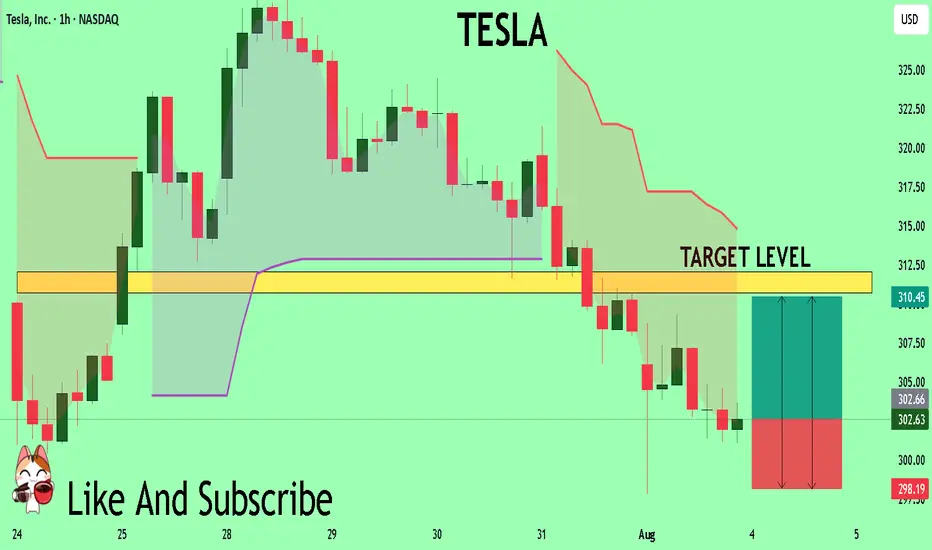
TESLA Sellers In Panic! BUY!
My dear friends,
TESLA looks like it will make a good move, and here are the details:
The market is trading on 302.63 pivot level.
Bias - Bullish
Technical Indicators: Supper Trend generates a clear long signal while Pivot Point HL is currently determining the overall Bullish trend of the market.
Goal - 310.73
Recommended Stop Loss - 298.19
About Used Indicators:
Pivot points are a great way to identify areas of support and resistance, but they work best when combined with other kinds of technical analysis
Disclosure: I am part of Trade Nation's Influencer program and receive a monthly fee for using their TradingView charts in my analysis.
———————————
WISH YOU ALL LUCK
Signal
XAUUSD – the calm before the next breakout?Hello traders, what’s your take on the current trend in OANDA:XAUUSD ?
Looking back over the past 12 months, gold has delivered a truly impressive performance. From around $2,380 in August 2024, the precious metal surged to an all-time high of $3,432 by April this year — a gain of more than $1,000 in less than a year. But what’s more telling than the rise itself is how the market behaved afterward: instead of crashing, gold has maintained a high consolidation range, suggesting the uptrend is still very much alive.
This powerful rally didn’t happen in isolation. In a world marked by uncertainty, gold has once again asserted its role as a safe-haven asset. Inflation remains persistent across major economies, geopolitical tensions continue to stretch from Eastern Europe to the Middle East and Asia, and de-dollarization efforts by countries like China and Russia are reshaping global capital flows. None of these events alone could shake the markets, but together, they have laid the groundwork for gold’s sustained relevance.
From a technical standpoint, the long-term bullish structure remains intact. Following its peak at $3,432, gold has entered a modest correction phase — one that may well be a healthy consolidation before the next directional move.
Interestingly, while many investors remain cautious, the chart paints a different story: a market that isn’t afraid, but simply catching its breath. The real question is no longer “Can gold hold above $3,400?” but rather “Is the market gearing up for a fresh breakout — or a deeper correction?”
We may not be able to predict the future, but we can observe how price reacts at key levels. And sometimes, it’s in these seemingly quiet phases that the biggest turning points begin to form.
What do you think — is gold preparing for another leg up?
Drop your thoughts in the comments below! 👇

TESLA: Bullish Continuation & Long Trade
TESLA
- Classic bullish setup
- Our team expects bullish continuation
SUGGESTED TRADE:
Swing Trade
Long TESLA
Entry Point - 302.63
Stop Loss - 296.98
Take Profit - 312.87
Our Risk - 1%
Start protection of your profits from lower levels
Disclosure: I am part of Trade Nation's Influencer program and receive a monthly fee for using their TradingView charts in my analysis.
❤️ Please, support our work with like & comment! ❤️

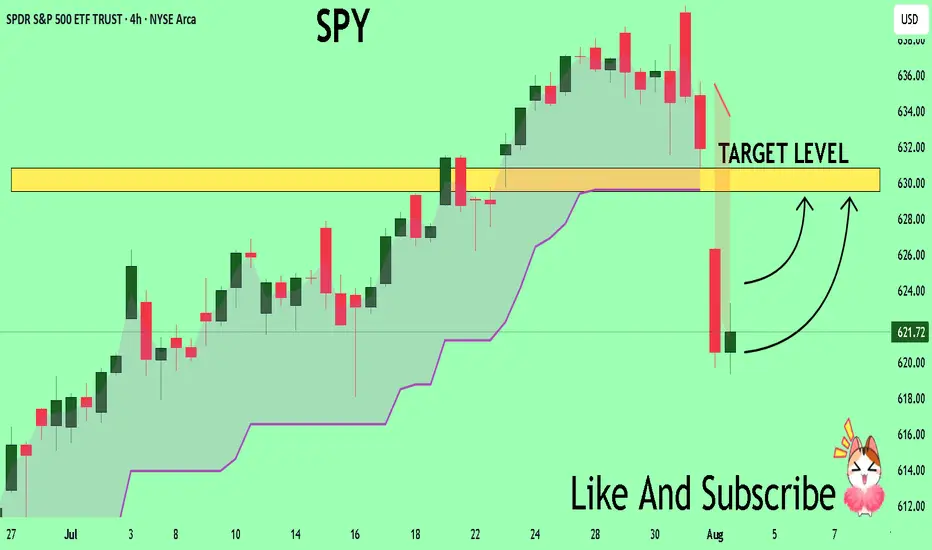
SPY Massive Long! BUY!
My dear subscribers,
My technical analysis for SPY is below:
The price is coiling around a solid key level - 621.72
Bias - Bullish
Technical Indicators: Pivot Points Low anticipates a potential price reversal.
Super trend shows a clear buy, giving a perfect indicators' convergence.
Goal - 629.55
About Used Indicators:
By the very nature of the supertrend indicator, it offers firm support and resistance levels for traders to enter and exit trades. Additionally, it also provides signals for setting stop losses
Disclosure: I am part of Trade Nation's Influencer program and receive a monthly fee for using their TradingView charts in my analysis.
———————————
WISH YOU ALL LUCK
NZDUSD What Next? SELL!
My dear subscribers,
This is my opinion on the NZDUSD next move:
The instrument tests an important psychological level 0.5920
Bias - Bearish
Technical Indicators: Supper Trend gives a precise Bearish signal, while Pivot Point HL predicts price changes and potential reversals in the market.
Target - 0.5899
My Stop Loss - 0.5932
About Used Indicators:
On the subsequent day, trading above the pivot point is thought to indicate ongoing bullish sentiment, while trading below the pivot point indicates bearish sentiment.
Disclosure: I am part of Trade Nation's Influencer program and receive a monthly fee for using their TradingView charts in my analysis.
———————————
WISH YOU ALL LUCK

BTCUSD: Long Signal with Entry/SL/TP
BTCUSD
- Classic bullish formation
- Our team expects growth
SUGGESTED TRADE:
Swing Trade
Buy BTCUSD
Entry Level - 11326
Sl - 11231
Tp - 11516
Our Risk - 1%
Start protection of your profits from lower levels
Disclosure: I am part of Trade Nation's Influencer program and receive a monthly fee for using their TradingView charts in my analysis.
❤️ Please, support our work with like & comment! ❤️

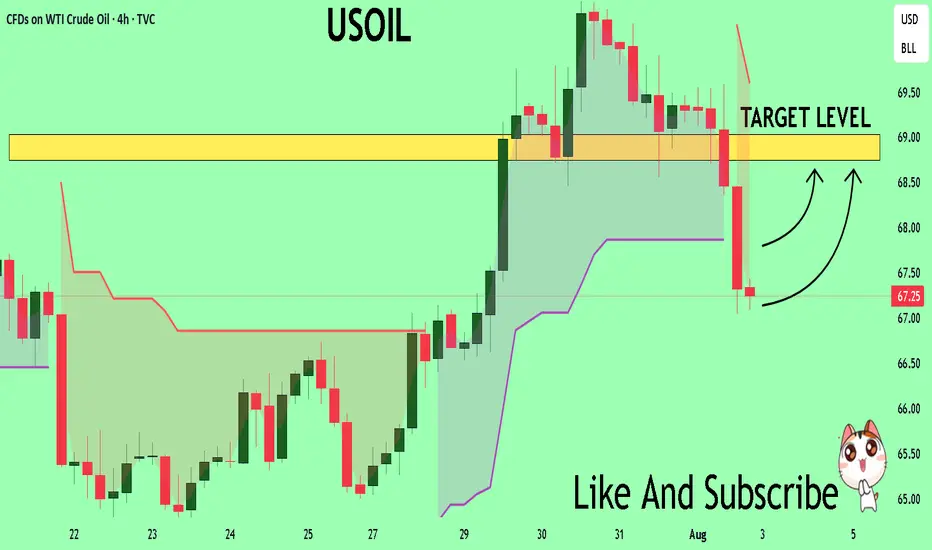
USOIL Technical Analysis! BUY!
My dear followers,
I analysed this chart on USOIL and concluded the following:
The market is trading on 67.25 pivot level.
Bias - Bullish
Technical Indicators: Both Super Trend & Pivot HL indicate a highly probable Bullish continuation.
Target - 68.74
About Used Indicators:
A super-trend indicator is plotted on either above or below the closing price to signal a buy or sell. The indicator changes color, based on whether or not you should be buying. If the super-trend indicator moves below the closing price, the indicator turns green, and it signals an entry point or points to buy.
Disclosure: I am part of Trade Nation's Influencer program and receive a monthly fee for using their TradingView charts in my analysis.
———————————
WISH YOU ALL LUCK
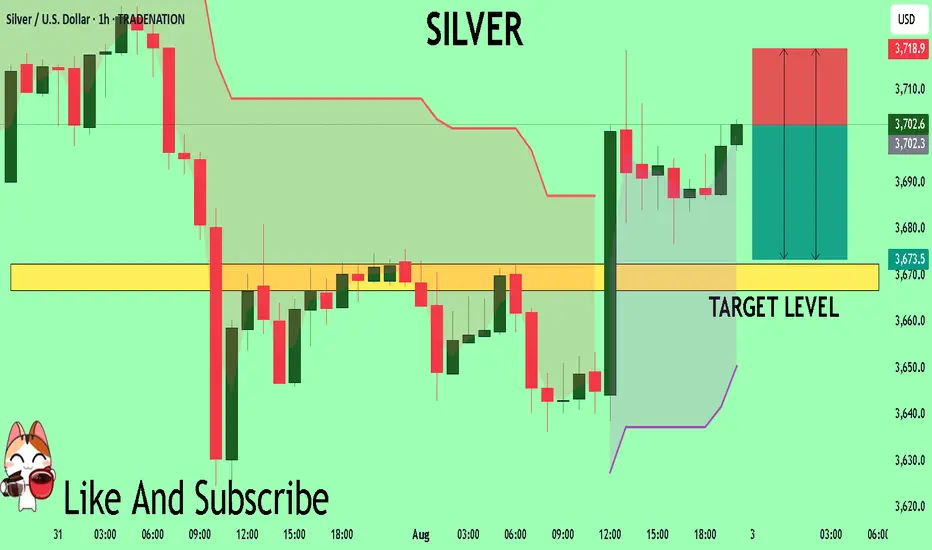
SILVER My Opinion! SELL!
My dear friends,
Please, find my technical outlook for SILVER below:
The price is coiling around a solid key level - 37.026
Bias - Bearish
Technical Indicators: Pivot Points Low anticipates a potential price reversal.
Super trend shows a clear sell, giving a perfect indicators' convergence.
Goal - 36.725
Safe Stop Loss - 37.189
About Used Indicators:
The pivot point itself is simply the average of the high, low and closing prices from the previous trading day.
Disclosure: I am part of Trade Nation's Influencer program and receive a monthly fee for using their TradingView charts in my analysis.
———————————
WISH YOU ALL LUCK
LitecoinLtc usdt daily analysis
Time frame hourly
Risk rewards ratio >2.7👈👌
Short position
Target 100.5 $

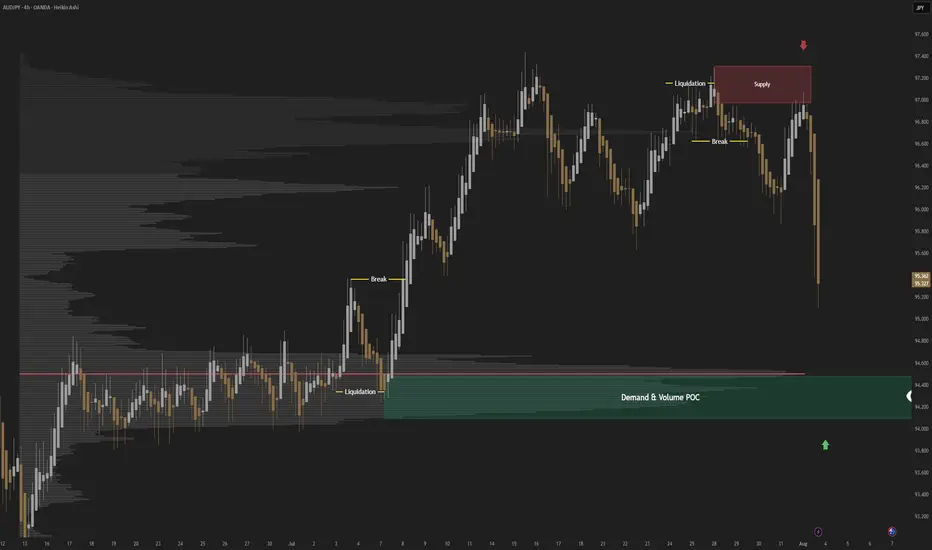
AUDJPY; Heikin Ashi Trade IdeaIn this post, I’ll be sharing my analysis of AUDJPY with my unique Heikin Ashi strategy.Picture tells more than 1000 words, no BS. I highlight key areas where I’m anticipating potential opportunities.
I’m always happy to receive any feedback.
Like, share and comment! ❤️

Reversal from Channel Bottom or a Real Breakdown? Identifying th
🎯 BTCUSDT - Analysis
🔹 Analysis Date: 1 August 2025
📉BTCUSDT:
Price is currently moving inside an ascending channel and has touched the bottom of the channel again, offering a potential buy opportunity.
However, for those seeking a low-risk entry, the zone around 118,000 could be ideal—if price returns to the channel and confirms support.
Although it seems the channel’s lower boundary might break, this could be a fake break to mislead traders before a rebound.
The support at 110,000 is a crucial short-term level; if it fails, a deeper correction toward 98,090 or even 94,000 is likely.
Our targets remain at the upper boundary of the channel.
⚠️ Risk Management Tip: Wait for confirmation near 118,000 if unsure, and always size positions based on overall volatility.

GBPUSD: Bearish Continuation & Short Signal
GBPUSD
- Classic bearish setup
- Our team expects bearish continuation
SUGGESTED TRADE:
Swing Trade
Short GBPUSD
Entry Point - 1.3264
Stop Loss - 1.3287
Take Profit -1.3218
Our Risk - 1%
Start protection of your profits from lower levels
Disclosure: I am part of Trade Nation's Influencer program and receive a monthly fee for using their TradingView charts in my analysis.
❤️Please, support our work with like & comment! ❤️

CADJPY Expected Growth! BUY!
My dear friends,
CADJPY looks like it will make a good move, and here are the details:
The market is trading on 107.35 pivot level.
Bias - Bullish
Technical Indicators: Supper Trend generates a clear long signal while Pivot Point HL is currently determining the overall Bullish trend of the market.
Goal - 107.90
About Used Indicators:
Pivot points are a great way to identify areas of support and resistance, but they work best when combined with other kinds of technical analysis
Disclosure: I am part of Trade Nation's Influencer program and receive a monthly fee for using their TradingView charts in my analysis.
———————————
WISH YOU ALL LUCK

CHFJPY On The Rise! BUY!
My dear friends,
My technical analysis for CHFJPY is below:
The market is trading on 183.63 pivot level.
Bias - Bullish
Technical Indicators: Both Super Trend & Pivot HL indicate a highly probable Bullish continuation.
Target - 184.54
Recommended Stop Loss - 183.16
About Used Indicators:
A pivot point is a technical analysis indicator, or calculations, used to determine the overall trend of the market over different time frames.
Disclosure: I am part of Trade Nation's Influencer program and receive a monthly fee for using their TradingView charts in my analysis.
———————————
WISH YOU ALL LUCK

EURUSD BUYING CORRECTION AND SHORTThe price is now at a strong support level and if it can be a double bottom it will retest the descending channel line and reach the orange resistance, but in the general direction the price prefers to fall due to breaking the black uptrend line. We also have a more beautiful scenario, which is if it can break the strong support we will go with the downward trend.

GOLD: Short Trading Opportunity
GOLD
- Classic bearish formation
- Our team expects fall
SUGGESTED TRADE:
Swing Trade
Sell GOLD
Entry Level - 3299.9
Sl - 3304.2
Tp - 3291.3
Our Risk - 1%
Start protection of your profits from lower levels
Disclosure: I am part of Trade Nation's Influencer program and receive a monthly fee for using their TradingView charts in my analysis.
❤️ Please, support our work with like & comment! ❤️

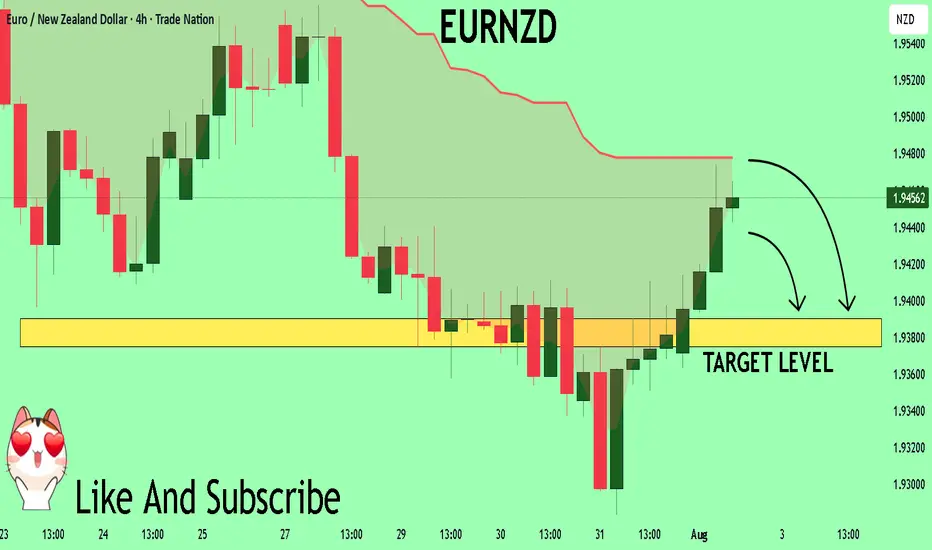
EURNZD Set To Fall! SELL!
My dear subscribers,
This is my opinion on the EURNZD next move:
The instrument tests an important psychological level 1.9459
Bias - Bearish
Technical Indicators: Supper Trend gives a precise Bearish signal, while Pivot Point HL predicts price changes and potential reversals in the market.
Target - 1.9390
About Used Indicators:
On the subsequent day, trading above the pivot point is thought to indicate ongoing bullish sentiment, while trading below the pivot point indicates bearish sentiment.
Disclosure: I am part of Trade Nation's Influencer program and receive a monthly fee for using their TradingView charts in my analysis.
———————————
WISH YOU ALL LUCK
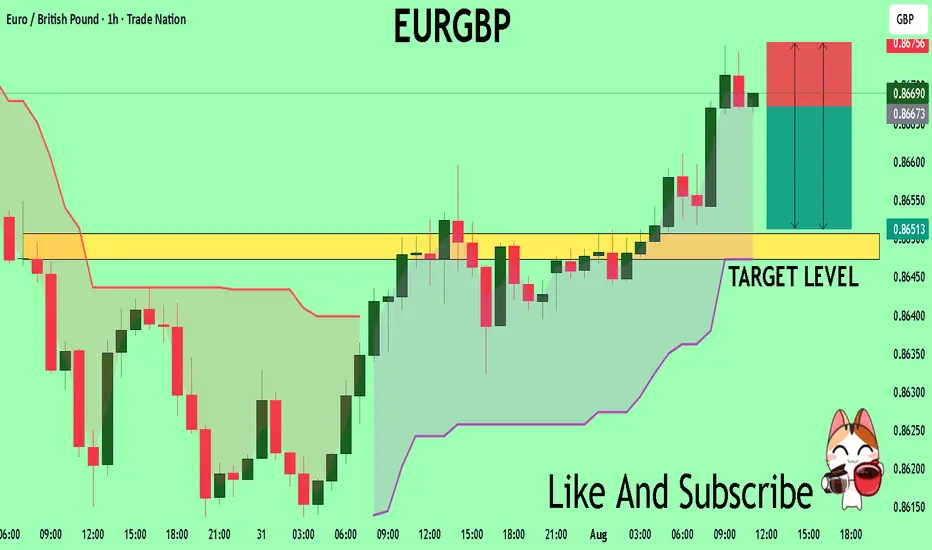
EURGBP Will Collapse! SELL!
My dear subscribers,
EURGBP looks like it will make a good move, and here are the details:
The market is trading on 0.8667 pivot level.
Bias - Bearish
My Stop Loss - 0.8675
Technical Indicators: Both Super Trend & Pivot HL indicate a highly probable Bearish continuation.
Target - 0.8650
About Used Indicators:
The average true range (ATR) plays an important role in 'Supertrend' as the indicator uses ATR to calculate its value. The ATR indicator signals the degree of price volatility.
Disclosure: I am part of Trade Nation's Influencer program and receive a monthly fee for using their TradingView charts in my analysis.
———————————
WISH YOU ALL LUCK
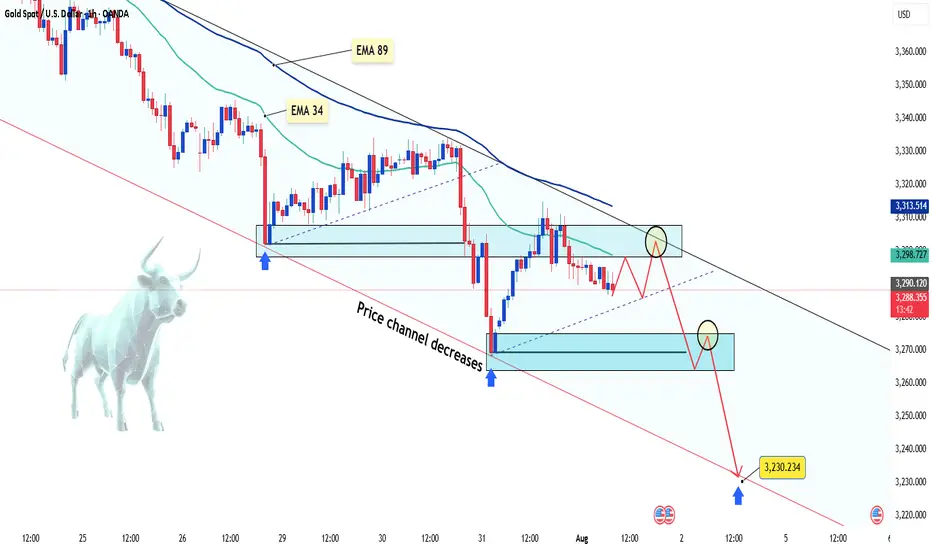
Gold keeps falling – is there more to come?Hello everyone, great to see you again!
Today, gold remains under pressure following a series of strong U.S. economic data releases, which have reinforced expectations that the Federal Reserve will keep interest rates elevated for longer. As a result, the U.S. dollar has strengthened, Treasury yields have climbed, and gold has lost its footing.
On the H1 chart, XAUUSD is clearly trading within a descending price channel. Both the EMA 34 and EMA 89 are acting as dynamic resistance zones. Recent attempts to rally have consistently failed at these levels, mirroring the bearish setup seen before July 29.
Currently, price is retesting a minor resistance area. If this retest fails, the next downside targets lie near 3,270 – and potentially down to 3,230 USD, which aligns with the lower boundary of the price channel.
From my perspective, the bearish momentum is likely to continue.
What about you? How do you think gold will close the day?
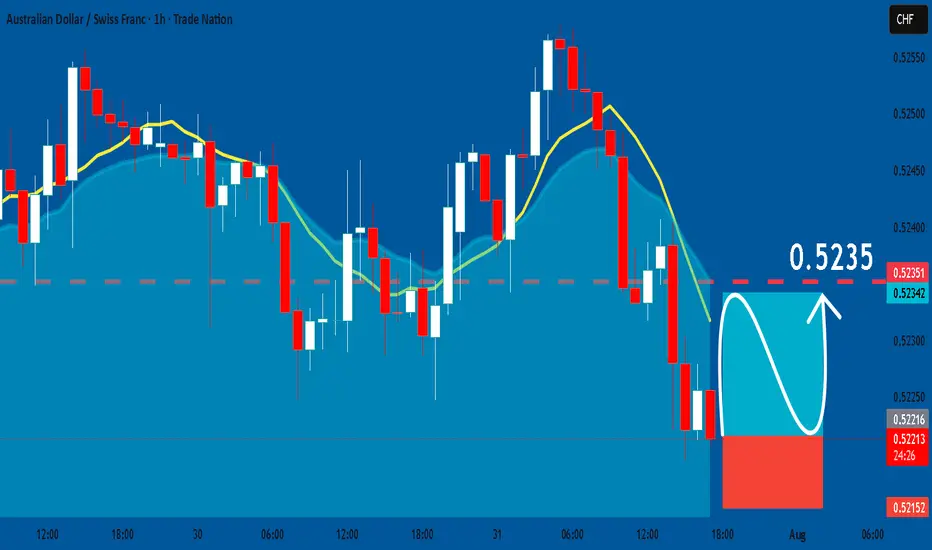
AUDCHF: Bullish Continuation & Long Signal
AUDCHF
- Classic bullish formation
- Our team expects pullback
SUGGESTED TRADE:
Swing Trade
Long AUDCHF
Entry - 0.5221
Sl - 0.5215
Tp - 0.5235
Our Risk - 1%
Start protection of your profits from lower levels
Disclosure: I am part of Trade Nation's Influencer program and receive a monthly fee for using their TradingView charts in my analysis.
❤️ Please, support our work with like & comment! ❤️
EURJPY: Short Trade Explained
EURJPY
- Classic bearish formation
- Our team expects pullback
SUGGESTED TRADE:
Swing Trade
Short EURJPY
Entry - 171.66
Sl - 172.11
Tp - 170.81
Our Risk - 1%
Start protection of your profits from lower levels
Disclosure: I am part of Trade Nation's Influencer program and receive a monthly fee for using their TradingView charts in my analysis.
❤️ Please, support our work with like & comment! ❤️

EURUSD – Retest Failed, Bearish Pressure RemainsHello, what’s your take on FX:EURUSD ?
After breaking the trendline, EURUSD attempted a retest but failed. The price is now hovering around 1.142, with selling pressure still evident.
This setup targets the 1.618 Fibonacci extension zone around 1.114. In the short term, a correction based on Dow Theory may unfold — the marked area could offer a perfect selling opportunity.
💡 Priority: SELL on RETEST – strict risk management with clear TP and SL.
Now it’s your turn — what’s your view? Share it in the comments below.
Good luck!
