EURAUD - Overall Bearish Medium-Term!Hello TradingView Family / Fellow Traders. This is Richard, also known as theSignalyst.
📈EURAUD has been overall bearish trading within the falling wedge pattern marked in red.
Moreover, the green zone is a strong structure and resistance.
🏹 Thus, the highlighted red circle is a strong area to look for sell setups as it is the intersection of the upper red trendline and resistance.
📚 As per my trading style:
As #EURAUD retests the red circle zone, I will be looking for bearish reversal setups (like a double top pattern, trendline break , and so on...)
📚 Always follow your trading plan regarding entry, risk management, and trade management.
Good luck!
All Strategies Are Good; If Managed Properly!
~Rich
Disclosure: I am part of Trade Nation's Influencer program and receive a monthly fee for using their TradingView charts in my analysis.
Signal

EURAUD - Long-Term Correction in the Making!Hello TradingView Family / Fellow Traders. This is Richard, also known as theSignalyst.
📈EURAUD has been bullish trading within the rising channel in blue.
Currently, EURAUD is retesting the upper bound of the channel.
Moreover, the $1.84 - $1.87 is a strong weekly resistance zone.
🏹 Thus, the highlighted red circle is a strong area to look for sell setups as it is the intersection of the upper blue trendline and green resistance zone.
📚 As per my trading style:
As #EURAUD is hovering around the red circle zone, I will be looking for bearish reversal setups (like a double top pattern, trendline break , and so on...)
📚 Always follow your trading plan regarding entry, risk management, and trade management.
Good luck!
All Strategies Are Good; If Managed Properly!
~Rich
Disclosure: I am part of Trade Nation's Influencer program and receive a monthly fee for using their TradingView charts in my analysis.

NZDUSD: Bearish Continuation & Short Trade
NZDUSD
- Classic bearish formation
- Our team expects fall
SUGGESTED TRADE:
Swing Trade
Sell NZDUSD
Entry Level - 0.5987
Sl - 0.6008
Tp - 0.5948
Our Risk - 1%
Start protection of your profits from lower levels
Disclosure: I am part of Trade Nation's Influencer program and receive a monthly fee for using their TradingView charts in my analysis.
❤️ Please, support our work with like & comment! ❤️

GOLD: Bullish Continuation & Long Trade
GOLD
- Classic bullish formation
- Our team expects pullback
SUGGESTED TRADE:
Swing Trade
Long GOLD
Entry - 3387.7
Sl - 3380.3
Tp - 3403.8
Our Risk - 1%
Start protection of your profits from lower levels
Disclosure: I am part of Trade Nation's Influencer program and receive a monthly fee for using their TradingView charts in my analysis.
❤️ Please, support our work with like & comment! ❤️

There's still a little more left to sip from gold’s cup
Weekly Outlook on Gold (XAUUSD)
Gold has formed a classic cup pattern on the weekly timeframe, indicating a strong bullish continuation setup. If the pattern completes successfully, we could see a move toward the top of the channel, targeting the 4039 – 4100 zone.
The recent pullback to 3208 was a retest of the previously broken daily structure, acting as a healthy correction before the next potential leg up.
For those looking to enter this move, an ideal strategy would be to place a buy stop order above the last high, as a breakout confirmation.
⚠️ Important note: If the black trendline on the daily chart (which represents the current bullish structure) gets broken to the downside, the trade setup would become invalid and a reassessment would be required.
✅ The best approach is to wait for a clean breakout above the 3495 resistance, then look for a pullback entry on lower timeframes with proper risk management.
📉 In the longer term, we still expect a potential retracement all the way back to the 2199.661 level — so be aware of the bigger picture and adapt as the structure evolves.

GBPJPY - Crazy Bullish!Hello TradingView Family / Fellow Traders. This is Richard, also known as theSignalyst.
📈GBPJPY has been overall bullish trading within the rising channel marked in blue.
Moreover, it is retesting a strong demand zone marked in green.
🏹 Thus, the highlighted blue circle is a strong area to look for buy setups as it is the intersection of demand and lower blue trendline acting as a non-horizontal support.
📚 As per my trading style:
As #GBPJPY approaches the blue circle zone, I will be looking for bullish reversal setups (like a double bottom pattern, trendline break , and so on...)
📚 Always follow your trading plan regarding entry, risk management, and trade management.
Good luck!
All Strategies Are Good; If Managed Properly!
~Rich
Disclosure: I am part of Trade Nation's Influencer program and receive a monthly fee for using their TradingView charts in my analysis.

INJ Breakdown in 1H | Bears in Control👀 Welcome to my Trading View Analysis and Trading Channel Here , we share the latest market analysis, trading signals, and key insights together .
Ready for smarter trades ? ⭐️
⚡️Today , we're going to analyze the INJ ( Injective) coin together on the daily timeframe and find triggers for our positions .
📉 INJ 1H Technical Breakdown
The INJ coin is currently exhibiting signs of weakness on the 1-hour timeframe, having broken below the key support level at $9.18 and continuing its downward trajectory. This movement indicates a shift in market sentiment towards bearishness.
Binance
🧭 Trend & Indicators:
Downtrend Formation: A clear downtrend is forming, characterized by lower lows and lower highs, suggesting sustained selling pressure.
Increasing Selling Volume: There's a noticeable increase in selling volume, reinforcing the bearish momentum.
Binance
RSI Approaching Oversold: The Relative Strength Index (RSI) is nearing the oversold zone, indicating potential for further downside but also cautioning traders of possible short-term reversals.
Price Below SMAs: The price is closing below all three Simple Moving Averages (SMAs), signaling a continuation of the bearish structure.
EMA 50 Rejection: A sharp rejection occurred after a retest of the EMA 50, followed by a strong red candle — a classic sign of bearish strength.
📰 Recent Developments:
Price Decline: Over the past week, INJ's price has declined by approximately 8.3%, reflecting broader market corrections.
CoinGecko
Market Activity: Despite the price drop, Injective's trading volume remains robust, indicating continued investor interest and market activity.
CoinCarp
+15
crypto.news
+15
Coinbase
+15
Technical Patterns: Analysts have observed that INJ has broken below the $10.25–$10.30 support zone, triggering a bearish continuation pattern.
Binance
📌 Trading Insight:
With proper risk management and a solid trading plan, this setup offers a potential short opportunity. The technical signals are aligned, and momentum appears to favor sellers for now.
🎯 Watch for continuation patterns or lower time frame triggers to enter with precision.
I love you all so much . 👀
don't forget about capital management and risk management .
Be careful with your positions . 🥇

EURUSD Massive Short! SELL!
My dear friends,
EURUSD looks like it will make a good move, and here are the details:
The market is trading on 1.1340 pivot level.
Bias - Bearish
Technical Indicators: Supper Trend generates a clear short signal while Pivot Point HL is currently determining the overall Bearish trend of the market.
Goal - 1.1315
About Used Indicators:
Pivot points are a great way to identify areas of support and resistance, but they work best when combined with other kinds of technical analysis
Disclosure: I am part of Trade Nation's Influencer program and receive a monthly fee for using their TradingView charts in my analysis.
———————————
WISH YOU ALL LUCK

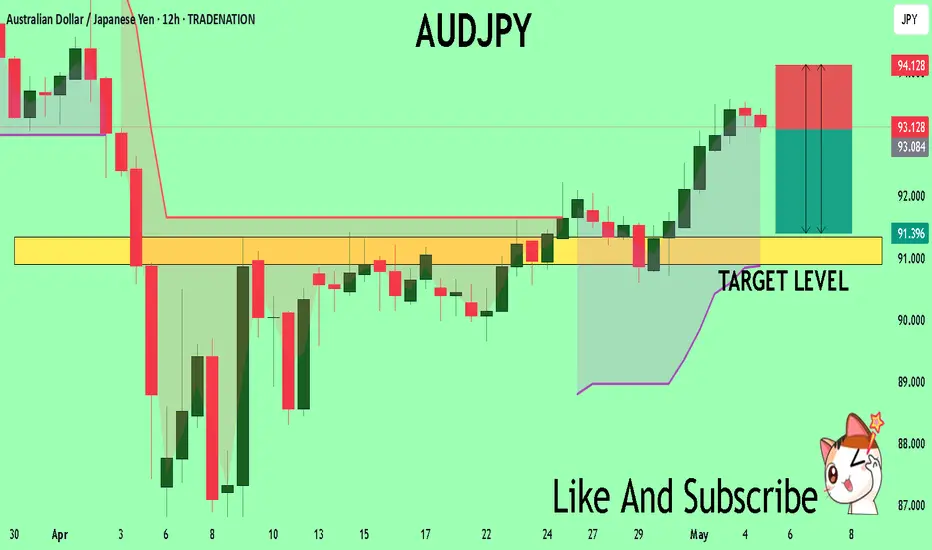
AUDJPY Buyers In Panic! SELL!
My dear subscribers,
AUDJPY looks like it will make a good move, and here are the details:
The market is trading on 93.104 pivot level.
Bias - Bearish
My Stop Loss - 94.128
Technical Indicators: Both Super Trend & Pivot HL indicate a highly probable Bearish continuation.
Target - 91.339
About Used Indicators:
The average true range (ATR) plays an important role in 'Supertrend' as the indicator uses ATR to calculate its value. The ATR indicator signals the degree of price volatility.
Disclosure: I am part of Trade Nation's Influencer program and receive a monthly fee for using their TradingView charts in my analysis.
———————————
WISH YOU ALL LUCK
EURUSD: Great Trading Opportunity
EURUSD
- Classic bullish setup
- Our team expects bullish continuation
SUGGESTED TRADE:
Swing Trade
Long EURUSD
Entry Point - 1.1326
Stop Loss - 1.1285
Take Profit - 1.1402
Our Risk - 1%
Start protection of your profits from lower levels
Disclosure: I am part of Trade Nation's Influencer program and receive a monthly fee for using their TradingView charts in my analysis.
❤️ Please, support our work with like & comment! ❤️

GOLD The Target Is DOWN! SELL!
My dear friends,
My technical analysis for GOLD is below:
The market is trading on 3377.8 pivot level.
Bias - Bearish
Technical Indicators: Both Super Trend & Pivot HL indicate a highly probable Bearish continuation.
Target - 3357.7
Recommended Stop Loss - 3387.7
About Used Indicators:
A pivot point is a technical analysis indicator, or calculations, used to determine the overall trend of the market over different time frames.
Disclosure: I am part of Trade Nation's Influencer program and receive a monthly fee for using their TradingView charts in my analysis.
———————————
WISH YOU ALL LUCK

EURNZD - Strong Intersection!Hello TradingView Family / Fellow Traders. This is Richard, also known as theSignalyst.
📈EURNZD has been in a correction phase trading within the falling red channel and it is currently retesting the lower bound of the bullish channel marked in blue.
Moreover, the green zone is a strong structure and support zone.
🏹 Thus, the highlighted blue circle is a strong area to look for buy setups as it is the intersection of structure and lower blue and red trendlines acting as non-horizontal support.
📚 As per my trading style:
As #EURNZD approaches the blue circle, I will be looking for bullish reversal setups (like a double bottom pattern, trendline break , and so on...)
📚 Always follow your trading plan regarding entry, risk management, and trade management.
Good luck!
All Strategies Are Good; If Managed Properly!
~Rich
Disclosure: I am part of Trade Nation's Influencer program and receive a monthly fee for using their TradingView charts in my analysis.

AUDUSD: Short Signal with Entry/SL/TP
AUDUSD
- Classic bearish formation
- Our team expects pullback
SUGGESTED TRADE:
Swing Trade
Short AUDUSD
Entry - 0.6477
Sl - 0.6503
Tp - 0.6429
Our Risk - 1%
Start protection of your profits from lower levels
Disclosure: I am part of Trade Nation's Influencer program and receive a monthly fee for using their TradingView charts in my analysis.
❤️ Please, support our work with like & comment! ❤️

EURNZD On The Rise! BUY!
My dear followers,
This is my opinion on the EURNZD next move:
The asset is approaching an important pivot point 1.8946
Bias - Bullish
Safe Stop Loss - 1.8880
Technical Indicators: Supper Trend generates a clear long signal while Pivot Point HL is currently determining the overall Bullish trend of the market.
Goal - 1.9061
About Used Indicators:
For more efficient signals, super-trend is used in combination with other indicators like Pivot Points.
Disclosure: I am part of Trade Nation's Influencer program and receive a monthly fee for using their TradingView charts in my analysis.
———————————
WISH YOU ALL LUCK

GOLD: Short Signal Explained
GOLD
- Classic bearish pattern
- Our team expects retracement
SUGGESTED TRADE:
Swing Trade
Sell GOLD
Entry - 3311.9
Stop - 3324.4
Take - 3287.1
Our Risk - 1%
Start protection of your profits from lower levels
Disclosure: I am part of Trade Nation's Influencer program and receive a monthly fee for using their TradingView charts in my analysis.
❤️ Please, support our work with like & comment! ❤️

SPY: Short Trade with Entry/SL/TP
SPY
- Classic bearish setup
- Our team expects bearish continuation
SUGGESTED TRADE:
Swing Trade
Short SPY
Entry Point - 566.62
Stop Loss - 582.02
Take Profit - 540.07
Our Risk - 1%
Start protection of your profits from lower levels
Disclosure: I am part of Trade Nation's Influencer program and receive a monthly fee for using their TradingView charts in my analysis.
❤️ Please, support our work with like & comment! ❤️

TESLA: Bearish Continuation & Short Signal
TESLA
- Classic bearish formation
- Our team expects fall
SUGGESTED TRADE:
Swing Trade
Sell TESLA
Entry Level - 287.25
Sl - 299.67
Tp - 259.90
Our Risk - 1%
Start protection of your profits from lower levels
Disclosure: I am part of Trade Nation's Influencer program and receive a monthly fee for using their TradingView charts in my analysis.
❤️ Please, support our work with like & comment! ❤️

NATGAS Under Pressure! SELL!
My dear friends,
Please, find my technical outlook for NATGAS below:
The instrument tests an important psychological level 3.667
Bias - Bearish
Technical Indicators: Supper Trend gives a precise Bearish signal, while Pivot Point HL predicts price changes and potential reversals in the market.
Target - 3.408
Recommended Stop Loss - 3.818
About Used Indicators:
Super-trend indicator is more useful in trending markets where there are clear uptrends and downtrends in price.
Disclosure: I am part of Trade Nation's Influencer program and receive a monthly fee for using their TradingView charts in my analysis.
———————————
WISH YOU ALL LUCK

SILVER Set To Grow! BUY!
My dear subscribers,
My technical analysis for SILVER is below:
The price is coiling around a solid key level - 32.014
Bias - Bullish
Technical Indicators: Pivot Points Low anticipates a potential price reversal.
Super trend shows a clear buy, giving a perfect indicators' convergence.
Goal - 32.660
My Stop Loss - 31.682
About Used Indicators:
By the very nature of the supertrend indicator, it offers firm support and resistance levels for traders to enter and exit trades. Additionally, it also provides signals for setting stop losses
Disclosure: I am part of Trade Nation's Influencer program and receive a monthly fee for using their TradingView charts in my analysis.
———————————
WISH YOU ALL LUCK

QQQ Technical Analysis! SELL!
My dear subscribers,
This is my opinion on the QQQ next move:
The instrument tests an important psychological level 488.86
Bias - Bearish
Technical Indicators: Supper Trend gives a precise Bearish signal, while Pivot Point HL predicts price changes and potential reversals in the market.
Target - 463.87
About Used Indicators:
On the subsequent day, trading above the pivot point is thought to indicate ongoing bullish sentiment, while trading below the pivot point indicates bearish sentiment.
Disclosure: I am part of Trade Nation's Influencer program and receive a monthly fee for using their TradingView charts in my analysis.
———————————
WISH YOU ALL LUCK

APPLE Set To Grow! BUY!
My dear friends,
Please, find my technical outlook for APPLE below:
The price is coiling around a solid key level - 205.25
Bias - Bullish
Technical Indicators: Pivot Points High anticipates a potential price reversal.
Super trend shows a clear buy, giving a perfect indicators' convergence.
Goal - 208.36
About Used Indicators:
The pivot point itself is simply the average of the high, low and closing prices from the previous trading day.
Disclosure: I am part of Trade Nation's Influencer program and receive a monthly fee for using their TradingView charts in my analysis.
———————————
WISH YOU ALL LUCK

GOLD What Next? SELL!
My dear friends,
Please, find my technical outlook for GOLD below:
The price is coiling around a solid key level - 3263.7
Bias - Bearish
Technical Indicators: Pivot Points Low anticipates a potential price reversal.
Super trend shows a clear sell, giving a perfect indicators' convergence.
Goal - 3249.1
Safe Stop Loss - 3271.6
About Used Indicators:
The pivot point itself is simply the average of the high, low and closing prices from the previous trading day.
Disclosure: I am part of Trade Nation's Influencer program and receive a monthly fee for using their TradingView charts in my analysis.
———————————
WISH YOU ALL LUCK

GBPCHF The Target Is UP! BUY!
My dear followers,
I analysed this chart on GBPCHF and concluded the following:
The market is trading on 1.0953 pivot level.
Bias - Bullish
Technical Indicators: Both Super Trend & Pivot HL indicate a highly probable Bullish continuation.
Target - 1.0984
About Used Indicators:
A super-trend indicator is plotted on either above or below the closing price to signal a buy or sell. The indicator changes color, based on whether or not you should be buying. If the super-trend indicator moves below the closing price, the indicator turns green, and it signals an entry point or points to buy.
Disclosure: I am part of Trade Nation's Influencer program and receive a monthly fee for using their TradingView charts in my analysis.
———————————
WISH YOU ALL LUCK
