GBP/USD SELL STOP @1.27147Hi Traders we have another Trade on GBP/USD sell Stop @1.27147 analysis taken from H4 scale down to 5minutes.
Certified price action king.
Signalprovider

XAU/USD BUY 50+PIPS RUNNING IN PROFITHi Traders we send XAU/USD BUY now we running 50+pips in profit we have hit 50% retracement. can close or move stop loss to entry.
Certified price action king.

USD/JPY BUY TP HITHi Traders we send USD/JPY trade early today it has hit out Tp. hope you learning from analysis I'm sending daily.
Certified price action king

USD/JPY BUY NOWHi Traders we have beautiful trade on USDJPY buy. trade was taken from H4 scale down to 15minutes. please do analysis before taking trade.
Certified price action king.

AUD/USD SELL RUNNING 20+PIPSHi Traders trade we send couple of minutes ago is running 20+pips in profit. please move stop loss to entry and let trade run.
Certified price action king.

AUD/USD SELL NOWHi Traders Yesterday we send AUD/USD Trade unfortunately pending order didn't trigger. we have market execution sell on AUD/USD. analysis taken from H4 scale down to H1 and 15Minutes.
Certified price action king.

XAUUSD OUTLOOK - August 4 2024With the month of August rolling over, we have already seen massive sell offs for individuals looking to get into premium long positions. At this stage, the market is highly sensitive and we will be looking for continuation longs into new ATH territory once our lower retracements and POIs have been met.
- Long considerations at 2400~2410, 2430~2440.
- Short considerations at 2460s & 2440s.

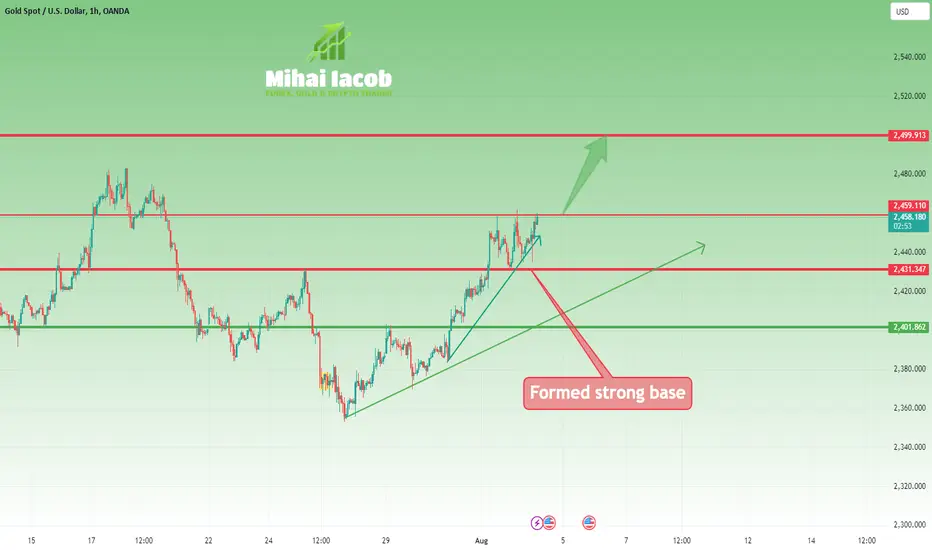
Gold is pressing for a break, will NFP bring new ATH?Yesterday was a highly volatile day for gold.
Initially, XAU/USD experienced a drop in support.
However, it quickly reversed its trend and moved upward. After reaching 2460, the price fell sharply back to support levels.
Overnight, another drop to support was met with strong buying power, resulting in a long-tailed pin bar on the hourly chart.
At the time of writing, the price has returned to resistance (2460 zone)
Judging by the price action over the past 24 hours, I believe gold is poised for an upward break. If I'm correct, the measured target is 2490, and we could even see 2500 today if there is a genuine break and the NFP report surprises.
UsdCad- Will it finally break 1.4? (Swing trade idea)USD/CAD is currently trading around the 1.3850 resistance zone, a level that has been tested repeatedly since September 2022, each time resulting in a decline.
However, this year, after testing this resistance, the bears haven't managed to push the price down to its previous support levels. Instead, a higher support has formed at 1.36.
The recent rise from 1.36 has been impulsive, suggesting strong upward momentum.
This leads me to believe that a break above the current resistance is likely, potentially pushing the price above 1.4.
In conclusion, dips towards 1.37 should be considered buying opportunities, aiming for a favorable risk-to-reward ratio with a target around 1.41.

It's imperative for bulls to hold 63.500
In my weekend analysis, I mentioned that BTC looked bullish across all time frames. The beginning of this week was promising for BTC, but enthusiasm faded at 70k, and the price started to decline.
Currently, the price is at 64k, just above the 63,500 support level. This support is crucial for the medium-term price evolution. If the bulls cannot maintain the price above this level, we might see a drop below 60k, potentially negating my prediction of 100k by the end of the year.
At this moment, I'm neutral on BTC. If the price breaks below the support, I will exit with a loss. Only a return to the 68-69k zone would bring some optimism back.

Gold Ends Month on a High Note with Key BreakoutsGold finished the month on a very optimistic note, reversing 1000 pips from the recent low. More importantly, the month-end brought three significant breaks for bulls:
1. A break above the 2390 confluence resistance.
2. A break above the 2400 psychological level.
3. A break above last week’s high of 2430.
With this positive momentum, further gains and a test of the 2500 level are expected soon.
Technical Outlook and Strategy:
From a technical standpoint, the recently broken resistance levels should now act as support.
In this zone, I will look for buying opportunities.
The initial target could be the last all-time high (ATH), but if the price continues rising toward that zone, I believe it will break above it.
Consequently, bulls are likely to push the price above 2500 to test new highs.
Overall, the current market sentiment and technicals suggest a strong bullish trend for Gold, making it an attractive prospect for traders looking for buying opportunities.

Silver- Ready for 35usd A few months ago, I wrote an XAG/USD analysis, predicting that Silver could rise by 10,000 pips to reach 35.
Achieving such a significant target requires patience, and the price won't climb in a straight line. However, my long-term conviction remains unchanged: Silver will likely rise to 35 USD/oz.
But as Keynes said, "In the long run, we are all dead," so let's focus on the short term.
Recently, as shown in the posted chart, Silver broke below horizontal support.
However, after a bullish Pin Bar formation a few days ago, the price reversed strongly and is now trading back at the old support, which has become resistance.
This suggests the possibility of a false break.
At this moment, given the proximity to resistance, a correction is possible. However, this correction should be seen as a good opportunity to buy in anticipation of a false break. Depending on your patience, you could set your target at 30, 32, or my long-term target of 35.

GbpUsd- Back above 1.3?In my previous GBP/USD analysis, I highlighted the important 1.2850 support zone.
Yesterday, the pair fell below this support; however, sellers couldn't push the price down significantly, and a strong floor was found at 1.28.
The recent drop from above 1.3 appears corrective in nature, overlapping and resembling a falling wedge with a false break below support.
Considering yesterday's price action, I anticipate a reversal.
Confirmation of this reversal comes if GBP/USD moves above 1.2870. In that case, we can consider 1.28 a low and expect the price to continue rising back above 1.3.

Gold- Ready for 2500Yesterday, XAU/USD broke back above the 2390 technical resistance and the significant 2400 level, closing the day on a strong bullish note at 2410.
This price action suggests that the correction is over and bulls are ready to conquer new highs.
At the time of writing, the price is at 2421, with technical resistance at 2430. Given the recent rise, a correction from that level could occur.
However, it is very risky to sell at this resistance considering the strong bullish momentum.
In my opinion, it is better to wait and buy on dips. An ideal level for buying is around the 2400 zone, but given the strong bullish momentum, the price might not drop that low.
In conclusion, I am looking to buy during corrections trying to time my entries as the market flows.

Gold- Higher low in place and back above 2400?In my yesterday's comment, I said that OANDA:XAUUSD could resume its bullish trajectory and buying dips could be a good strategy.
Indeed, during the day XauUsd fell to 2370, however, bulls took control and closed the day at 2383.
At this moment Gold is facing 2390 resistance again, a resistance that now is confluent with the falling trend line and a break above would confirm a higher low in place and a reversal to the upside.
As long as yesterday's low remains intact so is my strategy: buying dips.

Total 3 Analysis & name your altSimilar to Bitcoin, altcoins also began a correction in March.
Although this correction has been steeper, it remains a correction. After breaking below the 600B support, the total altcoin market found support around 500B and is now trading back above 600B, suggesting a false break.
The confluence of falling line resistance and horizontal resistance around 650B indicates that a break above this level should accelerate gains for the total altcoin market and potentially lead to a retest of the previous high.
In a more optimistic scenario, if Bitcoin heads towards 100k, we could even see a 1T market cap for altcoins.
P.S. I see a lot of altcoins with great potential. Would you like me to look into any specific ones for you?
Regards!
Mihai Iacob

Nasdaq could test the broken neck line levelLast week, the Nasdaq broke below the neckline of a head and shoulders (H&S) pattern, which took over a month to form. The price quickly accelerated to the downside, dropping almost 800 points.
However, once the price approached the rising trend line of the channel (a channel that has kept the price elevated for the past nine months), buyers entered the market, and now the Nasdaq 100 is trading back above 19,000.
This recovery could continue in the coming days, and a test of the broken support level is likely.
Looking further ahead to the medium term, if the price reverses from that level and drops below 19,000 once more, a break below the support line of the channel becomes probable, potentially leading to a deep correction.
For now though, as long as 18,700 remains intact, the bulls hold the upper hand.

UsdJpy could test 157,50 zone (250 pips rise)After an impressive 1000-pip drop in two weeks, USD/JPY reversed precisely from an old resistance level, now support at 152.
At this point, we also see a higher low in place, and bulls seem determined to recover lost ground.
In the overall trend, the 1000-pip drop is merely a correction and even if there will be a new leg down toward the important 150 level, a test of the 157.50 zone is probable.
I remain bullish as long as the 152.80-153.00 zone holds intact.
Buying dips below 154 could be a good strategy with a risk-reward ratio of more than 1:3.

XAU/USD BUY NOWHi Traders another trade on XAU/USD BUY NOW analysis made H1 to 15minutes.
Certified price action king.

AUD/USD SELL NOWHi Traders we have another trade on AUD/USD SELL. analysis taken from H4 scale down to 15minutes.
Certified price action king.

NASDAQ BUY STOP @19188.8Hi Traders we have potential trade on NASDAQ BUY STOP @19188.8 Use risk management when taking this analysis.
Certified price action king.

DXY- Two important levels to watchIn last week's analysis of the DXY, I noted that the index had reversed back above support, potentially indicating a false break. Additionally, the smaller time frame charts are showing an inverted head and shoulders pattern.
This idea remains valid, though with some reservations, as the right shoulder is taking too long to complete. This extended formation period is not ideal when trading a head and shoulders pattern.
The key level I'm watching is 104.50. If there is a clear break above this level, I will look for opportunities to sell USD pairs, with a focus on GBP/USD. Conversely, if the index breaks below 104, I will look to buy USD pairs, concentrating on AUD and NZD.
For now, it's best to wait and see where the break occurs. After such a long consolidation, the resulting move is likely to be strong.

GbpUsd at critical supportAs expected, GBP/USD broke above the 1.2850 resistance level and surpassed 1.3.
A correction followed, and now the pair is back at support, possibly retesting this level.
However, the inability to stabilize above 1.3 and the fact that the DXY (US Dollar Index) experienced a false breakdown is not very reassuring for bulls.
A break below this support would indicate a false breakout and potentially lead to further losses.
Currently, I have a bearish bias for cable and am waiting for confirmation to open short trades.
