GbpUsd could dive at least 500 pips if not even moreFor nearly six months, the price action of FX:GBPUSD has been rather dull, to say the least, with the pair confined within a 250-pip range. This stagnation is particularly notable for a pair as volatile as the cable.
However, upon examining a weekly chart, we can draw some conclusions and gain perspective on potential future movements. Three factors lead me to believe that a drop of at least 500 pips is in the cards for GBP/USD:
1. We've witnessed a false breakout to the upside, and typically, in the case of false breakouts, the asset tends to break in the opposite direction.
2. It's highly likely that this week will conclude with a bearish engulfing pattern on our chart.
3. Although not textbook-perfect, the structure of the last six months resembles a head and shoulders pattern.
Considering these factors collectively, I anticipate a downward break, with the initial support just above 1.2 coming into focus.
P.S: Given the pair's volatility and prolonged range-bound trading, in the event of a downward break, the movement could be quite violent. I wouldn't be surprised if we see a drop of 1,000 pips.
Signalprovider

Gold- Correction over? 2350 zone holds the keyYesterday, the CPI report revealed higher-than-expected numbers, which triggered a selling spree on OANDA:XAUUSD , causing the price of gold to drop to 2319 after the release.
However, this downturn was swiftly reversed, and the price hasn't reached the liquidity zone from above 2300 and also the second attempt from bears to push the price in that zone resulted in a higher low at 2325.
Furthermore, upon examining the hourly chart, it's evident that the price movement is well defined by a rising channel, and yesterday's reversal occurred precisely at the channel's support.
While the bulls aren't out of the woods just yet, yesterday's price action indicates that there is still a strong demand for gold.
From a technical standpoint, as mentioned earlier, we observed a reversal from the channel's support within a robust uptrend, which is a positive sign for buyers.
However, for confirmation and to consider this correction concluded, we need to see stabilization above 2350. Once this happens, a new all-time high is highly probable, and bulls could potentially target the 2400 zone.

ICP- Correction over and rise to 22 next?As you're aware, I've been very bullish on BINANCE:ICPUSDT during this bull cycle, consistently predicting growth, with the last target at the 20 zone already achieved.
Following this encounter with resistance, the coin began to reverse course, entering a correction phase, and yesterday it reached support at the 15 zone.
I believe the correction may be over now, and I anticipate a new upward movement, possibly reaching levels around 22.

Bitcoin- Still asking for 80kAfter breaking above the symmetrical triangle on Monday, BITSTAMP:BTCUSD dipped once more, just to reverse again strongly yesterday above the critical 70k, leaving a nice Piercing Pattern on our daily chart.
71-71.5k still holds the key for further growth and when (or if) bulls clear that zone the road is clear for new ATH with a focus on 80k figure.

UsdCad- New rise to 1.39?Towards the end of last year, FX:USDCAD found itself testing the crucial support zone at 1.32. Subsequently, the pair reversed its course and, as of the beginning of February, has been consistently forming higher lows on our daily chart while pressing the significant resistance level at 1.36.
I anticipate that this resistance will ultimately be breached, paving the way for a rise towards 1.39. My bullish stance on this pair remains intact as long as the sequence of lower highs is not violated.

EurUsd is approaching important resistanceSince the start of the year, the price action of FX:EURUSD has been clearly confined within a descending triangle, with a base formed at 1.07. Recently, the pair reversed once again from this crucial level and, at the time of writing, is trading at 1.0856, close to the descending trend line of the triangle.
A rise towards the 1.09 resistance level could provide bears with a favorable entry point for a new drop towards support.
However, the negation of this scenario occurs if the price closes towards 1.1 on a daily basis.

XauUsd- Will CPI trigger a 500 pips drop?Fundamentals:
Given the persistent challenge of downshifting inflation within the U.S. economy this year, market participants eagerly await the release of March Consumer Price Index (CPI) figures by the U.S. Bureau of Labor Statistics on Wednesday.
This report carries significant potential to induce volatility across various asset classes, necessitating traders to brace themselves for potentially volatile market conditions, particularly if the incoming data deviates from expectations.
Projections indicate that the headline CPI is expected to have risen by 0.3% monthly, which would elevate the yearly reading to 3.4% from the previous 3.2%.
Similarly, the core CPI, excluding food and energy, is anticipated to exhibit a 0.3% increase on a seasonally adjusted basis. However, the 12-month rate is forecasted to moderate to 3.7% from the prior 3.8%, marking a modest but encouraging step toward addressing inflationary concerns.
While recent hotter-than-anticipated CPI and employment figures have prompted a shift in Fed interest rate expectations towards a more hawkish stance in recent weeks, investors still perceive a greater than 50% probability that policymakers will maintain their current stance at the June meeting. Nonetheless, this sentiment could be subject to change if price pressures exhibit signs of reacceleration, jeopardizing progress toward disinflation.
Potential scenarios (in theory):
1. CPI report exceeds projections:
Should the CPI report surpass expectations, market participants are likely to interpret this as a signal that inflationary pressures are resurging. This would challenge the notion that earlier price spikes observed this year were transitory, thereby reinforcing the likelihood of a prolonged struggle to restore price stability. Consequently, the Fed may reconsider its policy outlook, potentially deferring the commencement of its easing cycle. This scenario is anticipated to be supportive for the U.S. dollar but unfavorable for XauUsd.
2.Inflation figures fall below expectations:
Conversely, if the inflation numbers come in below expectations, markets are expected to respond positively, particularly if the deviation is substantial. This outcome could prompt traders to bolster their expectations of the Fed initiating rate cuts in June, potentially amounting to at least 75 basis points of easing this year, aligning with the central bank's prior dot plot projections. A dovish repricing of interest rate expectations is likely to exert downward pressure on Treasury yields, thereby dampening the U.S. dollar while bolstering XauUsd.
Technicals:
From a technical standpoint, XAUUSD has been on a constant upward trajectory since March 25th, with only one red daily candle observed thus far.
Additionally, since April 1st, XAUUSD has achieved an all-time high each day, signaling a potential correction on the horizon.
Looking at resistance levels, we have encountered one significant resistance point indicated by yesterday’s intraday double top at 2365. On the downside, key support levels begin at 2330 and are further reinforced by the important zone around 2300.
Putting aside the fundamentals outlined earlier, in my personal opinion, I anticipate XAUUSD to correct by at least 500 pips this week, regardless of the outcome of the Consumer Price Index data.
I am inclined to sell in the event of a new all-time high.

XauUsd- New day, new ATH?So far, April has been the month for OANDA:XAUUSD , with the yellow metal setting a new all-time high each day. (Even on April 4th, despite a red day candle, we observed an all-time high on an intraday basis.)
Even though the upward move appears overextended and a strong correction seems imminent, there are no indications suggesting we are on the brink of it at this point.
From a technical standpoint, the structure remains strongly bullish, and as long as the 2330-2335 zone remains intact, even short-term charts maintain a strong bullish sentiment.
In conclusion, I anticipate another all-time high, and only a drop below 2320 would hint at a potential top forming, at least for the time being.
However, bulls should exercise caution with stop losses, as a correction in XAUUSD could potentially be deep and aggressive.

Eth established strong floor. Rise to 4k next?Like the entire crypto market, BITSTAMP:ETHUSD has initiated a much-needed correction since mid-March.
After an initial dive to the 3k zone, Ethereum recovered and made a local high at 3.6k. Subsequently, another drop occurred, but bulls held strong at the 3.2k zone, establishing a solid floor.
At the time of writing, the price is near 3.4k, and bulls appear to be in control. I anticipate a continuation to the upside, with a new test of the 4k resistance level.
I will maintain my bullish stance as long as the price remains above 3.2k in terms of daily closing.

KULR Technology Group Options Ahead of EarningsAnalyzing the options chain and the chart patterns of KULR Technology Group prior to the earnings report this week,
I would consider purchasing the 0.50usd strike price calls with
an expiration date of 2024-10-18,
for a premium of approximately $0.40.
If these options prove to be profitable prior to the earnings release, I would sell at least half of them.

LW Lamb Weston Holdings Options Ahead of EarningsIf you haven`t sold LW before the previous earnings:
Then analyzing the options chain and the chart patterns of LW Lamb Weston Holdings prior to the earnings report this week,
I would consider purchasing the 75usd strike price Puts with
an expiration date of 2024-10-18,
for a premium of approximately $0.75.
If these options prove to be profitable prior to the earnings release, I would sell at least half of them.

DAL Delta Air Lines Options Ahead of EarningsIf you haven`t bought the dip on DAL:
Then analyzing the options chain and the chart patterns of DAL Delta Air Lines prior to the earnings report this week,
I would consider purchasing the 46usd strike price Puts with
an expiration date of 2024-4-12,
for a premium of approximately $1.40.
If these options prove to be profitable prior to the earnings release, I would sell at least half of them.

XAUUSD: Will NFP Shift the Tide?In my post from yesterday, I mentioned the possibility of a correction for $OANDA:XAUUSD.
In a subsequent update, I emphasized that while such a correction was likely, traders should consider selling after a new spike above 2300.
Indeed, the price did spike above this level once more, only to drop by 400 pips afterward, precisely to the significant support at 2266.
Now, the question arises: Is the correction for Gold over?
The Non-Farm Payrolls (NFP) report could provide some clarity on this matter.
With the expectation that 200k new jobs will be added, we have two potential scenarios:
1. A NFP significantly better than expected could result in a break below the important 2266 support, in which case, the range of 2220-2225 would come into play.
2. Conversely, if the NFP meets or falls below expectations, we may see a continuation of the uptrend, pushing the price above 2300 and forming a strong support level at 2266.
From a technical perspective, there's currently nothing indicating a deviation from the medium-term bullish trend and bulls seem to have established a strong support level at 2266.
P.S: I'm out of the market at this moment, but, my gut feeling tells me an in line with expectation NFP and a continuation to the upside. I will update the idea after the announcement.
Regards!
Mihai Iacob

Gold- Profit taking could lead to correctionIn my post from yesterday, I pondered whether the bulls still possessed the strength to drive the price to the psychological level of 2300, and indeed, they did.
Following a brief intraday dip, precisely to the 2267 support level mentioned in yesterday's analysis, buyers swiftly regained control and, as anticipated, propelled the price to 2300.
However, at this point, I believe the ascent has become overextended, and a correction appears imminent.
From a technical standpoint, the recent upward movement has formed a rising wedge pattern (though it remains unconfirmed).
This, coupled with the high likelihood of profit-taking commencing, suggests a correction is likely, potentially bringing the price down once more to the 2250 zone.
Furthermore, in the event of a more aggressive correction, we may even witness the price dropping to the pattern's target of the 2220 zone.
In conclusion, I am considering selling.

Gold- Will it "see" 2.3k today?
Yesterday, after initially rising to 2277, the price began to correct. Following an initial drop to support, bulls regained control during the US session, closing the day with yet another all-time high for $OANDA:XAUUSD.
During the Asian session last night, once again, the initial drop was met with strong bids, leading to a quick price recovery. These occurrences signal significant buying power and suggest a high likelihood of an upward continuation.
From a technical standpoint, as long as the price remains above yesterday's low of 2250, bulls need not worry, and the strategy of buying dips should persist. Interim support is situated at 2277, followed by the important level of 2267.

Gold- Is the correction over?In my post from yesterday regarding OANDA:XAUUSD , I mentioned that while a correction is possible, it should be viewed as a buying opportunity to align with the overall bullish trend.
Indeed, after a brief consolidation and a test above 2260, Gold experienced a rapid drop to the 2230 zone.
However, it quickly reversed course and closed the day with a new all time high in terms of closing, at 2250
Interestingly, yesterday's intraday correction halted precisely at the previous all-time high and Friday's closing price.
This could be interpreted as a test of this resistance turning into new support.
In conclusion, as long as the 2230 zone remains intact, I am inclined to buy dips.

GbpUsd could drop to 1.23Since the beginning of December last year, FX:GBPUSD pair has been trading within a range bounded by 1.25 and 1.28.
In early March, the pair experienced a break above the upper range boundary. However, this break ultimately turned out to be false.
After returning to the familiar range, the pair formed a significant bearish engulfing pattern on March 21st. Following a few days of consolidation, it is currently trading back at support.
Considering that pairs tend to break on the opposite side after a false break, coupled with the significant bearish movement on March 21st, I anticipate the next move will be a break of support.
In conclusion, I am looking to sell rallies in anticipation of this break, with a target around 1.23.

Gold- Where to buy and join the ride?With March ending on a new all-time high at 2233, the first day of April brought about another surge of 300 pips, leading to the question: is it time to sell?
To be honest, there's no easy answer to this question.
Since last Monday, OANDA:XAUUSD has indeed risen by more than 1,000 pips, and a correction could occur at any time.
The main issue lies in determining where to place a stop. After all, who's to say it couldn't rise another 1,000 pips before correcting?
In my opinion, it's better to wait for a correction and then join the trend once it's over. A suitable entry point could be found between 2220 and 2200.
However, if you're determined to sell during this strong upward movement, it's advisable to wait for a reversal candle on the H4 chart(at least) to establish a suitable stop-loss level. Only then should you target the aforementioned zone.

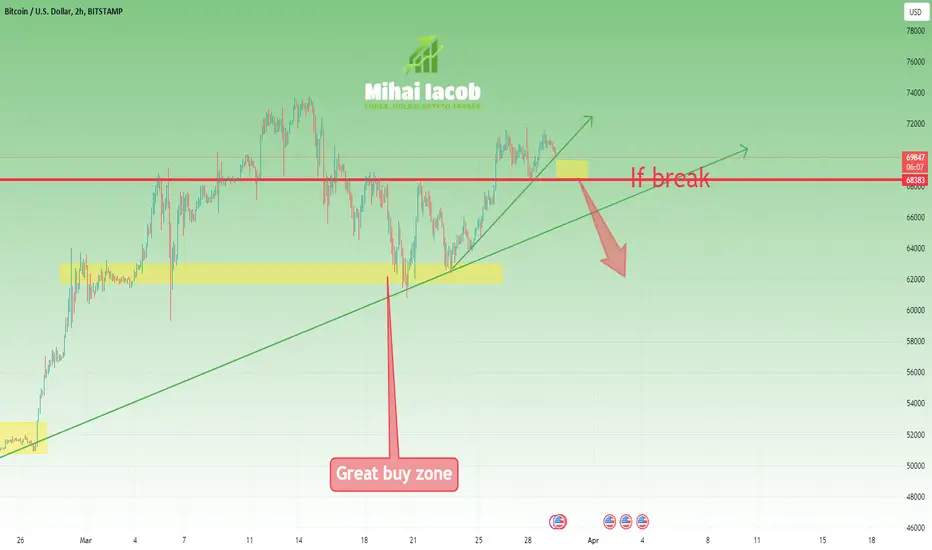
BTC- I'm still bullish but with some cautionIn my analysis of BITSTAMP:BTCUSD yesterday, I mentioned my expectation for a new all-time high from Bitcoin in the near future.
However, during yesterday's trading session, the price once again failed to surpass the 72k mark, raising some doubts about my outlook.
Firstly, after breaking above the 68k zone and retesting it, I anticipated a new local high. However, this didn't materialize.
Secondly, the rise from 62k wasn't as impulsive as one had wanted.
Considering these factors, while I remain bullish in the short term, I am closely monitoring the 68-70k zone.
If we break below 68k, we can expect a continuation of the downward move, possibly even testing the support zone at 62k again.
PAYX Paychex Options Ahead of EarningsIf you haven`t bought the dip on PAYX:
Then analyzing the options chain and the chart patterns of PAYX Paychex prior to the earnings report this week,
I would consider purchasing the 125usd strike price Calls with
an expiration date of 2024-4-19,
for a premium of approximately $2.72.
If these options prove to be profitable prior to the earnings release, I would sell at least half of them.

Gold- New ATH this month? Analysis and SpeculationsI've written many posts and made videos expressing my belief that XauUsd will reach a new all-time high (ATH) this year.
Now, the question is, will it start with all-time highs this month?
In my opinion, it will.
But let's begin with why I'm quite certain that Gold will reach an ATH this year. It's relatively straightforward when you examine the monthly chart.
You don't need to be a technical analyst to see that the trend is clearly upward.
We witnessed a major false break to the downside at the end of 2022, and since then, despite normal corrections, the price has consistently made higher lows.
The monthly candle that just started broke above the technical resistance from 2070.
Of course, anything is possible, but in my view, the chances of a long-term reversal are pretty low now. To clarify, I'm referring to a reversal in the long term, not just corrections.
Now, regarding the next all-time high this month, I'll speculate a bit.
Looking at the same monthly chart, the reversal from November 2022 had 1600 pips, representing a rise of 10%, the second reversal from March 2023 had 2000 pips, which represents 11%, and the third and last monthly reversal candle had 1900 pips, which is also 11%.
So, we can speculate that this month's candle will also rise by around 10%.
Calculating this at the current price, we have around 2000 pips. With the month starting at 2040, we reach 2240.
Moreover, if we consider that the reversal actually started at the bottom of last month's Pin Bar, which is at 1980, and add 2000 pips, we also arrive at 2180, which is also an ATH.
In conclusion, while I don't have a crystal ball, I expect an ATH this month.
However, more importantly, I WILL NOT SELL INTO THIS RALLY, ONLY BUY ON DIPS.
Best of luck!
Mihai Iacob

KSS Kohl's Corporation Options Ahead of EarningsAnalyzing the options chain and the chart patterns of KSS Kohl's Corporation prior to the earnings report this week,
I would consider purchasing the 27.50usd strike price Calls with
an expiration date of 2024-10-18,
for a premium of approximately $3.90.
If these options prove to be profitable prior to the earnings release, I would sell at least half of them.

RH Options Ahead of EarningsIf you haven`t sold the top on RH, for that fantastic 12.75X gain in the options chain:
nor bought the dip here:
Then analyzing the options chain and the chart patterns of RH prior to the earnings report this week,
I would consider purchasing the 310usd strike price in the money Puts with
an expiration date of 2024-3-28,
for a premium of approximately $21.85.
If these options prove to be profitable prior to the earnings release, I would sell at least half of them.
