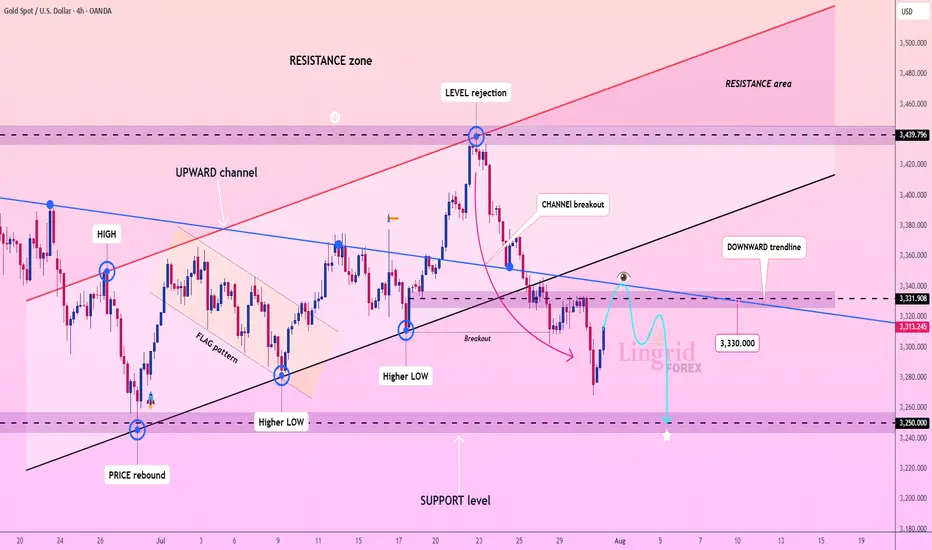
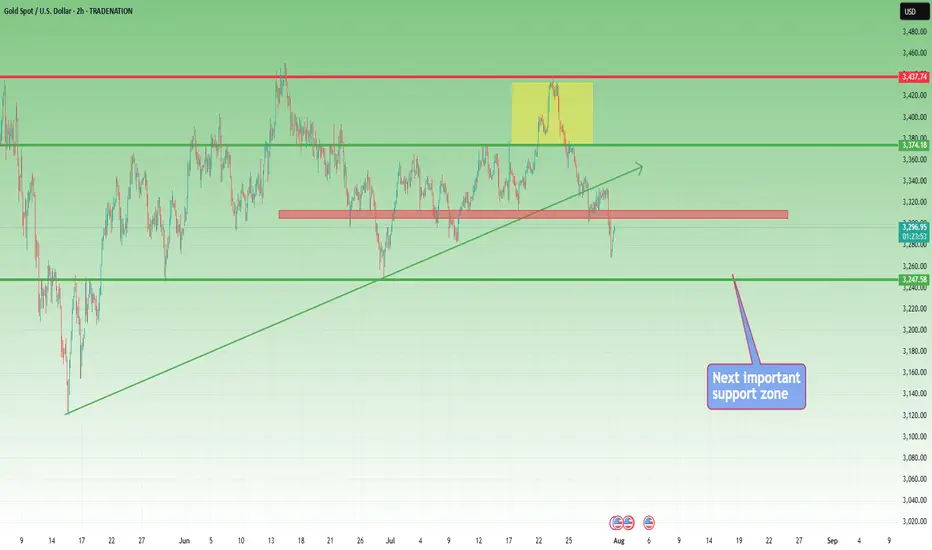
Lingrid | GOLD Possible Retest of the Major Support ZoneThe price perfectly fulfilled my previous idea . OANDA:XAUUSD is bouncing from recent lows but remains under pressure below the key resistance at 3,331.90 and the downward trendline. The prior rejection near 3,440 led to a steep selloff with a clean break below the upward channel. Current action shows a potential lower high forming near the broken trendline. A rejection there could send gold tumbling toward the 3,250.00 support zone.
📌 Key Levels
Sell trigger: Failure to reclaim 3,331.90
Sell zone: 3,330 – 3,340
Target: 3,250.00
Invalidation: Strong bullish breakout above 3,340 and descending trendline
💡 Risks
Bullish reversal breaking above downward trendline
Dovish Fed news boosting gold
Unexpected macroeconomic shocks increasing safe-haven demand
If this idea resonates with you or you have your own opinion, traders, hit the comments. I’m excited to read your thoughts!
Signals
Gold Rejected at 3315 – But Bulls Might Not Be Done Yet📌 What happened yesterday?
During the Asian session, Gold printed a fresh local low at 3268, continuing the downtrend that already dropped over 1700 pips in just one week. However, that move quickly reversed, and we saw a natural corrective bounce.
📈 Resistance holds firm
The correction took price back up into the 3310 zone, which acted as confluence resistance. After two taps into that area, price failed to sustain above 3300, indicating sellers are still active there.
❓ Is the upside correction over?
I don't think so. The recent drop has been choppy, lacking the strong momentum of previous legs. This type of price action often signals that we are still within a correction, not in a clean continuation.
📊 What am I watching?
I’m actively monitoring for:
• Exhaustion signs on the downside
• Upside reversal signals
My plan is to open long trades only when I see confirmation, aiming for a move back toward the 3330 zone, which could act as resistance.
Disclosure: I am part of TradeNation's Influencer program and receive a monthly fee for using their TradingView charts in my analyses and educational articles.

Lingrid | AUDCAD Swap Zone. Potential Selling OpportunityThe price perfectly fulfilled my last idea . FX:AUDCAD is rebounding from a strong support area after a fake break below 0.88805 and is now moving toward the descending trendline. The price is expected to test the swap zone near 0.89421, where prior support may flip to resistance. This setup favors a SELL scenario from the lower high structure within the flag and downtrend. A rejection from the trendline could resume the bearish continuation back toward support.
📌 Key Levels
Sell zone: 0.89421 – 0.89500
Buy zone: 0.88805 – 0.88600
Target: 0.88805
Invalidation: Break and close above 0.89550
💡 Risks
Bullish breakout through the descending trendline
Sharp reversal from macroeconomic news
Short-term consolidation above 0.89100 weakening momentum
If this idea resonates with you or you have your own opinion, traders, hit the comments. I’m excited to read your thoughts!

Correction Ahead? SP500 Prints Reversal Signal at Key Resistance📘 This market moves like a textbook chart
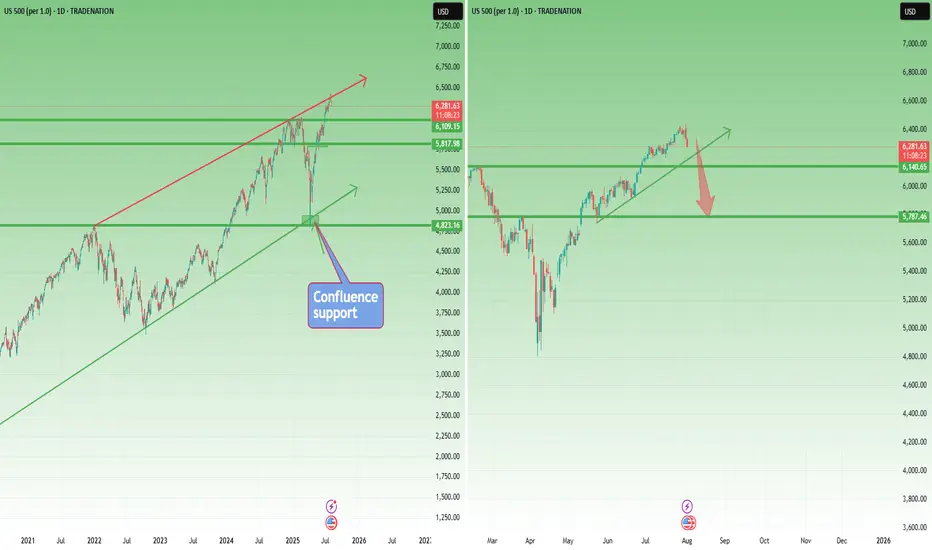
SP500 is acting like a perfect case study from a trading manual. Back in early April, the index dipped just below 5,000, right into a confluence support zone ( I had spoken about this at the time ) – formed by the long-term ascending trendline and the 2022 all-time high. Just like other U.S. indices, the market reversed aggressively from that area.
🚀 A 30% rally in 4 months
From that low, SP500 rallied around 30% in just four months. An incredible move that brought the index straight to the upper boundary of the yearly rising channel.
🕯️ Bearish signal at the top
And just like in NAS100’s case , the index printed a strong Bearish Engulfing candle exactly at that resistance level. This kind of signal, after such a rise, shouldn’t be ignored.
📉 A correction is not only probable – it’s needed
A pullback from here is not just likely, but in my opinion, healthy and necessary . Short-term speculators could look for a move toward the 6,150 zone, which would already offer decent room for profit.
🔍 What if it goes deeper?
I wouldn’t be surprised to see a correction down to 5,750–5,800. That’s about a 10% decline, which wouldn't even classify as a bear market, just a normal reset after a euphoric rally.
🧠 Perspective matters
In a market that gained 30% in four months, a 10% correction is not a crash — it’s discipline being restored.
Disclosure: I am part of TradeNation's Influencer program and receive a monthly fee for using their TradingView charts in my analyses and educational articles.
USOIL Is Bearish! Short!
Please, check our technical outlook for USOIL.
Time Frame: 9h
Current Trend: Bearish
Sentiment: Overbought (based on 7-period RSI)
Forecast: Bearish
The market is approaching a significant resistance area 69.178.
Due to the fact that we see a positive bearish reaction from the underlined area, I strongly believe that sellers will manage to push the price all the way down to 66.684 level.
P.S
The term oversold refers to a condition where an asset has traded lower in price and has the potential for a price bounce.
Overbought refers to market scenarios where the instrument is traded considerably higher than its fair value. Overvaluation is caused by market sentiments when there is positive news.
Disclosure: I am part of Trade Nation's Influencer program and receive a monthly fee for using their TradingView charts in my analysis.
Like and subscribe and comment my ideas if you enjoy them!

Top in Place? NASDAQ100 Signals Exhaustion After Incredible Run📈 The crazy run since April
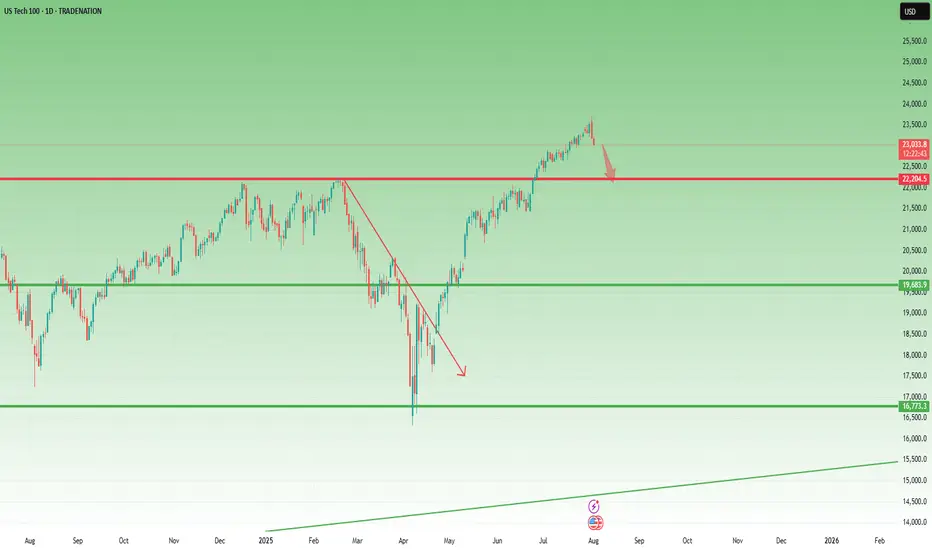
NASDAQ100 has had a spectacular run since early April, when the index dipped to 16,300 amid rising tensions caused by Trump’s tax war. From that low, we’ve seen a mind-blowing rally of over 7,000 points, which translates to a 40% gain in just 4 months.
Such a rise is not just impressive— it’s overextended , especially by historical standards. Markets don’t move in straight lines forever, and this one might be showing signs of fatigue.
🕯️ Bearish signal at the top
Fast forward to this week: yesterday, the index marked a new all-time high at 23,700, but closed the day with a strong bearish engulfing candle — one that wipes out the gains of the previous 4 trading sessions.
This is not a small technical detail. Such candles, when appearing after an extended rally, often signal exhaustion and a potential shift in momentum.
❗ Top in place?
In my opinion, there's a high probability that a top has been set, at least temporarily. We might be looking at the beginning of a healthy correction, or even something more meaningful, depending on follow-through in the next sessions.
📉 Where to next?
The first major support to watch is the 22,200 level.
I expect that zone to be tested soon — and honestly, considering how much the index has gone up, this shouldn’t surprise anyone. It’s nothing more than a minor pullback, all things considered.
🧠 Stay smart!
When markets go vertical, it pays to stay disciplined and realistic. Tops rarely announce themselves, but when signals like this appear, it’s wise to listen.
Disclosure: I am part of TradeNation's Influencer program and receive a monthly fee for using their TradingView charts in my analyses and educational articles.
EUR_USD POTENTIAL SHORT|
✅EUR_USD has been growing recently
And the pair seems locally overbought
So as the pair is approaching
A horizontal resistance of 1.1632
Price decline is to be expected
SHORT🔥
✅Like and subscribe to never miss a new idea!✅
Disclosure: I am part of Trade Nation's Influencer program and receive a monthly fee for using their TradingView charts in my analysis.

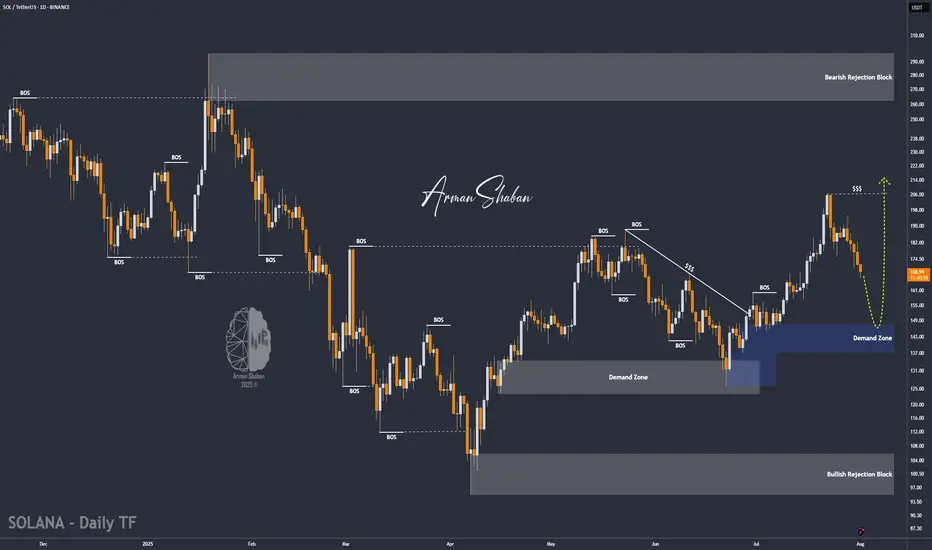
SOL/USDT | NFP Volatility Could Trigger Drop Toward $154!By analyzing the Solana chart on the daily timeframe, we can see that the price is currently trading around $169. If it fails to hold above the $168 level, a deeper drop could follow. With the upcoming NFP data release, increased volatility is expected across the markets. If Solana begins to decline, the potential correction targets are $163, $157, and $154. Watch the $145–$154 zone closely for a possible bullish reaction and buy opportunity.
Please support me with your likes and comments to motivate me to share more analysis with you and share your opinion about the possible trend of this chart with me !
Best Regards , Arman Shaban
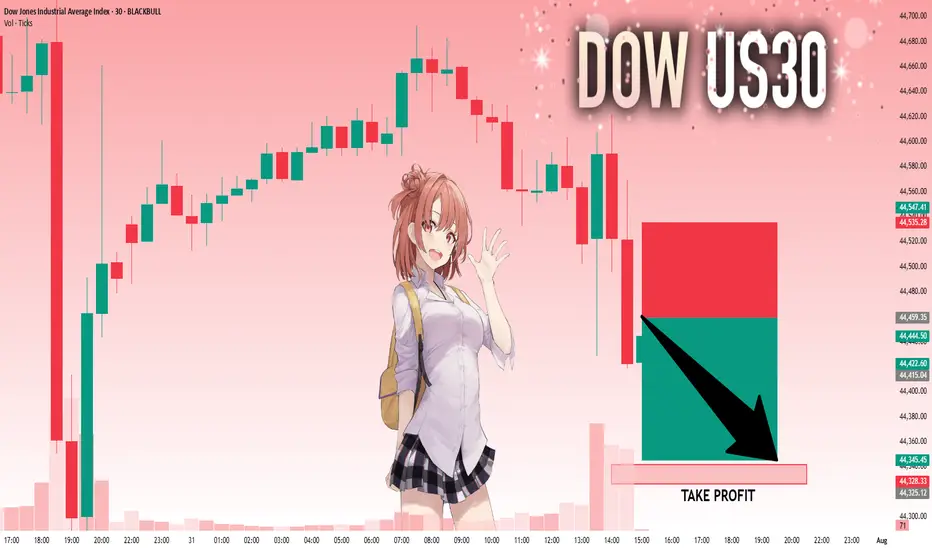
US30: Absolute Price Collapse Ahead! Short!
My dear friends,
Today we will analyse US30 together☺️
The in-trend continuation seems likely as the current long-term trend appears to be strong, and price is holding below a key level of 44,459.35 So a bearish continuation seems plausible, targeting the next low. We should enter on confirmation, and place a stop-loss beyond the recent swing level.
❤️Sending you lots of Love and Hugs❤️
XAUUSD Update – Down Continuation to 3250?1. What Happened Yesterday
After an anemic correction that formed a bearish flag, Gold finally broke below 3300 and even dipped under the 3280 support zone — which was my primary downside target. While the move during the day didn’t have enough momentum to reach my second sell limit, I was already in a low-volume short position, so I didn’t miss the move entirely.
2. The Key Question
Has the drop ended, or are we looking at further downside?
3. Why I Expect More Downside
• The overall structure remains bearish.
• The newly formed resistance (previous support) is now the new sell zone.
• If the price drops towards 3280 again, continuation to 3250 becomes very probable.
4. Trading Plan
Selling rallies remains the preferred strategy, especially on spikes into resistance. As long as the price stays below 3335-3340 zone, the bearish outlook remains intact.
5. Conclusion
Sell the rallies. The technical picture still favors downside continuation — no need to overcomplicate it. 🚀
Disclosure: I am part of TradeNation's Influencer program and receive a monthly fee for using their TradingView charts in my analyses and educational articles.
GBPUSD Is Going Up! Buy!
Take a look at our analysis for GBPUSD.
Time Frame: 1D
Current Trend: Bullish
Sentiment: Oversold (based on 7-period RSI)
Forecast: Bullish
The price is testing a key support 1.319.
Current market trend & oversold RSI makes me think that buyers will push the price. I will anticipate a bullish movement at least to 1.345 level.
P.S
Overbought describes a period of time where there has been a significant and consistent upward move in price over a period of time without much pullback.
Disclosure: I am part of Trade Nation's Influencer program and receive a monthly fee for using their TradingView charts in my analysis.
Like and subscribe and comment my ideas if you enjoy them!

EURUSD: Move Down Expected! Short!
My dear friends,
Today we will analyse EURUSD together☺️
The price is near a wide key level
and the pair is approaching a significant decision level of 1.15337 Therefore, a strong bullish reaction here could determine the next move up.We will watch for a confirmation candle, and then target the next key level of 1.15208.Recommend Stop-loss is beyond the current level.
❤️Sending you lots of Love and Hugs❤️

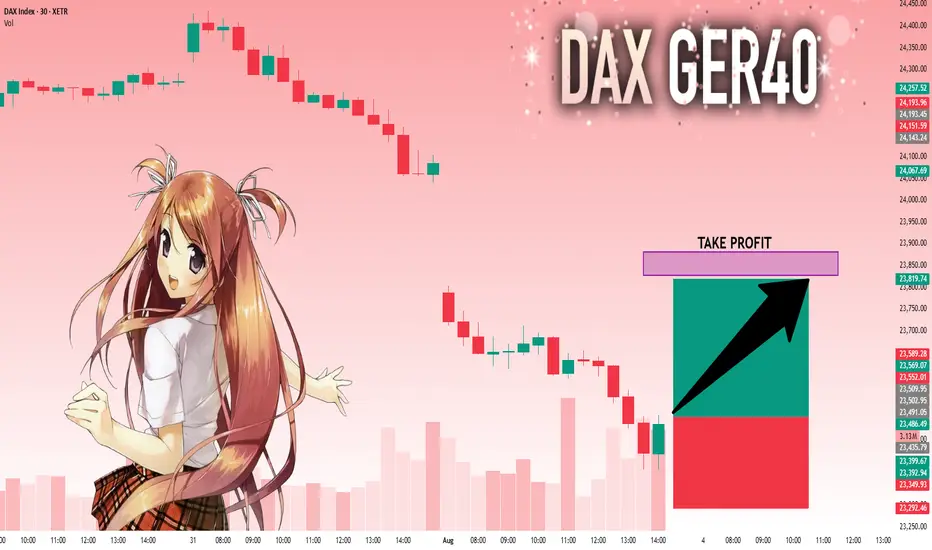
DAX: Next Move Is Up! Long!
My dear friends,
Today we will analyse DAX together☺️
The in-trend continuation seems likely as the current long-term trend appears to be strong, and price is holding above a key level of 23,502.95 So a bullish continuation seems plausible, targeting the next high. We should enter on confirmation, and place a stop-loss beyond the recent swing level.
❤️Sending you lots of Love and Hugs❤️
Lingrid | TONUSDT Potential Long From the KEY ZoneThe price perfectly fulfilled my last idea . OKX:TONUSDT is pulling back from a fake breakout above 3.590 but holding within the boundaries of an upward channel. The price is approaching strong confluence support near 3.250, where both the trendline and horizontal zone align. A rebound from this level could launch a new bullish leg toward the resistance zone. Buyers will look for confirmation at the bounce area to aim for 3.590 and beyond.
📌 Key Levels
Buy zone: 3.250 – 3.300
Sell trigger: Break below 3.250
Target: 3.590 – 3.700
Buy trigger: Bullish engulfing or breakout from local consolidation near 3.300
💡 Risks
Loss of support at 3.250 trendline
Bearish pressure from broader market sentiment
Another fakeout or choppy move around 3.300–3.400 zone
If this idea resonates with you or you have your own opinion, traders, hit the comments. I’m excited to read your thoughts!

GOLD: Short Trading Opportunity
GOLD
- Classic bearish formation
- Our team expects fall
SUGGESTED TRADE:
Swing Trade
Sell GOLD
Entry Level - 3299.9
Sl - 3304.2
Tp - 3291.3
Our Risk - 1%
Start protection of your profits from lower levels
Disclosure: I am part of Trade Nation's Influencer program and receive a monthly fee for using their TradingView charts in my analysis.
❤️ Please, support our work with like & comment! ❤️

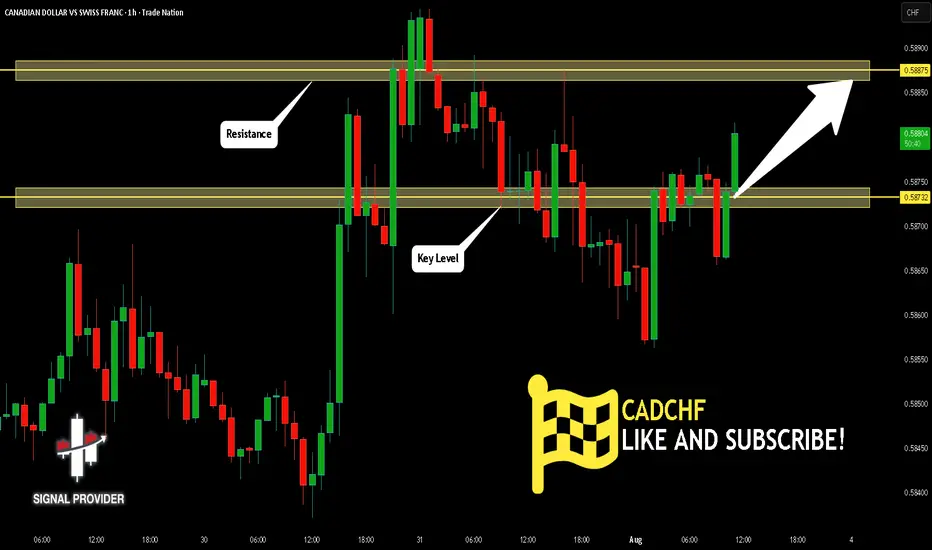
CADCHF Will Grow! Long!
Please, check our technical outlook for CADCHF.
Time Frame: 1h
Current Trend: Bullish
Sentiment: Oversold (based on 7-period RSI)
Forecast: Bullish
The market is trading around a solid horizontal structure 0.587.
The above observations make me that the market will inevitably achieve 0.588 level.
P.S
Please, note that an oversold/overbought condition can last for a long time, and therefore being oversold/overbought doesn't mean a price rally will come soon, or at all.
Disclosure: I am part of Trade Nation's Influencer program and receive a monthly fee for using their TradingView charts in my analysis.
Like and subscribe and comment my ideas if you enjoy them!
BITCOIN Will Go Lower! Sell!
Please, check our technical outlook for BITCOIN.
Time Frame: 9h
Current Trend: Bearish
Sentiment: Overbought (based on 7-period RSI)
Forecast: Bearish
The market is trading around a solid horizontal structure 113,260.21.
The above observations make me that the market will inevitably achieve 107,826.27 level.
P.S
We determine oversold/overbought condition with RSI indicator.
When it drops below 30 - the market is considered to be oversold.
When it bounces above 70 - the market is considered to be overbought.
Disclosure: I am part of Trade Nation's Influencer program and receive a monthly fee for using their TradingView charts in my analysis.
Like and subscribe and comment my ideas if you enjoy them!

GOLD Short From Resistance! Sell!
Hello, Traders!
GOLD surged up sharply
On Friday and is already
Retesting the horizontal
Resistance of 3377$
From where we will be
Expecting a local pullback
On Monday as Gold
Is locally overbought
Sell!
Comment and subscribe to help us grow!
Check out other forecasts below too!
Disclosure: I am part of Trade Nation's Influencer program and receive a monthly fee for using their TradingView charts in my analysis.

GBP-JPY Risky Long! Buy!
Hello,Traders!
GBP-JPY collapsed on Friday
And the pair's final move
Was absorbed by the horizontal
Support of 195.400 so as the
Pair is oversold we will be
Expecting a local rebound
And a correction on Monday
Buy!
Comment and subscribe to help us grow!
Check out other forecasts below too!
Disclosure: I am part of Trade Nation's Influencer program and receive a monthly fee for using their TradingView charts in my analysis.

GBP_NZD BEARISH BIAS|SHORT|
✅GBP_NZD has retested
A resistance level of 2.2500
And we are seeing a bearish reaction
With the price going down so we are
Bearish biased now and we will be
Expecting the pair to go further down
SHORT🔥
✅Like and subscribe to never miss a new idea!✅
Disclosure: I am part of Trade Nation's Influencer program and receive a monthly fee for using their TradingView charts in my analysis.

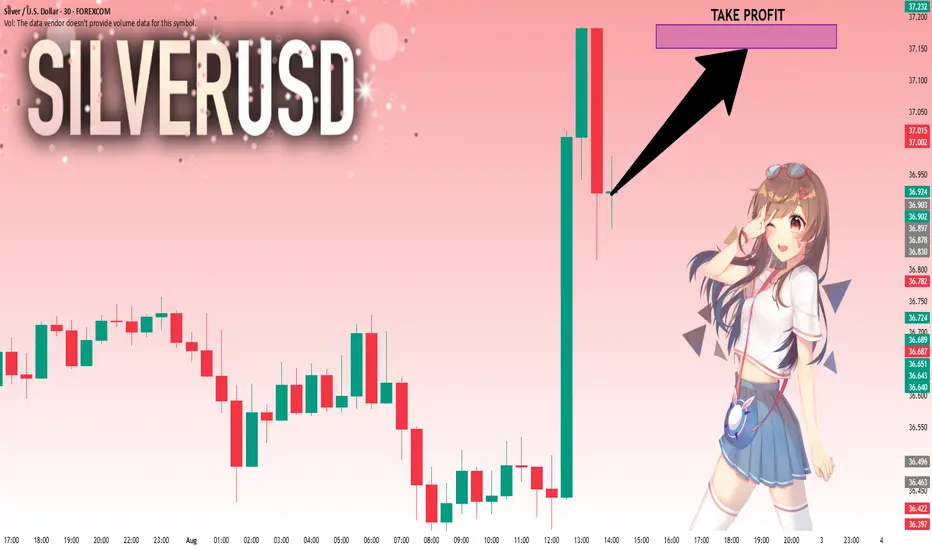
SILVER: Local Bullish Bias! Long!
My dear friends,
Today we will analyse SILVER together☺️
The recent price action suggests a shift in mid-term momentum. A break above the current local range around 36.920 will confirm the new direction upwards with the target being the next key level of 37.150 and a reconvened placement of a stop-loss beyond the range.
❤️Sending you lots of Love and Hugs❤️
XAUUSD Gold Trading Strategy August 1, 2025
Yesterday's trading session, gold prices recovered to the 3315 area and then continued to decrease to the 3281 area. Currently, gold prices are fluctuating quite unpredictably due to the impact of tariff news and investor confidence.
Basic news: The Federal Reserve FED continues to maintain the federal funds benchmark interest rate in the range of 4.25% - 4.50%, in line with policy since 2025. Chairman Powell did not give any signal about the next interest rate cut on September 16 - 17.
Technical analysis: After falling sharply to the 3269 area, gold prices are showing signs of recovery. In the current downtrend channel, there has been a higher bottom than the bottom at H1. We can see that if the bullish pattern at H1 is confirmed, combined with the reversal candlestick appearing at H4, the possibility of gold bouncing back to reach the resistance area of 3330, even 3350 is completely possible. In the weekend trading session, we will wait at the support zones to trade.
Important price zones today: 3280 - 3285 and 3269 - 3274.
Today's trading trend: BUY.
Recommended orders:
Plan 1: BUY XAUUSD zone 3283 - 3285
SL 3280
TP 3288 - 3300 - 3310 - 3330.
Plan 2: BUY XAUSD zone 3269 - 3271
SL 3266
TP 3274 - 3284 - 3300 - 3320.
Wish you a safe, favorable and profitable trading day.🥰🥰🥰🥰🥰

NZD-JPY Local Long! Buy!
Hello,Traders!
NZD-JPY is retsting a
Strong horizontal support
Level around 87.044 and
As the pair is locally
Oversold we will be expecting
A local rebound and a move
Up on Monday!
Buy!
Comment and subscribe to help us grow!
Check out other forecasts below too!
Disclosure: I am part of Trade Nation's Influencer program and receive a monthly fee for using their TradingView charts in my analysis.
