Lingrid | USDJPY Possible Strong Bullish RallyThe price perfectly fulfilled my previous idea . FX:USDJPY is trading within an upward channel after forming a higher low near the 147.50 zone, bouncing from the support trendline. Price action suggests a bullish structure continuation toward the 150.95 resistance, especially if the recent consolidation breaks higher. The overall formation aligns with a healthy correction phase before a potential push into the resistance area. Confirmation above 148.60 would likely accelerate the bullish move.
📌 Key Levels Buy zone: 147.50–147.25
Sell trigger: Below 147.00
Target: 150.95
Buy trigger: Break above 148.80
⚠️ Risks
Break below 147.50 may shift sentiment bearish
Strong resistance awaits near 150.00
Broader market volatility could invalidate pattern
If this idea resonates with you or you have your own opinion, traders, hit the comments. I’m excited to read your thoughts!
Signals

GOLD: Short Trading Opportunity
GOLD
- Classic bearish formation
- Our team expects fall
SUGGESTED TRADE:
Swing Trade
Sell GOLD
Entry Level - 3299.9
Sl - 3304.2
Tp - 3291.3
Our Risk - 1%
Start protection of your profits from lower levels
Disclosure: I am part of Trade Nation's Influencer program and receive a monthly fee for using their TradingView charts in my analysis.
❤️ Please, support our work with like & comment! ❤️

Lingrid | USDCHF Potential Bullish Move Following Level BreakoutFX:USDCHF surged from a higher low and is now retesting the broken structure near 0.802, maintaining its position within the broader upward channel. A clean bounce from this zone would confirm the bullish structure, targeting the upper channel resistance near 0.815. Pullback and higher low structure support continued upside movement with short-term consolidation possible. A breakout from the consolidation box could accelerate momentum toward the resistance area.
📈 Key Levels
Buy zone: 0.802 – 0.805
Buy trigger: Bullish confirmation above 0.805
Target: 0.815
Invalidation: Drop below 0.796
💡 Risks
False breakout near 0.805 may lead to rejection
Failure to form higher high would invalidate bullish sequence
Momentum divergence could slow rally near resistance
If this idea resonates with you or you have your own opinion, traders, hit the comments. I’m excited to read your thoughts!

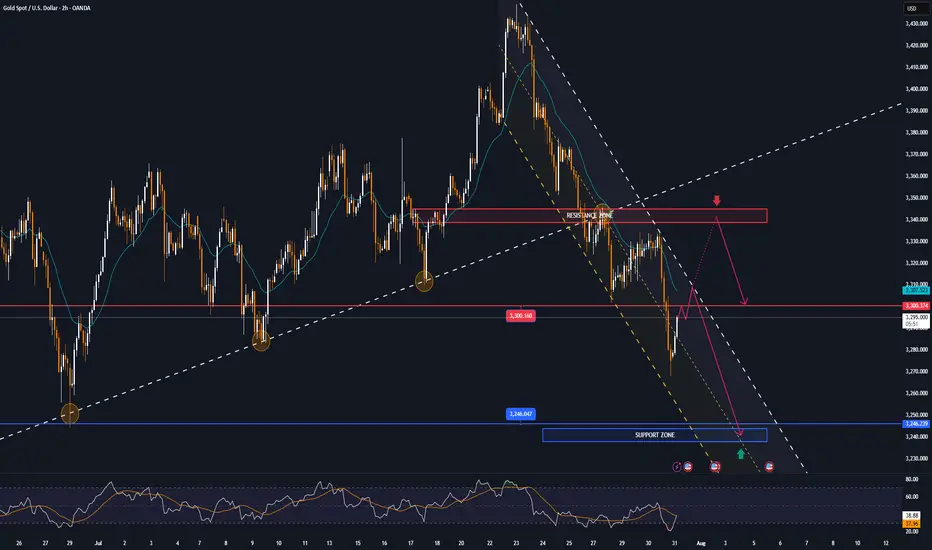
GOLD falls sharply, fundamental analysis and technical positionOANDA:XAUUSD fell sharply below the $3,300/oz price level as Chairman Jerome Powell did not signal any rate cuts at his next press conference on September 16-17. He only said that “no decision has been made on September” and that “more data will be evaluated in the coming months.” Economic data undermined the case for a rate cut, while geopolitical play remained a potential support.
The Fed and Interest Rates
The Federal Reserve kept interest rates unchanged for a fifth straight meeting on Wednesday, defying persistent pressure from President Donald Trump and White House officials.
However, two members of the central bank's board dissented, a rare move in three decades that underscored growing divisions within the central bank over the impact of Trump's tariff policies.
At the meeting, the Fed kept its benchmark federal funds rate in a range of 4.25% to 4.5%, in line with policy through 2025. Last fall, the Fed cut rates by a total of 100 basis points.
However, Federal Reserve Board Governors Christopher Waller and Michelle Bowman opposed cutting interest rates by another 25 basis points, marking the first time since Alan Greenspan in 1993 that two board members have opposed a majority resolution at a meeting.
At the press conference, Chairman Jerome Powell did not signal a rate cut at the next interest rate meeting on September 16-17, saying only that “no decision has been made about September” and that “more data will be evaluated in the coming months.” Powell also noted that despite Trump’s call for a sharp 3% rate cut to reduce interest costs on US debt and stimulate the housing market, the Fed will continue to monitor the longer-term impact of tariffs on the path of inflation and economic recovery.
Market expectations for a Fed rate cut in September fell to 47% in Powell's speech.
Economic data
ADP jobs data beats expectations and is bearish
US ADP payrolls jumped 104,000 in July, beating market expectations of 75,000 and marking the biggest gain since March. The data showed continued strength in the labor market, reinforcing the Federal Reserve’s stance on keeping interest rates high. Meanwhile, the preliminary estimate of annual GDP growth in the second quarter came in at 3% (2.4% expected), and the core personal consumption expenditures price index rose 2.5% year-on-year (2.3% expected), indicating both economic resilience and inflation stability, further weakening expectations for a rate cut.
Keep an eye on the ISM manufacturing PMI and non-farm payrolls data on August 1. If the jobs numbers continue to be strong, this could reinforce the Fed’s dovish stance.
Geopolitical and Policy Plays
News of a 90-day extension of the US-China tariff deal has eased some safe-haven demand, but Trump’s August 8 deadline for a new Russia-Ukraine deal, coupled with tensions in the Middle East, continue to provide potential support for gold.
Continued purchases by central banks (such as China and India) are a positive signal in the medium to long term, but are unlikely to offset short-term pressure from the Federal Reserve’s policies.
Technical outlook for OANDA:XAUUSD
On the daily chart, gold has been sold below the $3,300 level and now the $3,300 level has become the nearest resistance at present. For now, gold will be limited by the area of the 0.382% Fibonacci retracement with the original price point of $3,300, along with that it has formed a short-term downtrend with the price channel, the next target will be around $3,246 in the short term followed by the Fibonacci retracement level noted with readers in previous publications.
On the momentum front, the Relative Strength Index is operating below 50 and is far from the oversold zone (20-0), indicating that there is still plenty of room for downside ahead.
In addition, the gold trend will also be pressured by the EMA21, as long as gold remains below the EMA21, the current technical conditions continue to favor the downside.
For the day, the technical outlook for gold is bearish with notable positions listed as follows.
Support: 3,246 – 3,228 USD
Resistance: 3,300 USD
SELL XAUUSD PRICE 3345 - 3343⚡️
↠↠ Stop Loss 3349
→Take Profit 1 3337
↨
→Take Profit 2 3331
BUY XAUUSD PRICE 3240 - 3242⚡️
↠↠ Stop Loss 3236
→Take Profit 1 3248
↨
→Take Profit 2 3254
XAUUSD Gold Trading Strategy August 1, 2025
Yesterday's trading session, gold prices recovered to the 3315 area and then continued to decrease to the 3281 area. Currently, gold prices are fluctuating quite unpredictably due to the impact of tariff news and investor confidence.
Basic news: The Federal Reserve FED continues to maintain the federal funds benchmark interest rate in the range of 4.25% - 4.50%, in line with policy since 2025. Chairman Powell did not give any signal about the next interest rate cut on September 16 - 17.
Technical analysis: After falling sharply to the 3269 area, gold prices are showing signs of recovery. In the current downtrend channel, there has been a higher bottom than the bottom at H1. We can see that if the bullish pattern at H1 is confirmed, combined with the reversal candlestick appearing at H4, the possibility of gold bouncing back to reach the resistance area of 3330, even 3350 is completely possible. In the weekend trading session, we will wait at the support zones to trade.
Important price zones today: 3280 - 3285 and 3269 - 3274.
Today's trading trend: BUY.
Recommended orders:
Plan 1: BUY XAUUSD zone 3283 - 3285
SL 3280
TP 3288 - 3300 - 3310 - 3330.
Plan 2: BUY XAUSD zone 3269 - 3271
SL 3266
TP 3274 - 3284 - 3300 - 3320.
Wish you a safe, favorable and profitable trading day.🥰🥰🥰🥰🥰

GOLD - Monthly breakout retest may confirm multi-year bull cycleHello everyone, what are your thoughts on the long-term outlook for XAUUSD?
Looking at the monthly chart (1M), we can clearly see that XAUUSD has broken out of the long-standing ascending channel that has held since 2015 — a major signal suggesting the start of a new bullish cycle. Price is now retesting the previously broken trendline, hinting at the possibility of a fresh upward leg to resume the longer-term bullish trend we've seen recently.
Personally, I'm targeting $3,600 in the medium term, and potentially $4,000 by 2026–2028 if institutional capital continues to rotate back into safe-haven assets like gold.
What about you — do you think BTC/USD will rise or fall in the coming years?
And what’s your target for it?

Gold on the edge: Will 3,270 break as Fed pressure builds?Hello traders, what’s your view on XAUUSD?
Yesterday, gold remained under pressure as a series of fresh U.S. economic data reinforced expectations that the Federal Reserve will keep interest rates higher for longer. As a result, U.S. Treasury yields surged, the dollar strengthened, and gold came under renewed selling pressure. Currently, XAUUSD is trading around 3,288 USD, down 0.04% on the day.
From a technical standpoint, gold is clearly trading within a well-defined downward-sloping channel, confirming the dominance of bearish momentum. Moreover, both the EMA34 and EMA89 are acting as dynamic resistance levels, repeatedly rejecting any short-term recovery attempts—highlighting the strength of the current downtrend.
If a pullback occurs before the next leg lower, the confluence of resistance and the EMA zone will be crucial to watch. It could offer ideal conditions for potential short setups in line with the trend.
Looking ahead, the next key support lies at 3,270 USD. A break below this level could open the door for a deeper move toward the 32XX area.
What do you think? Will gold continue to drop further?
Good luck and trade safe!

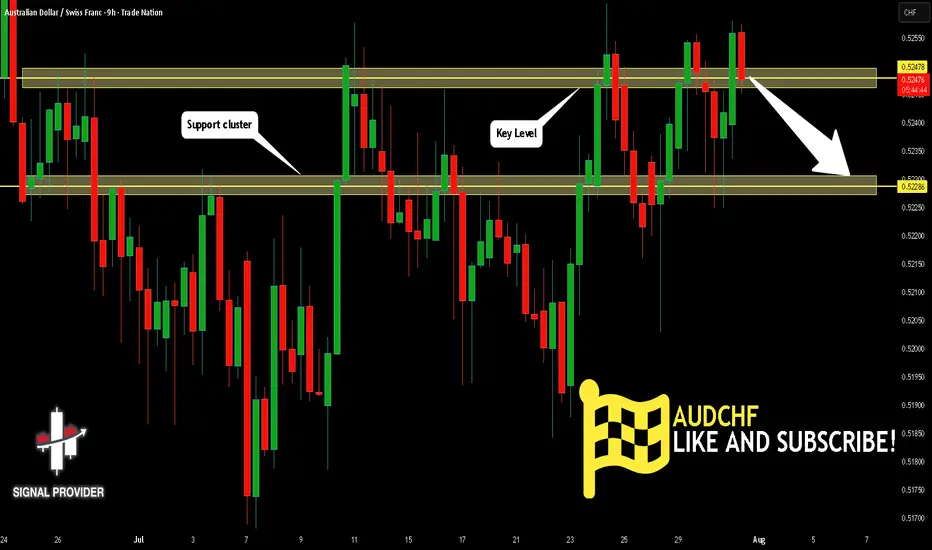
AUDCHF Will Go Down! Short!
Here is our detailed technical review for AUDCHF.
Time Frame: 9h
Current Trend: Bearish
Sentiment: Overbought (based on 7-period RSI)
Forecast: Bearish
The market is on a crucial zone of supply 0.524.
The above-mentioned technicals clearly indicate the dominance of sellers on the market. I recommend shorting the instrument, aiming at 0.522 level.
P.S
Please, note that an oversold/overbought condition can last for a long time, and therefore being oversold/overbought doesn't mean a price rally will come soon, or at all.
Disclosure: I am part of Trade Nation's Influencer program and receive a monthly fee for using their TradingView charts in my analysis.
Like and subscribe and comment my ideas if you enjoy them!
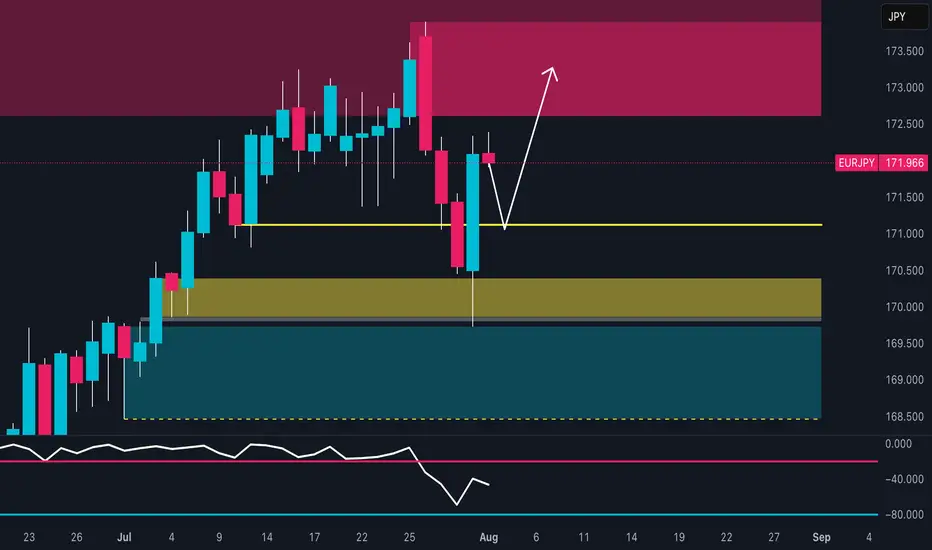
EUR/JPY Setup: Retail is 82% Short – Squeeze First, Drop After?🔹 Technical Context
Price reacted with a strong bullish wick in the 169.50–170.30 demand zone, signaling clear buyer defense. The RSI bounced from weakness but remains subdued, showing limited momentum.
📍 Current price action suggests a potential retest of the 172.50–173.30 area, which aligns with a supply zone, before a possible directional decision is made.
🗓️ Seasonality
Historically, August tends to be bearish for EUR/JPY:
5Y average: -0.48%
10Y average: -0.12%
15Y/20Y averages: -1.3% and -1.2%
📉 Seasonality indicates potential weakness, especially in the second half of the month.
🪙 COT Report (EURO & YEN) – July 22
EURO: Strong long accumulation by non-commercials (+6,284) and commercials (+17,575)
JPY: Net decline in both longs (-1,033) and shorts (-4,096), with a drop in total open interest
🧠 The market is heavily positioned on the Euro, while Yen positioning is fading. This creates a divergence between the two currencies, favoring a short-term technical bounce on EUR/JPY, though downside risks remain in the mid-term.
📉 Sentiment
82% of retail traders are short EUR/JPY
Volume: 1,564 lots short vs 352 lots long
📣 This extreme sentiment imbalance suggests a potential short-term squeeze against retail traders.
📊 Market Mood & DPO
Overall mood: Neutral
DPO at -9.0, Wyckoff score below 50
Momentum remains weak, but not showing a clear divergence.
🧩 Operational Summary
Retest of the 172.50–173.30 supply zone
Likely exhaustion in that area
Ideal setup: rejection + bearish confirmation
→ Targets: 170.30, then 169.00
USDJPY breaks out as US data crushes forecastsHello traders! Do you think USDJPY will continue its upward momentum?
From a technical perspective, after several sessions of "building pressure," this pair has finally broken through a key resistance zone—opening the door to what could be the next bullish breakout.
Current price action suggests the uptrend remains firmly intact. The market continues to respect the rising trendline and finds strong support near the 34 & 89 EMA – a powerful technical combination that buyers often rely on. This isn’t just a typical breakout; it could be the start of a brand-new bullish cycle.
On the fundamental side, the U.S. dollar remains strong, supported by a string of solid economic data: employment, PCE, and consumer spending have all exceeded expectations. Meanwhile, the Japanese yen remains in “hibernation” as the Bank of Japan shows no sign of shifting away from its ultra-loose monetary policy. This divergence makes USDJPY one of the hottest pairs on the radar right now.
What’s next? If bullish momentum continues, the 151.25 level is likely the next short-term target. However, if the price encounters strong resistance at that level, a minor pullback could occur before the uptrend resumes.
So, what do you think? Is this the beginning of a major rally – or just a false breakout? Share your thoughts in the comments!
Wishing you successful and well-timed trades ahead!

GOLD Local Short! Sell!
Hello,Traders!
GOLD made a retest
Of the horizontal resistance
Of 3313$ and we are already
Seeing a bearish reaction and
We will be expecting a further
Bearish move down
Sell!
Comment and subscribe to help us grow!
Check out other forecasts below too!
Disclosure: I am part of Trade Nation's Influencer program and receive a monthly fee for using their TradingView charts in my analysis.

CHF_JPY LOCAL SHORT|
✅CHF_JPY has been growing recently
And the pair seems locally overbought
So as the pair is approaching a
Horizontal resistance of 186.000
Price decline is to be expected
SHORT🔥
✅Like and subscribe to never miss a new idea!✅
Disclosure: I am part of Trade Nation's Influencer program and receive a monthly fee for using their TradingView charts in my analysis.

USD_JPY RESISTANCE AHEAD|SHORT|
✅USD_JPY is going up now
But a strong resistance level is ahead at 151.232
Thus I am expecting a pullback
And a move down towards the target of 150.368
SHORT🔥
✅Like and subscribe to never miss a new idea!✅
Disclosure: I am part of Trade Nation's Influencer program and receive a monthly fee for using their TradingView charts in my analysis.

EUR_CHF WILL KEEP FALLING|SHORT|
✅EUR_CHF broke the key
Structure level of 0.9295
While trading in an local downtrend
Which makes me bearish
And I think that after the retest of the
Broken level is complete
A rebound and bearish
Continuation will follow
SHORT🔥
✅Like and subscribe to never miss a new idea!✅
Disclosure: I am part of Trade Nation's Influencer program and receive a monthly fee for using their TradingView charts in my analysis.

EUR-USD Bearish Breakout! Sell!
Hello,Traders!
EUR-USD made a bearish
Breakout of the key horizontal
Level of 1.1460 then made
A retest and a pullback so
We are bearish biased and
We will be expecting a
Further bearish continuation
Sell!
Comment and subscribe to help us grow!
Check out other forecasts below too!
Disclosure: I am part of Trade Nation's Influencer program and receive a monthly fee for using their TradingView charts in my analysis.

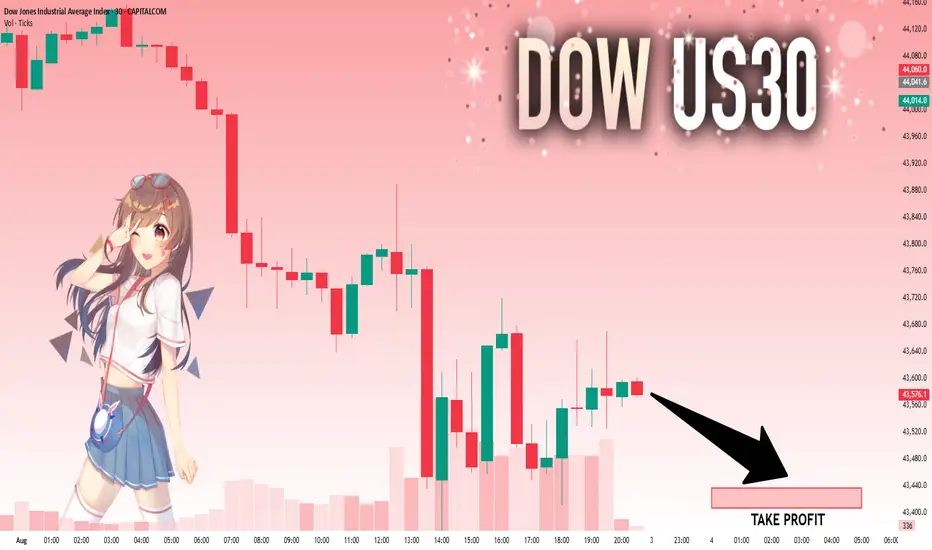
US30: Will Go Down! Short!
My dear friends,
Today we will analyse US30 together☺️
The recent price action suggests a shift in mid-term momentum. A break below the current local range around 47,577.1 will confirm the new direction downwards with the target being the next key level of 43,436.6 .and a reconvened placement of a stop-loss beyond the range.
❤️Sending you lots of Love and Hugs❤️
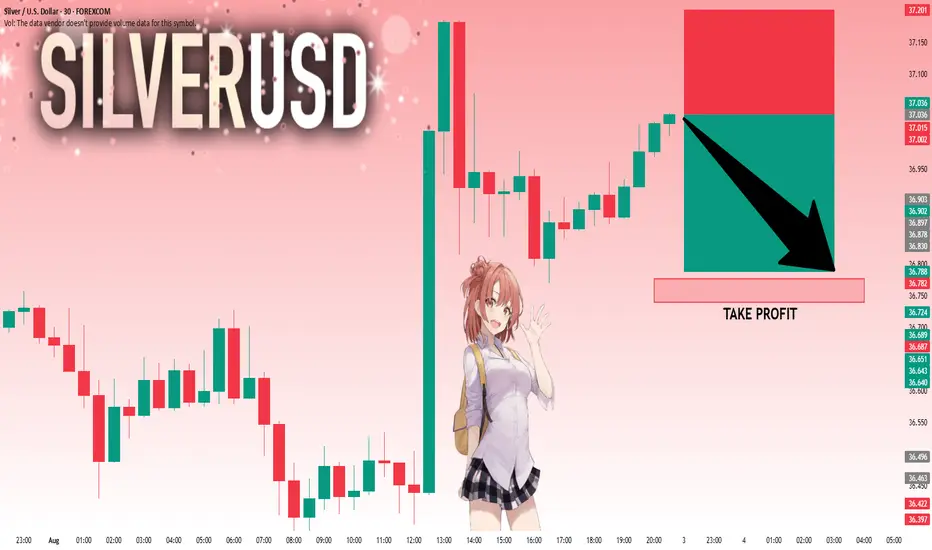
SILVER: The Market Is Looking Down! Short!
My dear friends,
Today we will analyse SILVER together☺️
The market is at an inflection zone and price has now reached an area around 37.036 where previous reversals or breakouts have occurred.And a price reaction that we are seeing on multiple timeframes here could signal the next move down so we can enter on confirmation, and target the next key level of 36.788..Stop-loss is recommended beyond the inflection zone.
❤️Sending you lots of Love and Hugs❤️
EURUSD: Strong Bullish Sentiment! Long!
My dear friends,
Today we will analyse EURUSD together☺️
The price is near a wide key level
and the pair is approaching a significant decision level of 1.15859 Therefore, a strong bullish reaction here could determine the next move up.We will watch for a confirmation candle, and then target the next key level of 1.16494.Recommend Stop-loss is beyond the current level.
❤️Sending you lots of Love and Hugs❤️

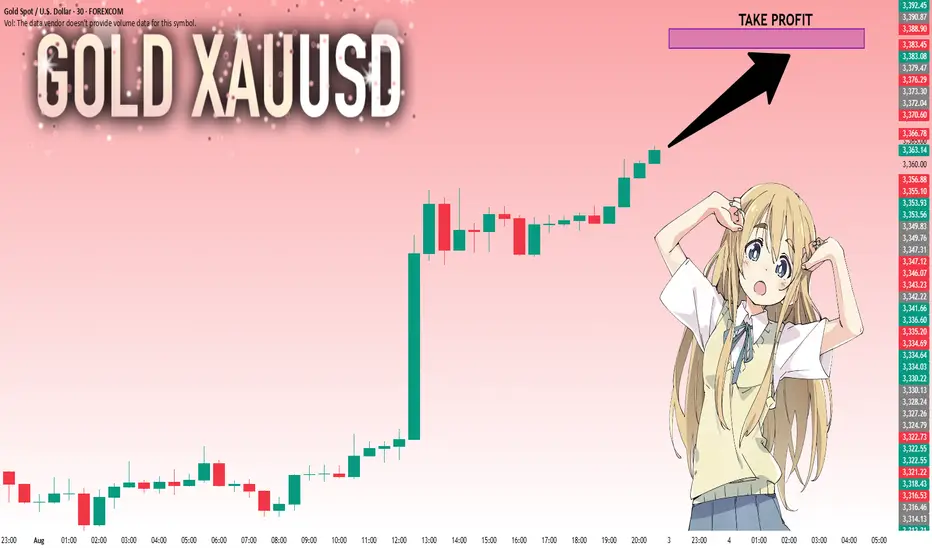
GOLD: Bulls Are Winning! Long!
My dear friends,
Today we will analyse GOLD together☺️
The recent price action suggests a shift in mid-term momentum. A break above the current local range around 3,363.50 will confirm the new direction upwards with the target being the next key level of 3,383.45 and a reconvened placement of a stop-loss beyond the range.
❤️Sending you lots of Love and Hugs❤️
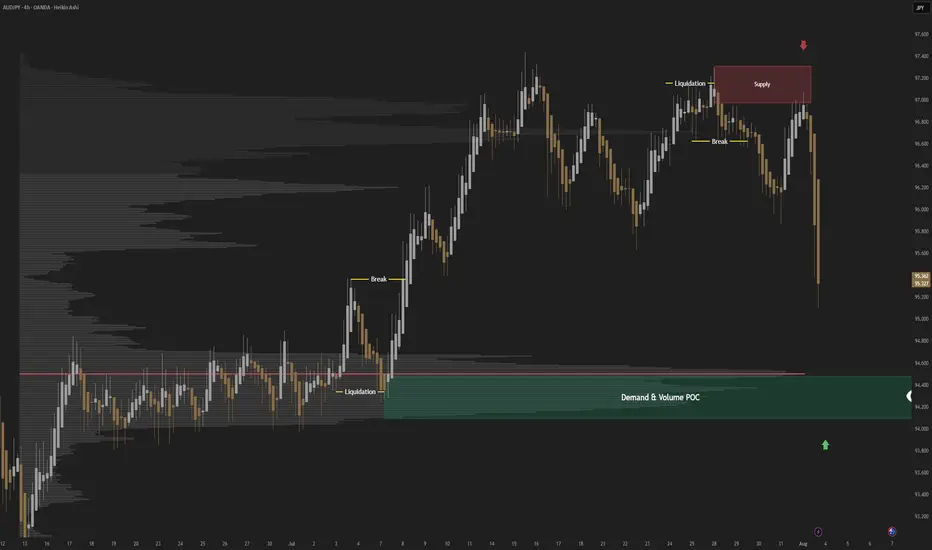
AUDJPY; Heikin Ashi Trade IdeaIn this post, I’ll be sharing my analysis of AUDJPY with my unique Heikin Ashi strategy.Picture tells more than 1000 words, no BS. I highlight key areas where I’m anticipating potential opportunities.
I’m always happy to receive any feedback.
Like, share and comment! ❤️
SILVER WILL FALL|SHORT|
✅SILVER is going up now
But a strong resistance level is ahead at 37,60$
Thus I am expecting a pullback
And a move down towards the target of 36,69$
SHORT🔥
✅Like and subscribe to never miss a new idea!✅
Disclosure: I am part of Trade Nation's Influencer program and receive a monthly fee for using their TradingView charts in my analysis.

CAD_JPY BEARISH BREKAOUT|SHORT|
✅CAD_JPY broke the key structure level of 107.400
While trading in an local downtrend
Which makes me bearish
And I think that after the retest of the broken level is complete
A rebound and bearish continuation will follow
SHORT🔥
✅Like and subscribe to never miss a new idea!✅
Disclosure: I am part of Trade Nation's Influencer program and receive a monthly fee for using their TradingView charts in my analysis.

GBP-AUD Growth Ahead! Buy!
Hello,Traders!
GBP-AUD made a retest
Of the horizontal support
Of 2.0420 and we are
Already seeing a bullish
Rebound so we will be
Expecting a further
Bullish move up
Buy!
Comment and subscribe to help us grow!
Check out other forecasts below too!
Disclosure: I am part of Trade Nation's Influencer program and receive a monthly fee for using their TradingView charts in my analysis.
