Ramelius Resources (ASX: RMS) –A Tactical Re-Entry Zone?🟡 Gold-Linked Opportunity: Ramelius Resources (ASX: RMS) – A Tactical Re-Entry Zone?
Context: Ramelius Resources, a mid-tier Aussie gold producer, is showing signs of technical exhaustion after a strong rally from its 2024 lows. With gold prices consolidating and RMS pulling back to a key support zone, this could be a tactical opportunity for shareholders and swing traders alike.
📊 Technical Snapshot:
Current Price: $2.47
Trendline Support: The long-term ascending trendline remains intact, offering a potential re-entry zone for bulls.
Risk-Reward Setup: Defined green/red zones highlight a favorable R:R ratio for those targeting a rebound toward $2.80–$3.00.
🪙 Gold Correlation Insight:
The inset chart shows gold (XAU/USD) stabilizing after a volatile June. If gold resumes its uptrend, RMS could follow suit, given its strong correlation with bullion prices.
🧠 Psychological Angle:
After a 40%+ rally from the $1.78 low, some profit-taking is natural. But this pullback may shake out weak hands before a continuation move.
Watch for sentiment shifts around gold and broader risk appetite—these could be catalysts for RMS’s next leg.
#RMS #Gold #ASX #MJTrading #Forex #Trading #Investment
Signals

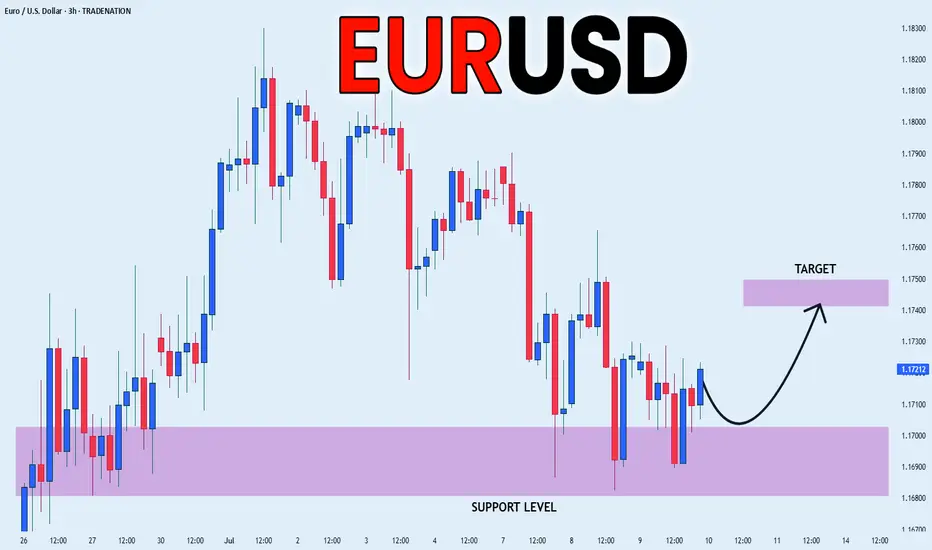
EUR_USD LOCAL REBOUND|LONG|
✅EUR_USD has retested a key support level of 1.1690
And as the pair is already making a bullish rebound
A move up to retest the supply level above at 1.1744 is likely
LONG🚀
✅Like and subscribe to never miss a new idea!✅
Disclosure: I am part of Trade Nation's Influencer program and receive a monthly fee for using their TradingView charts in my analysis.
NATGAS Support Ahead! Buy!
Hello,Traders!
NATGAS keeps falling but
The price will soon hit a
Horizontal support of 2.90$
From where we will be expecting
A local bullish rebound
Buy!
Comment and subscribe to help us grow!
Check out other forecasts below too!
Disclosure: I am part of Trade Nation's Influencer program and receive a monthly fee for using their TradingView charts in my analysis.

CAD_CHF STRONG SUPPORT|LONG|
✅CAD_CHF has been falling recently
And the pair seems locally oversold
So as the pair is approaching a
Horizontal support of 0.5790
Price growth is to be expected
LONG🚀
✅Like and subscribe to never miss a new idea!✅
Disclosure: I am part of Trade Nation's Influencer program and receive a monthly fee for using their TradingView charts in my analysis.

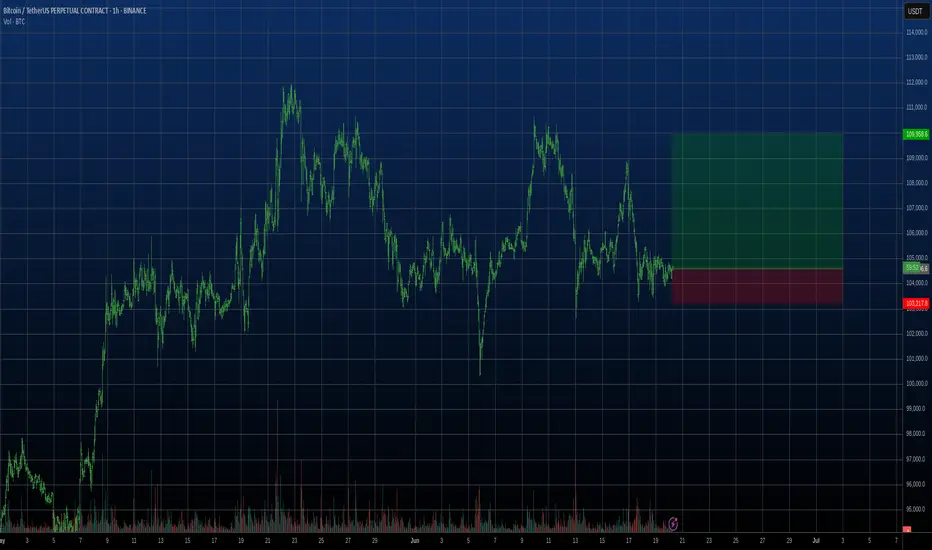
Lingrid | BTCUSDT Short-Term Bullish Momentum The price perfectly fulfilled my last idea . BINANCE:BTCUSDT continues to trade within a strong upward channel, supported by consecutive higher highs and an ascending trendline. After breaking above the range near $108,200, price briefly peaked above $110,000 before pulling back to retest the mid-support zone. Current action shows a rebound from the upward trendline, suggesting buyers are preparing for another leg up toward $110,500 and possibly the $112,000 resistance zone.
📈 Key Levels
Buy zone: around 108,000 or below
Sell trigger: break below 107,000 with close under channel
Target: 110,500 – midpoint resistance, followed by 112,000
Buy trigger: bounce from trendline and reclaim of 109,000
💡 Risks
Weak rebound could signal range re-entry and stall upside
Break below the trendline may shift bias to 105,000
Multiple rejections near 110,000 could indicate topping pressure
If this idea resonates with you or you have your own opinion, traders, hit the comments. I’m excited to read your thoughts!

AUD-NZD Short From Resistance! Sell!
Hello,Traders!
AUD-NZD keeps growing
And the pair is overbought
So after it hits the horizontal
Resistance of 1.0921 from
Where we will be expecting
A local bearish correction
Sell!
Comment and subscribe to help us grow!
Check out other forecasts below too!
Disclosure: I am part of Trade Nation's Influencer program and receive a monthly fee for using their TradingView charts in my analysis.

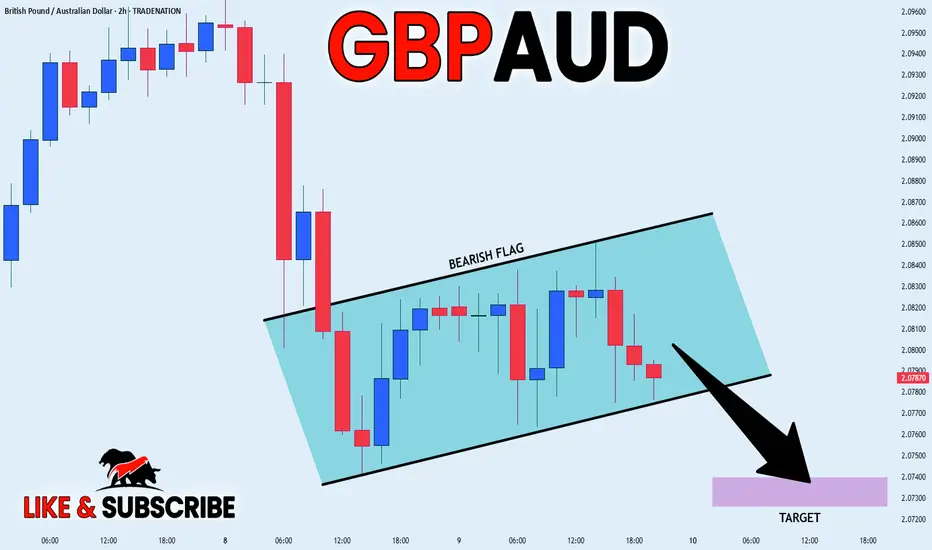
GBP_AUD BEARISH FLAG|SHORT|
✅GBP_AUD is going down now
And the pair has formed
A bearish flag pattern
Which makes me bearish biased
And after the breakout
I believe we will see bearish continuation
SHORT🔥
✅Like and subscribe to never miss a new idea!✅
Disclosure: I am part of Trade Nation's Influencer program and receive a monthly fee for using their TradingView charts in my analysis.
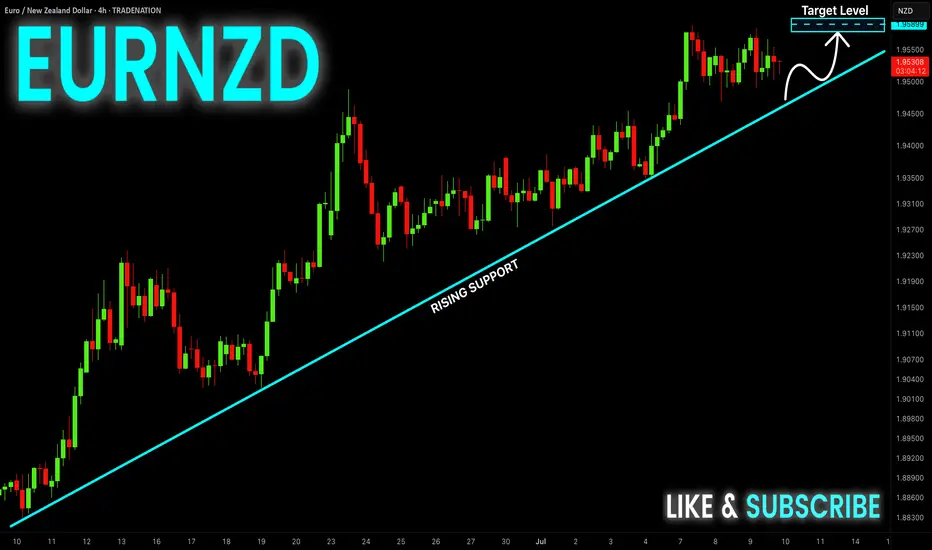
EUR-NZD Strong Uptrend! Buy!
Hello,Traders!
EUR-NZD is trading in a
Strong uptrend along the
Rising support so we are
Bullish biased and we will
Be expecting a further
Bullish move up
Buy!
Comment and subscribe to help us grow!
Check out other forecasts below too!
Disclosure: I am part of Trade Nation's Influencer program and receive a monthly fee for using their TradingView charts in my analysis.
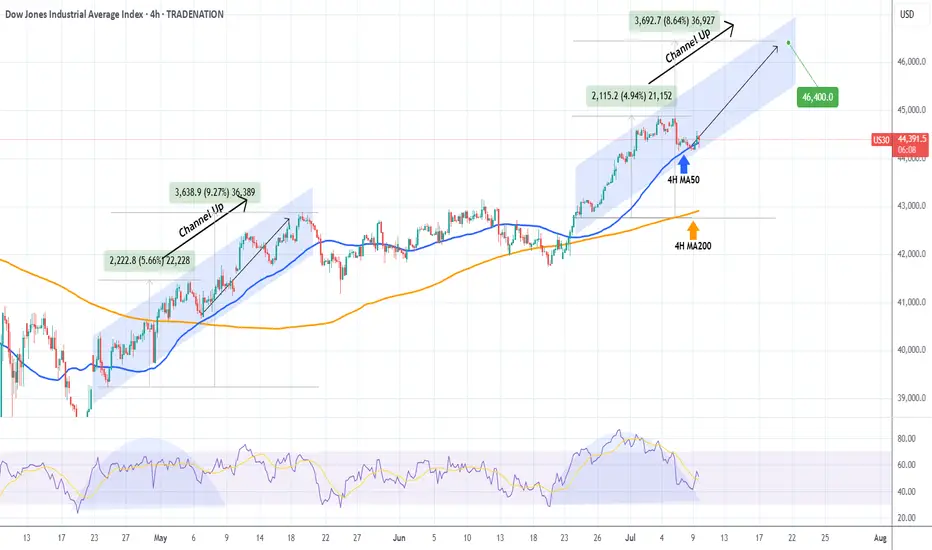
DOW JONES repeating May's pattern.Dow Jones (DJI) has been testing its 4H MA50 (blue trend-line) since yesterday, following 2 straight weeks of trading strongly above it.
If it holds and rebounds, the pattern will draw even more similarities with May's Channel Up, which after the May 06 Low, it resumed the uptrend to peak on a +9.27% rise from the bottom, before breaking below the 4H MA50.
Since the current rise is -0.70% weaker (+4.94% against +5.66%) from May's fractal, we can assume that as long as the 4H MA50 holds, we can expect a peak at 46400.
-------------------------------------------------------------------------------
** Please LIKE 👍, FOLLOW ✅, SHARE 🙌 and COMMENT ✍ if you enjoy this idea! Also share your ideas and charts in the comments section below! This is best way to keep it relevant, support us, keep the content here free and allow the idea to reach as many people as possible. **
-------------------------------------------------------------------------------
Disclosure: I am part of Trade Nation's Influencer program and receive a monthly fee for using their TradingView charts in my analysis.
💸💸💸💸💸💸
👇 👇 👇 👇 👇 👇
EUR_CHF SUPPORT AHEAD|LONG|
✅EUR_CHF is going down now
But a strong support level is ahead at 0.9293
Thus I am expecting a rebound
And a move up towards the target of 0.9320
LONG🚀
✅Like and subscribe to never miss a new idea!✅
Disclosure: I am part of Trade Nation's Influencer program and receive a monthly fee for using their TradingView charts in my analysis.

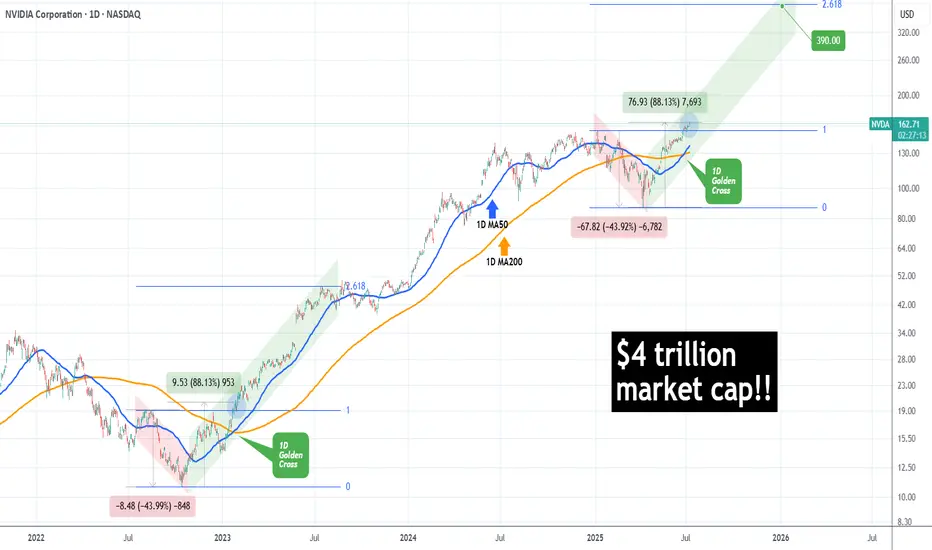
NVIDIA made history! First company with $4 trillion market cap!NVIDIA Corporation (NVDA) became today the first company in history to surpass a $4 trillion market value, as A.I. bulls extended the recent rally and pushed the price past the approximate $163.93 level needed to reach this market capitalization threshold.
The long-term trend on the 1D time-frame couldn't look more bullish. Coming off a 1D Golden Cross less than 2 weeks ago, the price has turned the 1D MA50 (blue trend-line) into Support and sits at +88.13% from the April 07 2025 Low.
This is the exact set-up that the market had when it was coming off the 2022 Inflation Crisis bottom (October 13 2022). As you can see, both fractals started with a -44% decline, bottomed and when they recovered by +88.13%, there were just past a 1D Golden Cross. In fact that Golden Cross (January 24 2023) was the last one before the current.
NVIDIA entered a Channel Up (green) on its recovery and for as long as the 1D MA50 was supporting, it peaked on the 2.618 Fibonacci extension before it pulled back below it.
If history repeats this pattern, we are looking at a potential peak around $390, which may indeed seem incredibly high at the moment, but as we pointed out on previous analyses, the market is in the early stages of the A.I. Bubble, similar to the Internet Bubble of the 1990s.
-------------------------------------------------------------------------------
** Please LIKE 👍, FOLLOW ✅, SHARE 🙌 and COMMENT ✍ if you enjoy this idea! Also share your ideas and charts in the comments section below! This is best way to keep it relevant, support us, keep the content here free and allow the idea to reach as many people as possible. **
-------------------------------------------------------------------------------
💸💸💸💸💸💸
👇 👇 👇 👇 👇 👇
USD-CHF Bearish Flag! Sell!
Hello,Traders!
USD-CHF is trading in a
Downtrend and the pair broke
Out of the bearish flag so
We are bearish biased
And we will be expecting
A further bearish move down
Sell!
Comment and subscribe to help us grow!
Check out other forecasts below too!
Disclosure: I am part of Trade Nation's Influencer program and receive a monthly fee for using their TradingView charts in my analysis.

Good moment for try to Buy BTCGood moment for try to Buy BTC. A good triangle has formed. There are prerequisites for its upward breakout. Very good risk/reward ratio. Stop below the triangle. Let's see...
DXY: The Market Is Looking Down! Short!
My dear friends,
Today we will analyse DXY together☺️
The in-trend continuation seems likely as the current long-term trend appears to be strong, and price is holding below a key level of 97.054 So a bearish continuation seems plausible, targeting the next low. We should enter on confirmation, and place a stop-loss beyond the recent swing level.
❤️Sending you lots of Love and Hugs❤️

GOLD: Strong Bearish Sentiment! Short!
My dear friends,
Today we will analyse GOLD together☺️
The market is at an inflection zone and price has now reached an area around 3,311.90 where previous reversals or breakouts have occurred.And a price reaction that we are seeing on multiple timeframes here could signal the next move down so we can enter on confirmation, and target the next key level of 3,301.31..Stop-loss is recommended beyond the inflection zone.
❤️Sending you lots of Love and Hugs❤️

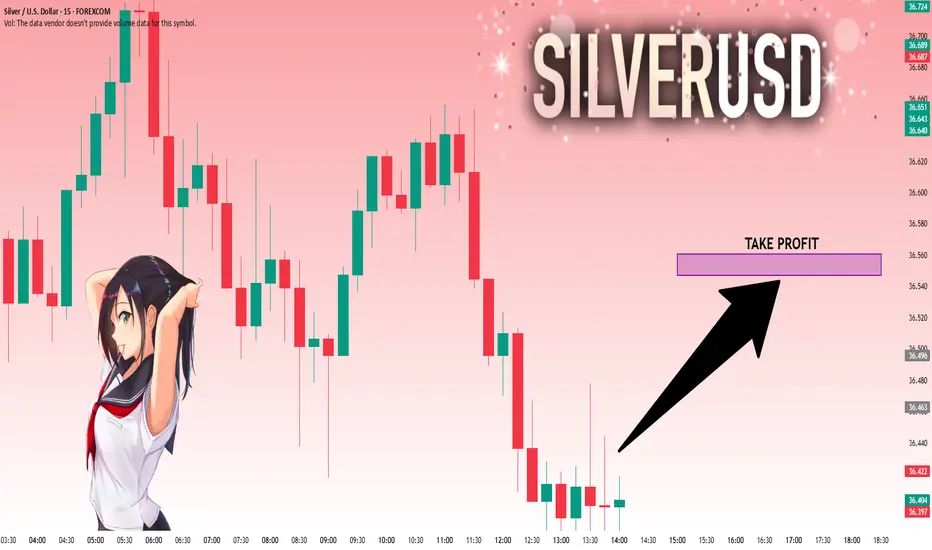
SILVER: Bulls Are Winning! Long!
My dear friends,
Today we will analyse SILVER together☺️
The price is near a wide key level
and the pair is approaching a significant decision level of 36.433 Therefore, a strong bullish reaction here could determine the next move up.We will watch for a confirmation candle, and then target the next key level of 36.547.Recommend Stop-loss is beyond the current level.
❤️Sending you lots of Love and Hugs❤️
EURUSD: Next Move Is Up! Long!
My dear friends,
Today we will analyse EURUSD together☺️
The recent price action suggests a shift in mid-term momentum. A break above the current local range around 1.17041 will confirm the new direction upwards with the target being the next key level of 1.17163 and a reconvened placement of a stop-loss beyond the range.
❤️Sending you lots of Love and Hugs❤️

Trading balanceTrading balance The price of the asset has rebounded from the balance zone. With the prospect of growth into the resistance zone.
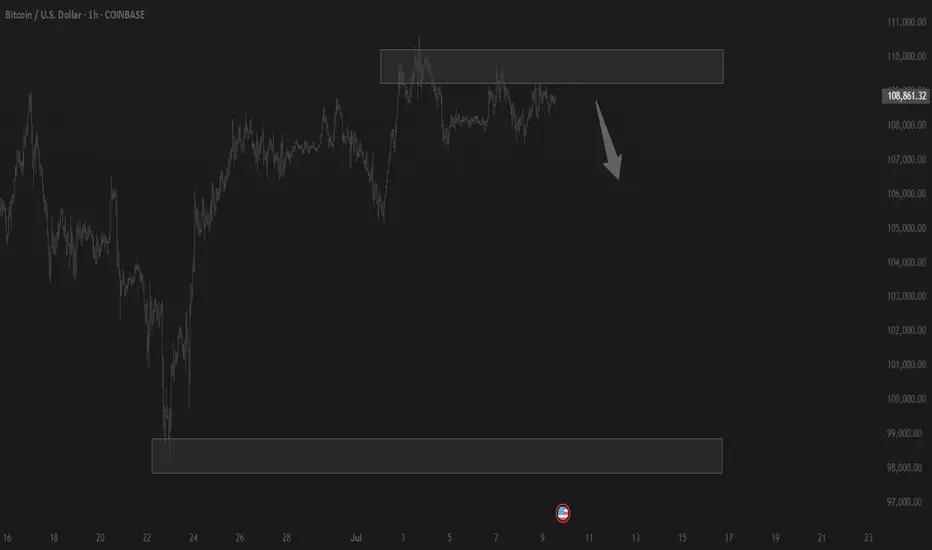
BITCOIN turning the Bull Flag into Support??Bitcoin (BTCUSD) has been trading sideways, almost flat, since the July 03 High, supported by the 1D MA50 (blue trend-line).
Perhaps the strongest development of the week though is the fact that this consolidation has been taking place at the top (Lower Highs) of what we previously identified as a Bull Flag pattern.
Together with the 1D MA50, this Lower Highs trend-line forms a formidable Support, which as long as it holds, can technically fulfil the technical expectations out of this pattern and target the 2.0 Fibonacci extension at $168500.
Is this one step closer to our 'fair valued' $150k Target for this Cycle? Feel free to let us know in the comments section below!
-------------------------------------------------------------------------------
** Please LIKE 👍, FOLLOW ✅, SHARE 🙌 and COMMENT ✍ if you enjoy this idea! Also share your ideas and charts in the comments section below! This is best way to keep it relevant, support us, keep the content here free and allow the idea to reach as many people as possible. **
-------------------------------------------------------------------------------
💸💸💸💸💸💸
👇 👇 👇 👇 👇 👇

Lingrid | GOLD Major Support Level ViolatedOANDA:XAUUSD has formed a lower high beneath the key resistance at 3,310, showing fading bullish momentum after a breakout failure. Price is trading below the upward trendline and moving toward the 3,260 support zone with a corrective structure. The rejection from the resistance block and breakdown of a key level suggests continued bearish pressure.
📉 Key Levels
Sell trigger: rejection from 3,300–3,330 resistance block
Target: 3,260 key support, followed by 3,240 lower zone
Invalid level: breakout and close above 3,320 regains bullish bias
Resistance zone: 3,310–3,330 acting as a ceiling for upside attempts
⚠️ Risks
Reclaiming 3,310 would shift the bias back to neutral/bullish
Sideways range between 3,260–3,320 could cause fakeouts
Volatility spikes from macroeconomic events may trigger stop hunts
If this idea resonates with you or you have your own opinion, traders, hit the comments. I’m excited to read your thoughts!

Lingrid | GBPNZD Trend Continuation OpportunityThe price perfectly fulfilled my last idea . FX:GBPNZD is rebounding strongly after forming a Higher Low just above the key support at 2.2587, sustaining the bullish structure. The recent impulse leg broke out of the previous downward channel, and price is now stabilizing for a potential rally toward the 2.2900 resistance. If momentum sustains above the trendline retest area, we may see another wave toward the top of the resistance zone.
📈 Key Levels
Buy zone: 2.2580–2.2660 near support and trendline confluence
Buy trigger: breakout continuation above 2.2700 with bullish structure
Target: 2.2900 resistance zone, top of the current wave
Sell invalidation: drop below 2.2370 breaks the bullish market structure
💡 Risks
Failure to hold 2.2580 support could push price back toward 2.2370
Resistance around 2.2700–2.2750 may delay breakout if volume weakens
Broader rangebound conditions may trap early long positions
If this idea resonates with you or you have your own opinion, traders, hit the comments. I’m excited to read your thoughts!

USDJPY Will Go Down! Sell!
Here is our detailed technical review for USDJPY.
Time Frame: 1D
Current Trend: Bearish
Sentiment: Overbought (based on 7-period RSI)
Forecast: Bearish
The market is approaching a significant resistance area 146.736.
Due to the fact that we see a positive bearish reaction from the underlined area, I strongly believe that sellers will manage to push the price all the way down to 144.416 level.
P.S
We determine oversold/overbought condition with RSI indicator.
When it drops below 30 - the market is considered to be oversold.
When it bounces above 70 - the market is considered to be overbought.
Disclosure: I am part of Trade Nation's Influencer program and receive a monthly fee for using their TradingView charts in my analysis.
Like and subscribe and comment my ideas if you enjoy them!

AUDUSD Will Move Lower! Short!
Take a look at our analysis for AUDUSD.
Time Frame: 12h
Current Trend: Bearish
Sentiment: Overbought (based on 7-period RSI)
Forecast: Bearish
The market is on a crucial zone of supply 0.653.
The above-mentioned technicals clearly indicate the dominance of sellers on the market. I recommend shorting the instrument, aiming at 0.649 level.
P.S
Overbought describes a period of time where there has been a significant and consistent upward move in price over a period of time without much pullback.
Disclosure: I am part of Trade Nation's Influencer program and receive a monthly fee for using their TradingView charts in my analysis.
Like and subscribe and comment my ideas if you enjoy them!
