USOIL BEST PLACE TO SELL FROM|SHORT
USOIL SIGNAL
Trade Direction: short
Entry Level: 68.26
Target Level: 63.78
Stop Loss: 71.23
RISK PROFILE
Risk level: medium
Suggested risk: 1%
Timeframe: 9h
Disclosure: I am part of Trade Nation's Influencer program and receive a monthly fee for using their TradingView charts in my analysis.
✅LIKE AND COMMENT MY IDEAS✅
Signals

No Bullish Confirmation – Targeting 3250 on XAU/USDIn yesterday’s analysis, I mentioned that due to Monday’s daily Pin Bar, I closed my short trade on Gold around break-even and decided to wait for more confirmation.
Unfortunately, that wasn't the best decision. The price failed to break above resistance for a bullish continuation and instead dropped sharply, closing the day exactly at the 3300 figure. At the time of writing, Gold is trading even lower at 3293, after briefly rebounding from the 3285 support zone—a level I’ve highlighted in the past.
Moving forward, after the failed bullish continuation and yesterday’s bearish move, it’s clear that bears are back in control. A drop toward the 3250 zone is now on the table.
Conclusion: I’m looking to sell rallies, with my invalidation zone set above 3340, aiming for a good risk-to-reward setup.
Disclosure: I am part of TradeNation's Influencer program and receive a monthly fee for using their TradingView charts in my analyses and educational articles.

GOLD is in bearish conditions, pressured by aggressive tariffsOn Wednesday (July 9) in the Asian market, the spot OANDA:XAUUSD suddenly fell sharply in the short term, and the gold price just fell below 3,290 USD / ounce.
Although US President Trump announced that the first tariff letters had been sent to some US trading partners, the gold price fell below 3,290 USD / ounce due to the weakening demand for safe-haven gold. Trump postponed the tariff deadline to August 1, easing trade tensions.
The recovery in the dollar TVC:DXY and rising US Treasury yields also weighed on gold, sending prices sharply lower after hitting a high of $3,345 an ounce.
The yield on the 10-year US Treasury note TVC:US10Y rose to its highest in more than two weeks, making gold, which does not pay interest, less attractive as an investment.
The yield on the 10-year US Treasury note rose to 4.415%. The US real yield also rose 4 basis points to 2.073%.
TVC:DXY , which tracks the greenback's performance against a basket of currencies, rose 0.20% to 97.70. The rise in the Dollar Index means that gold priced in dollars has become less attractive because they are inversely correlated.
Japan and South Korea said on Tuesday they would try to speed up trade talks with the United States in a bid to soften President Donald Trump's stance on new tariffs set to take effect on August 1.
But optimism about a trade deal boosted market risk appetite, limiting gold's upside.
Traders are awaiting the release of the minutes of the Federal Reserve's latest meeting on Wednesday, followed by data on initial jobless claims for the week ended July 5.
Investors now expect the Fed to cut interest rates by 50 basis points before the end of the year, starting in October.
Technical Outlook Analysis OANDA:XAUUSD
On the daily chart, gold fell below the 3,300USD whole price point and the 0.382% Fibonacci retracement level, which are the initial conditions for gold prices to have a prospect for a bearish trend.
Currently, with the position below 3,300USD, gold may continue to decline with the next target around 3,246USD in the short term, more than the 0.50% Fibonacci retracement level.
The current resistances of gold prices are the pressure from the EMA21 line, followed by the 0.236% Fibonacci retracement. These are also the resistance positions that readers paid attention to in the previous issue.
In addition, the RSI is pointing down from 50, currently 50 is considered the nearest resistance and the fact that the RSI is pointing down is quite far from the oversold zone, indicating that there is still room for a decline ahead.
During the day, although the trend is not yet completely clear, gold is showing conditions that are more inclined towards a decline, along with that, the notable positions will be listed as follows.
Support: 3,292 - 3,246 USD
Resistance: 3,300 - 3,340 - 3,350 USD
SELL XAUUSD PRICE 3346 - 3344⚡️
↠↠ Stop Loss 3350
→Take Profit 1 3338
↨
→Take Profit 2 3332
BUY XAUUSD PRICE 3245 - 3247⚡️
↠↠ Stop Loss 3241
→Take Profit 1 3253
↨
→Take Profit 2 3259

Trump "stirred up" GOLD recovery but limited by USD appreciationSpot CAPITALCOM:GOLD has rebounded strongly from yesterday's lows, currently trading around $3,333/oz. The main reason is that US President Trump announced a 25% tariff on Japan and South Korea starting August 1, which boosted safe-haven demand. However, the strengthening US Dollar has also limited the broader recovery in gold prices.
On Monday local time, US President Trump sent letters to 14 countries including Japan, South Korea and South Africa threatening to impose tariffs. He then signed an executive order to extend the suspension of "reciprocal tariffs" until August 1.
Trump announced that he would impose a 25% tariff on imports from Japan and South Korea, effective August 1. In a letter to the leaders of Japan and South Korea, Trump said the tariffs would be imposed on August 1 because the two countries' trade relationship with the United States is "very unfair".
This is his first letter to major trading partners ahead of the July 9 deadline to reach a trade deal.
Trump said that despite the large trade deficits between the United States and South Korea and Japan, the United States has decided to continue to cooperate with the two countries. However, the United States has decided to move forward on the premise of more balanced and fair trade. Trump said that the trade deficit has posed a major threat to the US economy and even national security, so changes are needed. Starting August 1, 2025, the United States will impose a 25% tariff on all products from South Korea and Japan, regardless of the different tariffs by industry.
Additionally, any attempt to circumvent tariffs by shipping through a third country will also be subject to higher tariffs.
Trump said companies that choose to build factories or manufacture products in the United States will not have to pay the tariffs. Additionally, if South Korea and Japan decide to increase tariffs on the United States, the United States will impose additional tariffs of the same size on top of the current 25% tariff.
Official data released by the People's Bank of China on Monday showed that China's central bank increased its gold reserves in June, marking the eighth consecutive month of increase.
Bank of America said that central banks around the world are buying gold to diversify their foreign exchange reserves, thereby reducing their dependence on the US dollar and protecting against inflation and economic instability, and the trend is expected to continue.
Technical Outlook Analysis CAPITALCOM:GOLD
On the daily chart, gold has recovered from a key technical confluence area, which is the closest support area to note for readers in the weekly publication. The area from $3,292 – $3,300 is the confluence of the 0.382% Fibonacci retracement with the lower edge of the long-term rising price channel. However, the temporary recovery is being limited by the EMA21, the current closest resistance, followed by the 0.236% Fibonacci retracement level.
The recovery momentum is significant, but for gold to have enough technical bullish conditions, it needs to take price action above the EMA21, with a bullish breakout of the 0.236% Fibonacci retracement level then the prospect of a new bullish cycle will be opened.
If gold breaks above the 0.236% Fibonacci retracement level it will have the next target at the raw price point of $3,400 followed by horizontal resistance at $3,430.
During the day, the current gold price should still be assessed as a sideways accumulation trend, when the Relative Strength Index RSI sticks around 50, showing the market's hesitant sentiment.
A strong enough fundamental impact to change the structure will give a more specific technical trend in the coming time, and the notable positions will be listed as follows.
Support: 3,300 - 3,292 USD
Resistance: 3,350 - 3,371 - 3,400 USD
SELL XAUUSD PRICE 3366 - 3364⚡️
↠↠ Stop Loss 3370
→Take Profit 1 3358
↨
→Take Profit 2 3352
BUY XAUUSD PRICE 3294 - 3296⚡️
↠↠ Stop Loss 3290
→Take Profit 1 3302
↨
→Take Profit 2 3308

AUD_JPY WILL KEEP GROWING|LONG|
✅AUD_JPY is going up
Now and the pair made a bullish
Breakout of the key horizontal
Level of 95.600 and the breakout
Is confirmed so we are bullish
Biased and further growth
Is to be expected
LONG🚀
✅Like and subscribe to never miss a new idea!✅
Disclosure: I am part of Trade Nation's Influencer program and receive a monthly fee for using their TradingView charts in my analysis.

GOLD Long Inside The Range! Buy!
Hello,Traders!
GOLD is stuck in a local
Range while still trading
In a strong long-term uptrend
So we think that this is an
Accumulation before the
Next leg up and as we are
Bullish biased we will be
Expecting a retest and a
Rebound from the horizontal
Support below around 3259$
With the target of retesting
The horizontal resistance
Above around 3354$
Buy!
Comment and subscribe to help us grow!
Check out other forecasts below too!
Disclosure: I am part of Trade Nation's Influencer program and receive a monthly fee for using their TradingView charts in my analysis.

AUD_NZD SWING SHORT|
✅AUD_NZD has been growing recently
And the pair seems locally overbought
So as the pair is approaching a horizontal resistance of 1.0920
Price decline is to be expected
SHORT🔥
✅Like and subscribe to never miss a new idea!✅
Disclosure: I am part of Trade Nation's Influencer program and receive a monthly fee for using their TradingView charts in my analysis.

AUD-JPY Bullish Breakout! Buy!
Hello,Traders!
AUD-JPY is trading in a
Strong uptrend and the pair
Made a bullish breakout of
The key horizontal level
Of 95.650 which is now a
Support and the breakout
Is confirmed so we are bullish
Biased and we will be expecting
A further bullish move up
Buy!
Comment and subscribe to help us grow!
Check out other forecasts below too!
Disclosure: I am part of Trade Nation's Influencer program and receive a monthly fee for using their TradingView charts in my analysis.

DXY LOCAL SHORT|
✅DXY is about to retest a key structure level of 98.000
Which implies a high likelihood of a move down
As some market participants will be taking profit from long positions
While others will find this price level to be good for selling
So as usual we will have a chance to ride the wave of a bearish correction
SHORT🔥
✅Like and subscribe to never miss a new idea!✅
Disclosure: I am part of Trade Nation's Influencer program and receive a monthly fee for using their TradingView charts in my analysis.

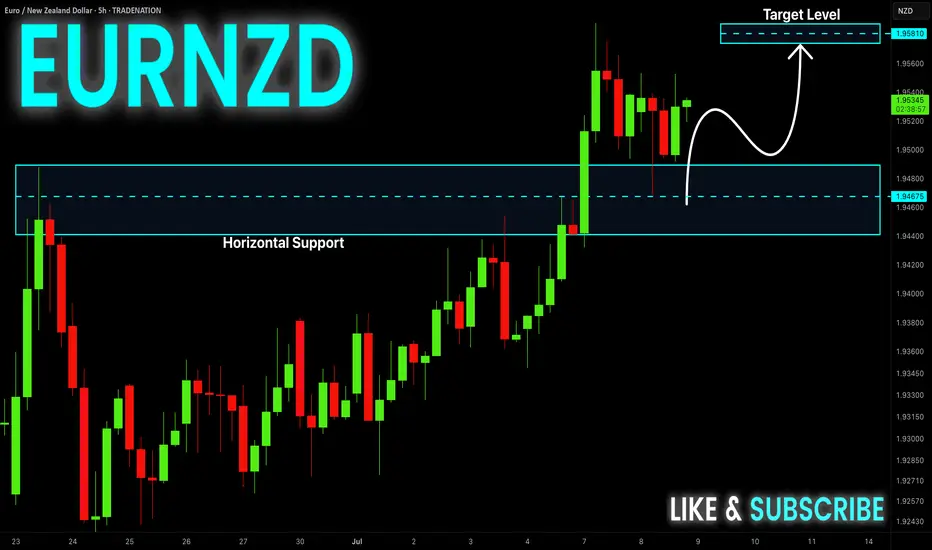
EUR-NZD Will Keep Growing! Buy!
Hello,Traders!
EUR-NZD keeps growing in a
Strong uptrend and the pair
Made a retest and a rebound
From the horizontal support
Of 1.9480 so we are bullish
Biased and we will be expecting
A further bullish move up
Buy!
Comment and subscribe to help us grow!
Check out other forecasts below too!
Disclosure: I am part of Trade Nation's Influencer program and receive a monthly fee for using their TradingView charts in my analysis.
VISA on a strong Bullish Leg targeting $440.Visa Inc. (V) has been trading within a Channel Up pattern since the October 10 2022 market bottom. After December 2022, every test of the 1W MA50 (blue trend-line) has been the most optimal long-term buy opportunity, being also a Higher Low (bottom) of the pattern.
Every Bullish Leg has been +5% stronger than the previous, which leads us to believe that the current Bullish Leg will peak at around +49.50% (+5% from +44.60%). This translates to $440 Target towards the end of the year.
-------------------------------------------------------------------------------
** Please LIKE 👍, FOLLOW ✅, SHARE 🙌 and COMMENT ✍ if you enjoy this idea! Also share your ideas and charts in the comments section below! This is best way to keep it relevant, support us, keep the content here free and allow the idea to reach as many people as possible. **
-------------------------------------------------------------------------------
💸💸💸💸💸💸
👇 👇 👇 👇 👇 👇

DAX: Target Is Up! Long!
My dear friends,
Today we will analyse DAX together☺️
The in-trend continuation seems likely as the current long-term trend appears to be strong, and price is holding above a key level of 24,193.11 So a bullish continuation seems plausible, targeting the next high. We should enter on confirmation, and place a stop-loss beyond the recent swing level.
❤️Sending you lots of Love and Hugs❤️

GOLD: Move Up Expected! Long!
My dear friends,
Today we will analyse GOLD together☺️
The market is at an inflection zone and price has now reached an area around 3,298.60 where previous reversals or breakouts have occurred.And a price reaction that we are seeing on multiple timeframes here could signal the next move up so we can enter on confirmation, and target the next key level of 3,312.65.Stop-loss is recommended beyond the inflection zone.
❤️Sending you lots of Love and Hugs❤️

SILVER: Local Bearish Bias! Short!
My dear friends,
Today we will analyse SILVER together☺️
The price is near a wide key level
and the pair is approaching a significant decision level of 36.435 Therefore, a strong bearish reaction here could determine the next move down.We will watch for a confirmation candle, and then target the next key level of 36.336..Recommend Stop-loss is beyond the current level.
❤️Sending you lots of Love and Hugs❤️

EURUSD: Absolute Price Collapse Ahead! Short!
My dear friends,
Today we will analyse EURUSD together☺️
The recent price action suggests a shift in mid-term momentum. A break below the current local range around 1.17083 will confirm the new direction downwards with the target being the next key level of 1.16863.and a reconvened placement of a stop-loss beyond the range.
❤️Sending you lots of Love and Hugs❤️

US tariff deadline, GOLD expected to fluctuate very stronglyInvestors will be keeping an eye on tariff news from Washington this week as the temporary suspension of punitive import duties is set to expire. If trade tensions do not escalate further after Wednesday’s deadline, that could be good for the market, while downside risks are also a negative for OANDA:XAUUSD in particular.
News Around US Tariffs
To avoid higher tariffs, negotiators from more than a dozen major US trading partners are racing against time to negotiate with the Trump administration, trying to reach a deal before July 9. Trump and his team have continued to apply pressure in recent days.
Trump announced a deal with Vietnam to lower the 20% tariffs he had promised on many Vietnamese exports, while talks with Japan, the United States’ most important ally in Asia and sixth-largest trading partner, appeared to be stalled, even as Washington hinted it was close to a deal with India.
In data
Nonfarm payrolls data released Thursday showed the U.S. added 147,000 jobs in June, beating market expectations, and the unemployment rate fell to 4.1%.
Despite the slowdown in private-sector hiring, the overall strong report prompted markets to lower expectations for a Federal Reserve rate cut in July.
According to the CME FedWatch Tool, the probability of a rate cut has dropped sharply from 24% to 4.7%. Fed Chairman Powell reiterated that the central bank will not ease its stance until there are more signs of cooling in employment and inflation.
Personal Comments
The market is following a number of factors:
On the one hand, there is a countdown to Trump's "final blow" on tariffs, and on the other hand, the non-farm data has poured cold water once again. As the Fed's stance fluctuates, the US Dollar faces a tug-of-war between long and short positions, while gold continues to stabilize technically or has had significant price increases. July 9 of this month could be a key moment to really test the sustainability of gold in this recovery.
Technical Outlook Analysis OANDA:XAUUSD
Gold has recovered significantly over the past week, since finding support from the $3,250 area, but the temporary recovery is still limited by the EMA21 followed by the 0.236% Fibonacci retracement level.
However, sustained price action above the $3,300 raw price point should be viewed as a positive signal as it helps gold stabilize within the price channel.
If gold rises and breaks above the 0.236% Fibonacci retracement level, it will be eligible to continue rising with a short-term target of around $3,400 rather than a horizontal resistance of $3,430.
The indecision sentiment is shown by the RSI activity, which is mostly moving around the 50 level. RSI above 50 is considered a positive signal, while RSI below 50 is considered a negative signal, but gold is currently in the middle of this point.
Overall, gold has not yet had a short-term trend, but in the long-term, gold prices are still in an upward trend, which is noted by the price channel.
Finally, the notable positions will be listed as follows.
Support: 3,300 – 3,292 – 3,250USD
Resistance: 3,350 – 3,371 – 3,400USD
SELL XAUUSD PRICE 3334 - 3332⚡️
↠↠ Stop Loss 3338
→Take Profit 1 3326
↨
→Take Profit 2 3320
BUY XAUUSD PRICE 3275 - 3277⚡️
↠↠ Stop Loss 3271
→Take Profit 1 3283
↨
→Take Profit 2 3289

Lingrid | EURUSD Bullish Trend ContinuesFX:EURUSD is holding a bullish structure inside an upward channel after bouncing from the 1.1670 demand zone. The current retracement appears corrective, and buyers may step in again near the confluence of the trendline and horizontal support. If confirmed, the price is expected to push toward the 1.1885 resistance and the upper channel target at 1.1900.
📈 Key Levels
Buy zone: 1.1650–1.1680 (trendline + key support)
Sell trigger: break below 1.1600
Target: 1.1885 – 1.1900 zone
Buy trigger: bullish reversal candle near 1.1700
💡 Risks
Failure to hold trendline support could lead to deeper retracement
1.1885 may cap upside if momentum fades
Bearish divergence could emerge if price surges too fast
If this idea resonates with you or you have your own opinion, traders, hit the comments. I’m excited to read your thoughts!

Lingrid | USDJPY Pullback From the Key Resistance ZoneThe price perfectly fulfilled my previous idea . FX:USDJPY is moving inside an upward channel after reclaiming support near 145.25 and breaking out from its previous range. The pair printed a higher low and is now approaching resistance around 146.78, testing the upper boundary of the ascending channel. If it fails to break through the red resistance trendline, a retracement toward the 145.25–145.00 support is likely.
📈 Key Levels
Buy zone: 146.78 - 147.00
Sell trigger: rejection from 146.78 and lower high below resistance
Target: 145.25
Buy trigger: bullish breakout above 147.00 with momentum confirmation
💡 Risks
Price rejection near 146.78 may cause a sharp pullback
A surge above 147.00 breaks trendline structure
Market reaction to macro data could distort short-term pattern
If this idea resonates with you or you have your own opinion, traders, hit the comments. I’m excited to read your thoughts!

WTI OIL Best scalping opportunity at the moment!WTI Oil (USOIL) has been consolidating inside a ranged trading set-up, with the 4H MA100 (green trend-line) as its Resistance and the 4H MA200 (orange trend-line) as its Support.
We saw this previously from May 13 to June 01 and it presents the best scaling opportunity in the market at the moment. That previous Ranged Trading pattern eventually broke upwards as the Higher Lows trend-line held.
As a result, after you get your scalping profits within this range, look for a clear break-out above the 4H MA100 (candle closing) in order to go long (Resistance 1) or a break-out below the Higher Lows (candle closing) in order to go short (Support 1).
-------------------------------------------------------------------------------
** Please LIKE 👍, FOLLOW ✅, SHARE 🙌 and COMMENT ✍ if you enjoy this idea! Also share your ideas and charts in the comments section below! This is best way to keep it relevant, support us, keep the content here free and allow the idea to reach as many people as possible. **
-------------------------------------------------------------------------------
Disclosure: I am part of Trade Nation's Influencer program and receive a monthly fee for using their TradingView charts in my analysis.
💸💸💸💸💸💸
👇 👇 👇 👇 👇 👇

S&P500 Strong Buy Signal flashed for the 3rd time in 2 years!The S&500 index (SPX) is comfortably trading above its previous All Time High (ATH) and shows no signs of stopping here. Coming off a 1D MA50/ 100 Bullish Cross, we expect the 1D MA50 (blue trend-line) to turn now into the first long-term Support going towards the end of the year.
The last 1D MA50/ 100 Bullish Cross (December 15 2023) was nothing but a bullish continuation signal, which extended the uptrend all the way to the 2.0 Fibonacci extension, before a pull-back test of the 1D MA100 (green trend-line) again.
The 1W RSI is now on the same level (63.30) it was then. In fact it is also on the same level it was on June 05 2023, which was another such bullish continuation signal that peaked on the 2.0 Fib ext.
This suggests that we have a rare long-term Buy Signal in our hands, only the 3rd time in 2 years that has emerged. Based on that, we should be expecting to see 7600 as the next Target before it hits the 2.0 Fib ext and pulls back to the 1D MA100 again and there is certainly enough time to do this by the end of the year, assuming the macroeconomic environment favors (trade deals, potential Fed Rate cuts etc).
-------------------------------------------------------------------------------
** Please LIKE 👍, FOLLOW ✅, SHARE 🙌 and COMMENT ✍ if you enjoy this idea! Also share your ideas and charts in the comments section below! This is best way to keep it relevant, support us, keep the content here free and allow the idea to reach as many people as possible. **
-------------------------------------------------------------------------------
Disclosure: I am part of Trade Nation's Influencer program and receive a monthly fee for using their TradingView charts in my analysis.
💸💸💸💸💸💸
👇 👇 👇 👇 👇 👇

Trading balanceTrading balance The price of the asset has rebounded from the balance zone. With the prospect of growth into the resistance zone.

BITCOIN Is there enough time for another parabolic rally?Bitcoin (BTCUSD) is practically consolidating on the short-term, having just recently been rejected off its new All Time High (ATH). Despite the short-term volatility, the long-term outlook is still a very strong, structured uptrend, a Channel Up pattern that is now technically aiming for its next Higher High.
Incredibly enough, this Channel Up since the November 2022 market bottom, has been almost entirely within the Buy Zone (green) of the Fibonacci Channel Up going back all the way to April 2013!
As you can see during the previous two Cycles, every time BTC got above that Buy Zone, it started a parabolic rally. So far, we haven't got such rally on the current Cycle and with time running out (assuming the 4-year Cycle model continues to hold), do you think we will get one this time around?
Feel free to let us know in the comments section below!
-------------------------------------------------------------------------------
** Please LIKE 👍, FOLLOW ✅, SHARE 🙌 and COMMENT ✍ if you enjoy this idea! Also share your ideas and charts in the comments section below! This is best way to keep it relevant, support us, keep the content here free and allow the idea to reach as many people as possible. **
-------------------------------------------------------------------------------
💸💸💸💸💸💸
👇 👇 👇 👇 👇 👇

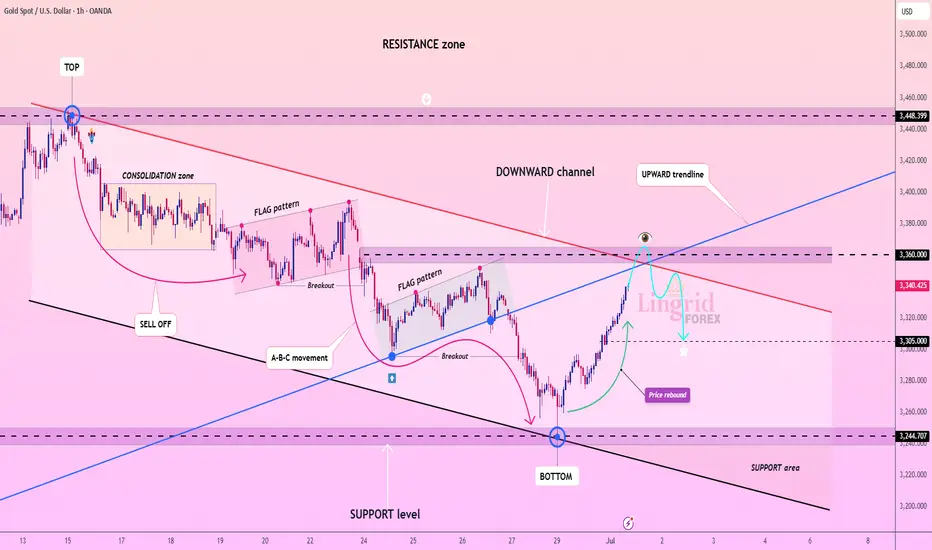
Lingrid | GOLD Shorting Opportunity at Confluence ResistanceOANDA:XAUUSD is approaching the key resistance near 3360 after rebounding from the 3245 support level and breaking out of the downward channel. Price is now testing the upward trendline from below, intersecting with the red descending trendline and horizontal resistance. If this confluence zone rejects the rally, a return toward 3305 or lower is likely, forming a potential bearish retest.
📉 Key Levels
Sell zone: 3350–3360
Buy trigger: breakout above 3360 with close above 3375
Target: 3305
Sell trigger: rejection from 3360 and break of 3340
⚠️ Risks
Break and retest of 3360 may invalidate short setup
Volatility around red trendline could trigger fakeouts
Demand near 3305 may cause sharp bounces if sellers stall
If this idea resonates with you or you have your own opinion, traders, hit the comments. I’m excited to read your thoughts!