EUR-AUD Bullish Breakout! Buy!
Hello,Traders!
EUR-AUD made a bullish
Breakout of the falling resistance
And the breakout is confirmed
So we are bullish biased
And we will be expecting
A further bullish move up
On Monday!
Buy!
Comment and subscribe to help us grow!
Check out other forecasts below too!
Disclosure: I am part of Trade Nation's Influencer program and receive a monthly fee for using their TradingView charts in my analysis.
Signals

GOLD: Target Is Down! Short!
My dear friends,
Today we will analyse GOLD together☺️
The market is at an inflection zone and price has now reached an area around 3,353.10 where previous reversals or breakouts have occurred.And a price reaction that we are seeing on multiple timeframes here could signal the next move down so we can enter on confirmation, and target the next key level of 3,335.20..Stop-loss is recommended beyond the inflection zone.
❤️Sending you lots of Love and Hugs❤️

AUD-USD Will Go Down! Sell!
Hello,Traders!
AUD-USD is trading in a
Downtrend and the pair
Broke the key horizontal
Level of 0.6470 which is
Now a resistance then
Made a retest and a
Confident pullback which
Reinforces our bearish
Bias and makes us expect
A further bearish move down
Sell!
Comment and subscribe to help us grow!
Check out other forecasts below too!
Disclosure: I am part of Trade Nation's Influencer program and receive a monthly fee for using their TradingView charts in my analysis.

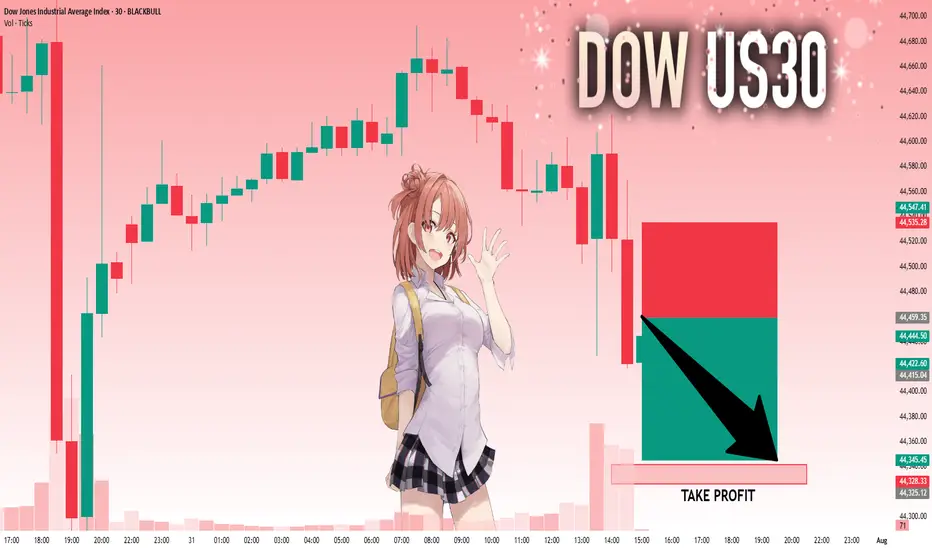
US30: Absolute Price Collapse Ahead! Short!
My dear friends,
Today we will analyse US30 together☺️
The in-trend continuation seems likely as the current long-term trend appears to be strong, and price is holding below a key level of 44,459.35 So a bearish continuation seems plausible, targeting the next low. We should enter on confirmation, and place a stop-loss beyond the recent swing level.
❤️Sending you lots of Love and Hugs❤️
SILVER: Will Go Down! Short!
My dear friends,
Today we will analyse SILVER together☺️
The market is at an inflection zone and price has now reached an area around 36.490 where previous reversals or breakouts have occurred.And a price reaction that we are seeing on multiple timeframes here could signal the next move down so we can enter on confirmation, and target the next key level of 36.231..Stop-loss is recommended beyond the inflection zone.
❤️Sending you lots of Love and Hugs❤️

EURUSD: The Market Is Looking Up! Long!
My dear friends,
Today we will analyse EURUSD together☺️
The price is near a wide key level
and the pair is approaching a significant decision level of 1.14350 Therefore, a strong bullish reaction here could determine the next move up.We will watch for a confirmation candle, and then target the next key level of 1.14588.Recommend Stop-loss is beyond the current level.
❤️Sending you lots of Love and Hugs❤️

GOLD: Strong Bullish Sentiment! Long!
My dear friends,
Today we will analyse GOLD together☺️
The recent price action suggests a shift in mid-term momentum. A break above the current local range around 3,296.556 will confirm the new direction upwards with the target being the next key level of 3,310.375 and a reconvened placement of a stop-loss beyond the range.
❤️Sending you lots of Love and Hugs❤️

XAUUSD Update – Down Continuation to 3250?1. What Happened Yesterday
After an anemic correction that formed a bearish flag, Gold finally broke below 3300 and even dipped under the 3280 support zone — which was my primary downside target. While the move during the day didn’t have enough momentum to reach my second sell limit, I was already in a low-volume short position, so I didn’t miss the move entirely.
2. The Key Question
Has the drop ended, or are we looking at further downside?
3. Why I Expect More Downside
• The overall structure remains bearish.
• The newly formed resistance (previous support) is now the new sell zone.
• If the price drops towards 3280 again, continuation to 3250 becomes very probable.
4. Trading Plan
Selling rallies remains the preferred strategy, especially on spikes into resistance. As long as the price stays below 3335-3340 zone, the bearish outlook remains intact.
5. Conclusion
Sell the rallies. The technical picture still favors downside continuation — no need to overcomplicate it. 🚀
Disclosure: I am part of TradeNation's Influencer program and receive a monthly fee for using their TradingView charts in my analyses and educational articles.
Fibonacci Arcs in Stock TradingFibonacci Arcs in Stock Trading
Fibonacci arcs, derived from the renowned Fibonacci sequence, offer a compelling blend of technical analysis and market psychology for traders. By mapping potential support and resistance areas through arcs drawn on stock charts, these tools provide insights into future price movements. This article delves into the practical applications of Fibonacci arcs in trading, their interplay with market psychology, and best practices for effective use.
Understanding Fibonacci Arcs
The Fibonacci arc indicator is a unique tool in technical analysis derived from the famed Fibonacci sequence. It’s crafted by drawing arcs at the key Fibonacci retracement levels - 38.2%, 50%, and 61.8% - from a high to a low point on a stock chart. Each curve represents potential support or resistance areas, offering insights into the stock’s future movements.
The art of arc reading, meaning interpreting these curves, is crucial for traders. When a stock approaches or intersects with an arc, it reflects a significant reaction level. For instance, if a stock price touches or nears an arc, it could face arc resistance, indicating a potential halt or reversal in its trend.
Applying Fibonacci Arcs in Trading
In the stock market, these arcs serve as a guide for traders seeking to anticipate future price movements. When applied correctly, they can provide critical insights into potential support and resistance levels. Here's a step-by-step look at how you may use them effectively:
- Identifying High and Low Points: Begin by selecting a significant high and low point on the stock's chart. In an uptrend, it’s the most recent swing high to a previous swing low, and vice versa. These are the anchor points.
- Drawing the Arcs: Once the points are selected, draw the arcs at the Fibonacci retracement levels of 38.2%, 50%, and 61.8%. They radiate from the chosen low point to the high point (or vice versa), cutting across the chart.
- Interpretation: Watch how the stock interacts with these lines. When the price approaches an arc, it might encounter resistance or support, signalling a potential change in trend or continuation.
- Timing Entries and Exits: Traders can use the arcs in the stock market as a tool to time their trading decisions. For instance, a bounce could be a signal to enter a trade, whereas the price breaking through might suggest it's time to exit.
Fibonacci Arcs and Market Psychology
The effectiveness of Fibonacci arcs in trading is deeply intertwined with market psychology. They tap into the collective mindset of traders, who often react predictably to certain price levels. The Fibonacci sequence, underlying this tool, is not just a mathematical concept but also a representation of natural patterns and human behaviour.
When a stock nears a curve, traders anticipate a reaction, often leading to a self-fulfilling prophecy. If many traders make an arc stock forecast, they might sell as the price approaches a certain point, causing the anticipated resistance to materialise. Similarly, seeing support at an arc can trigger buying, reinforcing the tool’s power.
This psychological aspect makes Fibonacci arcs more than just technical tools. They are reflections of the collective expectations and actions of market participants, turning abstract mathematical concepts into practical indicators of market sentiment and potential movements.
Best Practices
Incorporating Fibonacci arcs into trading strategies involves nuanced techniques for better accuracy and efficacy. Here are some best practices typically followed:
- Complementary Tools: Traders often pair this tool with other indicators like moving averages or RSI for a more robust analysis.
- Accurate Highs and Lows: It's best to carefully select the significant high and low points, as the effectiveness of the curves largely depends on these choices.
- Context Consideration: Understanding the broader market context is crucial. Traders usually use Fibonacci arcs in conjunction with fundamental factors to validate their analysis.
- Watch for Confluence: Identifying areas where Fibonacci levels converge with other technical signals can provide stronger trade setups.
- Practice Patience: Traders typically avoid making hasty decisions based solely on Fibonacci levels. It's usually better to wait to see additional confirmation from the price action.
Advantages and Limitations of Fibonacci Arcs
Fibonacci arcs are a popular tool in technical analysis, offering distinct advantages and some limitations in analysing stock movements. Understanding these can help traders leverage the tool more effectively.
Advantages
- Intuitive Nature: The Fibonacci sequence is a natural pattern, making the tool intuitive for traders to understand and apply.
- Dynamic Support and Resistance Levels: They provide dynamic levels of support and resistance, unlike static lines, adapting to changing market conditions.
- Versatility: Effective in various market conditions, the arcs can be used in both trending and sideways markets.
Limitations
- Subjectivity in Selection: The effectiveness largely depends on correctly identifying the significant high and low points, which can be subjective.
- Potential False Signals: Like all technical tools, they can generate false signals, especially in highly volatile markets.
- Requires Complementary Analysis: To maximise effectiveness, these curves are usually used alongside other technical indicators, as they are not infallible on their own.
The Bottom Line
Fibonacci arcs are invaluable tools in stock analysis, providing insights into market trends and potential price movements.
This article represents the opinion of the Companies operating under the FXOpen brand only. It is not to be construed as an offer, solicitation, or recommendation with respect to products and services provided by the Companies operating under the FXOpen brand, nor is it to be considered financial advice.
USDCAD Update: Don’t Sleep on This Uptrend’s First LegYo traders, Skeptic from Skeptic Lab here! 🚀 USDCAD’s serving a hot long trigger for pattern traders chasing the first leg of a big uptrend! We’ve got an ascending triangle breakout on the daily, with bullish candles stacking up, hinting at a return to the weekly bullish trend. Too early to confirm, but the momentum’s fire.
📈 Today’s FOMC meeting’s got everyone buzzing—will Powell cut, hold, or drop resignation hints? Check the full setup in the video, but with crazy news like Federal Funds Rate
, s tick to high-probability trades, keep risk low, and no FOMO or revenge trading! Drop your thoughts, boost if it vibes <3

GBPUSD: Strong Trend-Following Pattern 🇬🇧🇺🇸
GBPUSD is going to drop lower.
The market has completed a correctional movement within
a bearish flag.
Its support violation provides a strong bearish confirmation.
I expect a drop to 1.3202 level.
❤️Please, support my work with like, thank you!❤️
I am part of Trade Nation's Influencer program and receive a monthly fee for using their TradingView charts in my analysis.

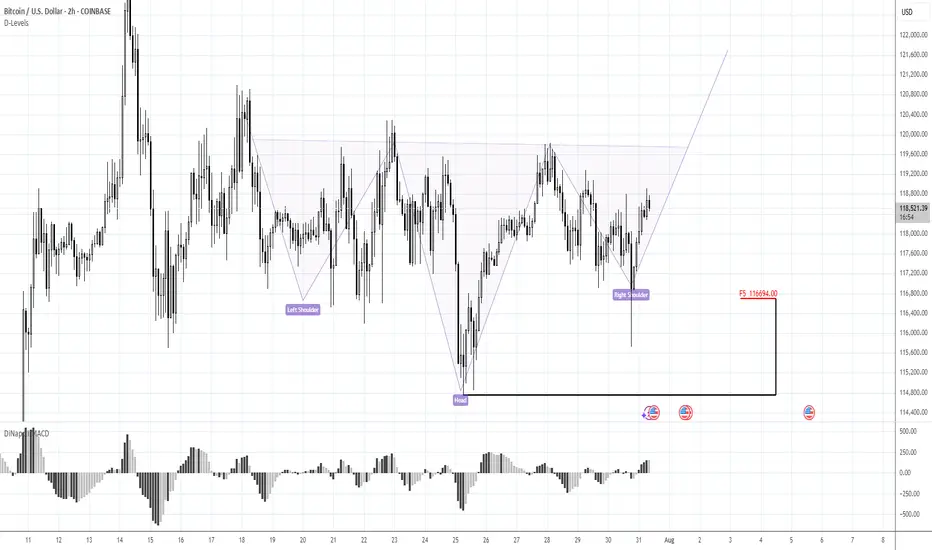
Keep following to the H&S PatternMorning folks,
To be honest, not too many things to talk about. We've prepared our scenario with H&S is still valid. Reaction to GDP numbers was quite welcome as it set the right arm's bottom. The only thing that we have to be busy with is to control its validity - reaching of the neckline and price standing above 116 lows and right arm.
At the first signs that market is start falling back - do not take any new longs. H&S failure is also the pattern and in this case we get deeper correction. But daily chart still makes me think that bullish context is here
GOLD Will Go Higher From Support! Buy!
Here is our detailed technical review for GOLD.
Time Frame: 12h
Current Trend: Bullish
Sentiment: Oversold (based on 7-period RSI)
Forecast: Bullish
The market is testing a major horizontal structure 3,311.57.
Taking into consideration the structure & trend analysis, I believe that the market will reach 3,369.04 level soon.
P.S
The term oversold refers to a condition where an asset has traded lower in price and has the potential for a price bounce.
Overbought refers to market scenarios where the instrument is traded considerably higher than its fair value. Overvaluation is caused by market sentiments when there is positive news.
Disclosure: I am part of Trade Nation's Influencer program and receive a monthly fee for using their TradingView charts in my analysis.
Like and subscribe and comment my ideas if you enjoy them!

USDCHF Will Go Down From Resistance! Short!
Take a look at our analysis for USDCHF.
Time Frame: 9h
Current Trend: Bearish
Sentiment: Overbought (based on 7-period RSI)
Forecast: Bearish
The market is approaching a key horizontal level 0.813.
Considering the today's price action, probabilities will be high to see a movement to 0.806.
P.S
We determine oversold/overbought condition with RSI indicator.
When it drops below 30 - the market is considered to be oversold.
When it bounces above 70 - the market is considered to be overbought.
Disclosure: I am part of Trade Nation's Influencer program and receive a monthly fee for using their TradingView charts in my analysis.
Like and subscribe and comment my ideas if you enjoy them!

AUDUSD Will Go Lower! Sell!
Please, check our technical outlook for AUDUSD.
Time Frame: 9h
Current Trend: Bearish
Sentiment: Overbought (based on 7-period RSI)
Forecast: Bearish
The market is approaching a significant resistance area 0.645.
Due to the fact that we see a positive bearish reaction from the underlined area, I strongly believe that sellers will manage to push the price all the way down to 0.637 level.
P.S
Overbought describes a period of time where there has been a significant and consistent upward move in price over a period of time without much pullback.
Disclosure: I am part of Trade Nation's Influencer program and receive a monthly fee for using their TradingView charts in my analysis.
Like and subscribe and comment my ideas if you enjoy them!

GBPUSD slipping fast – Is 1.30 the next magnet?Hey traders, what’s your take on GBPUSD today?
Overall, the pair is deepening its bearish trend after losing the key 1.3400 level. At the time of writing, GBPUSD is hovering around 1.3272 with no signs of a short-term bottom in sight.
The main catalyst for this drop is the strong bullish momentum of the U.S. dollar. A series of upbeat U.S. economic data – including jobs reports, personal consumption expenditures (PCE), and consumer confidence – all exceeded expectations, fueling USD strength. Meanwhile, the Bank of England (BoE) remains cautious amid slowing growth and cooling inflation, offering little support for the pound.
From a technical perspective, momentum has clearly shifted in favor of the bears. Price remains pressured below both the 34 and 89 EMAs, confirming strong downside momentum. The previous break below the rising trendline and failure to hold above the prior support zone – around the 0.5–0.618 Fibonacci retracement – further supports the ongoing bearish bias.
Looking ahead, if the selling pressure continues and the current support gives way, GBPUSD could fall toward the 1.272 Fibonacci extension at 1.3129. If that level fails to hold, 1.3004 (Fibo 1.618) becomes the next key downside target. These are crucial zones to monitor for potential price reactions in the coming sessions.
In short, the probability of further downside is higher than a meaningful recovery. With both technical and macro forces favoring the bears, GBPUSD may remain under pressure in the days ahead – unless a strong catalyst from the UK emerges to shift sentiment. What’s your outlook on this scenario? Let’s discuss in the comments below!

GOLD Will Move Lower! Sell!
Here is our detailed technical review for GOLD.
Time Frame: 9h
Current Trend: Bearish
Sentiment: Overbought (based on 7-period RSI)
Forecast: Bearish
The market is testing a major horizontal structure 3,337.68.
Taking into consideration the structure & trend analysis, I believe that the market will reach 3,280.02 level soon.
P.S
The term oversold refers to a condition where an asset has traded lower in price and has the potential for a price bounce.
Overbought refers to market scenarios where the instrument is traded considerably higher than its fair value. Overvaluation is caused by market sentiments when there is positive news.
Disclosure: I am part of Trade Nation's Influencer program and receive a monthly fee for using their TradingView charts in my analysis.
Like and subscribe and comment my ideas if you enjoy them!

Lingrid | GBPAUD Bearish Pressure. Potential ShortThe price perfectly fulfilled my previous idea . FX:GBPAUD rebounded from support and has climbed into a tight resistance zone near 2.05836, but momentum remains weak near the downward trendline. The price structure shows a sequence of lower highs and a tight range below resistance, suggesting sellers are still in control. A rejection at this level would confirm another failed breakout attempt. If confirmed, the pair could revisit the 2.03500 support area with bearish continuation pressure.
📌 Key Levels
Sell trigger: Rejection at 2.05836 and break of 2.05000
Sell zone: 2.05800–2.06000
Target: 2.03500
Invalidation: Strong break and close above 2.06000
💡 Risks
Bullish breakout above trendline resistance
Fundamental surprise (UK/AU economic data)
Shift in broader risk sentiment or AUD weakness
If this idea resonates with you or you have your own opinion, traders, hit the comments. I’m excited to read your thoughts!

Lingrid | DOGEUSDT Pullback and Continuation OpportunityBINANCE:DOGEUSDT is currently testing the intersection of its upward channel support and a critical horizontal zone near 0.21378, after a steep corrective decline from the 0.28628 resistance area. The recent price action formed a rounded pullback, suggesting potential accumulation near trendline confluence. A bullish bounce here could trigger a strong rally toward 0.26350 as shown by the projected upward path. Failure to hold the 0.21000 area would expose the pair to deeper downside toward the 0.15706 support.
📌 Key Levels
Buy zone: 0.21000–0.21700
Buy trigger: Break and close above 0.23000
Target: 0.26350
Invalidation: Break below 0.21000
⚠️ Risks
Breakdown of ascending trendline support
Weak volume on upward breakout
Broader market weakness impacting altcoins
If this idea resonates with you or you have your own opinion, traders, hit the comments. I’m excited to read your thoughts!

EURUSD breakdown alert – Will the drop accelerate?Hello traders, let’s take a look at how EURUSD is performing today!
Yesterday, EURUSD extended its downward slide after failing to sustain bullish momentum from the 1.1600 zone. The pair is now hovering around 1.1426.
The recent decline is largely attributed to the strength of the US dollar, which continues to benefit from a series of upbeat economic data – including robust job reports, strong consumer spending, and improving sentiment. All of these came in above expectations, pushing the dollar higher. In contrast, the European Central Bank (ECB) maintains a cautious stance, with no clear signals of policy changes – leaving the euro under persistent pressure.
From a technical standpoint, the short-term outlook suggests the beginning of a new bearish wave. Notably, price action is reacting to resistance from the nearby EMA 34 and EMA 89 levels. The break below the recent support zone has added fuel to the ongoing bearish momentum.
If the current support fails to hold, EURUSD could slip further toward the 1.272 Fibonacci extension at 1.1305, and potentially as low as 1.1178 – the 1.618 extension level.
Looking ahead, traders should focus on potential pullback opportunities, targeting SELL entries around 1.1540–1.1580 – a confluence zone of technical interest. However, if price breaks above the 1.1600 threshold and holds, this bearish scenario may be invalidated.
What’s your outlook for EURUSD in the coming days? Share your thoughts in the comments below!

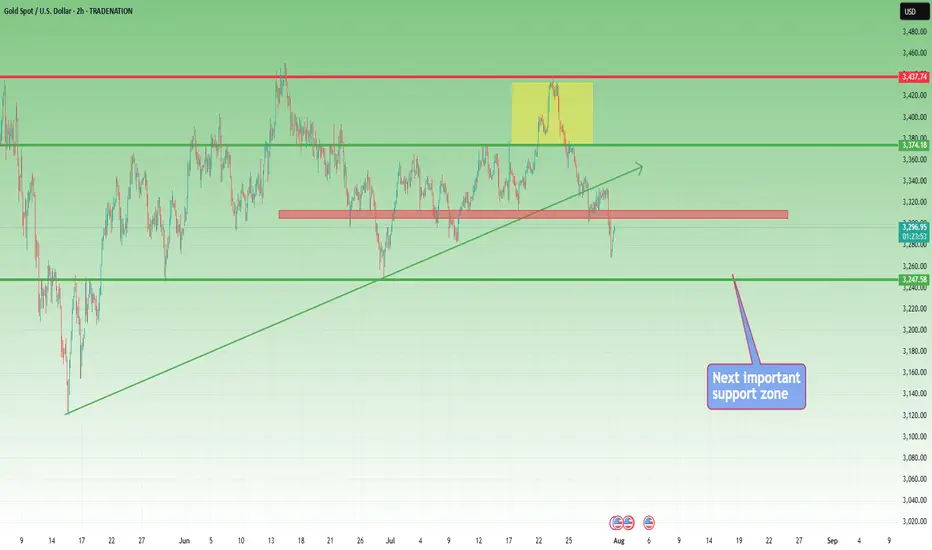
Gold is Falling Sharply – Will It Keep Falling?Hello dear traders, what’s your view on XAUUSD?
Yesterday, XAUUSD continued its strong downtrend and is now trading around 3,296 USD.
The recent drop in gold is largely due to the strengthening U.S. dollar, following the Federal Reserve’s decision to hold interest rates steady as expected — despite sharp criticism from President Donald Trump.
Technically speaking, after breaking below the rising trendline, gold failed to retest successfully and plunged further, confirming that the bearish trend is now in control. Price is currently moving below key moving averages, and the structure has clearly formed a sequence of lower highs and lower lows — reinforcing the likelihood of continued downside.
If a pullback occurs before the next leg down, the Fibonacci 0.5 and 0.618 retracement zone — which aligns with the EMA 34 and 89 and a major resistance level — will be a key area to watch. This could present a prime opportunity for breakout and trend-following traders.
Looking ahead, the next key support sits near 3,220 USD. If this level breaks, gold may head toward the 3,162 USD zone.
What do you think? Will gold keep falling, or will buyers step in? Drop a comment and hit follow to catch the next big move!

Closed Longs, Now Selling Rallies on EURUSD ReversalAs mentioned in my previous posts, I’m been bullish on EURUSD in the medium term, targeting 1.20 and even beyond.
But no pair—especially not EURUSD, which tends to move more steadily and rationally—goes up in a straight line.
________________________________________
🔹 Last week, the pair stalled just below 1.18, and I decided to close my long trade with a +150 pip gain. That proved to be a wise call, as price dropped hard shortly after.
________________________________________
📉 What’s happening now?
• EURUSD has broken below the rising trendline
• More importantly, it’s broken below the neckline of a double top pattern
• Now trading around 1.1535
This opens the door for a deeper correction, and I expect we could see a test of the 1.1150–1.1100 zone by the end of summer.
________________________________________
📌 Trading Plan:
• I’m now in sell-the-rally mode
• Ideal short entry: around 1.1650, where we also get a favorable 1:3+ risk-reward
• Watch also for interim support around 1.1400
________________________________________
Conclusion:
The bigger picture remains bullish— but this correction looks healthy and isn’t done yet.
Selling rallies makes more sense now, until the structure tells us otherwise.
Disclosure: I am part of TradeNation's Influencer program and receive a monthly fee for using their TradingView charts in my analyses and educational articles.

Gold Weekly Outlook (XAUUSD) -28th JulyGold Enters a High-Stakes Week
This week sets the stage for major moves in gold. The charts are signalling liquidity grabs, premium compression, and volatility driven by upcoming macro catalysts.
Key events ahead:
Tuesday: ADP Employment Data
Wednesday: The Fed
Gold is currently consolidating beneath a critical supply zone, suggesting potential for a breakout or rejection. We'll align macro drivers with Smart Money Concepts, ICT methodology, Fibonacci levels, EMAs, RSI, and Fair Value Gaps to craft a precise trading framework.
Technically, price action reflects a corrective phase within a broader uptrend. Confluence support from the ascending trendline and a key horizontal level is in play. As long as price remains above 3342, a bounce toward 3400 remains the preferred scenario.
The broader bullish structure and underlying momentum suggest that once this retracement completes, the uptrend may resume with strength.
🟡 – Summary
🔹 Macro & HTF View:
Bias: Bullish but weakening under premium supply
Key Events: ADP (Tue), FOMC (Wed) → potential for liquidity grabs
Indicators:
RSI divergence (75 → 66)
EMAs flattening
Unfilled FVGs above (3365–3405) and below (3280–3320)
Key Fib targets: 3405 (127%) and 3439 (161.8%)
🔸 Weekly Key Zones
Supply (Short Trap): 3350–3439 → heavy confluence, short bias unless W1 closes above 3439
Primary Demand: 3220–3285 → ideal for news-driven long
Deep Discount (Long Only if Panic): 2960–3050
🎯 Strategy Summary
Short Setup:
Target 3350–3439 → wait for rejection after news
Long Setup:
Target 3220–3285 or deeper
Look for wick rejections + bullish structure reclaim
Avoid: 3285–3350 → indecision zone
🧭 Daily Zones
Sell Zone: 3345–3415 → trap area with FVG + Fib + EMA confluence
Buy Zones:
3290–3320 (primary)
3240–3270 (deeper)
3000–3140 (only if USD spikes)
⏱ H4 + Intraday Bias
Bias: Bearish below 3350
Short Zones:
3365–3405 (rejection only)
3355 (flip zone)
Buy Zones:
3290–3310 (reclaim setup)
3250–3280 (panic flush)
📌 Key Intraday Levels
Resistance: 3405, 3385, 3375–3350, 3350–3340
Support: 3314–3302, 3289–3272, 3260, 3240
⚠️ Final Execution Notes
Stay out of 3340–3326 zone – it’s chop
Wait for confirmation candles (engulfing, pin bars, OB reactions)
Discipline over prediction. Sniper mode only.
Disclaimer: For educational context only.
