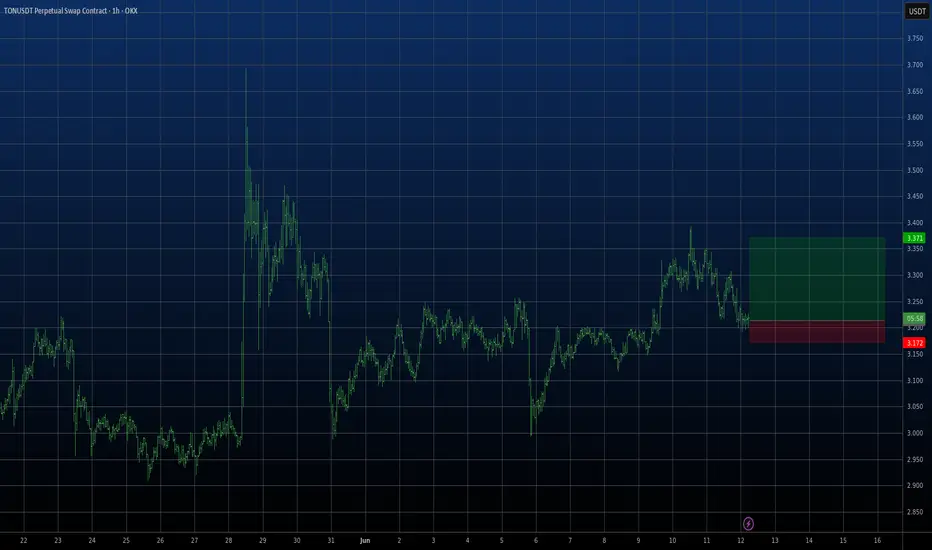
Good moment for Buy TONGood moment for Buy TON. We have small local down trend channel, but also it is low level of current "big" up trend channel. And this point can be used for good entry with good risk reward ration. Stop below of local down channel. Will see...
Signals
TESLA Will Fall! Sell!
Hello,Traders!
TESLA went up from the
Horizontal support but has
Hit a horizontal resistance
Of 335$ and we are already
Seeing a bearish pullback
So we will be expecting
A further local move down today
Sell!
Comment and subscribe to help us grow!
Check out other forecasts below too!
Disclosure: I am part of Trade Nation's Influencer program and receive a monthly fee for using their TradingView charts in my analysis.

Fakeout or Takeoff? Gold Retakes 3350 Before NY Close1. Recap of Yesterday's Move
Yesterday was a volatile day for Gold. Price initially broke above the key 3340–3350 resistance zone, only to drop back below it—but intriguingly, it closed above it on the New York session. That close is the detail that changes everything.
2. Key Question: Will Gold Stay Above 3400 and Push Toward New ATHs?
Let’s split this into two scenarios:
________________________________________
🟢 Bullish Scenario – Buy the Dip?
• The short-term structure is undeniably bullish.
• The reclaim of 3340–3350 is not a fakeout, but a clean signal of strength.
• If momentum holds, we can expect price to push toward 3405 and then 3435.
• As such, the strategy remains: buy dips, targeting those key levels.
________________________________________
🟡 Long-Term Breakout? Not So Fast
• Yes, the higher lows at 3120, 3250, and 3295 suggest that the correction from 3500 may be over.
• A clean breakout and stabilization above 3400, ideally near 3430, could signal a path toward a new all-time high.
• ❗ However, volatility remains wild, and if geopolitical tensions de-escalate or trade tariffs get resolved, Gold could see a sharp drop of 1500–2000 pips, as part of a broader risk-off unwind. Peace and stability could hurt safe-haven demand.
________________________________________
📌 Trading Plan
• Short-term: Buy dips while above 3340-3350 (ideally on a re-test), aiming for 3405 and 3435.
• Long-term: Stay flexible. Wait for confirmation above 3430 before going for the ATH narrative.
________________________________________
💡 Conclusion
Technically, Gold is bullish in both the short and long term. But with global uncertainty in play, don't ignore the fundamentals. Trade the chart, but respect the world around it. 🚀
Disclosure: I am part of TradeNation's Influencer program and receive a monthly fee for using their TradingView charts in my analyses and educational articles.

CAD_CHF STRONG SUPPORT AHEAD|LONG|
✅CAD_CHF will be retesting a support
Level soon around 0.5920
From where I am expecting a bullish reaction
With the price going up but we need
To wait for a reversal pattern to form
Before entering the trade, so that we
Get a higher success probability of the trade
LONG🚀
✅Like and subscribe to never miss a new idea!✅
Disclosure: I am part of Trade Nation's Influencer program and receive a monthly fee for using their TradingView charts in my analysis.

AUD-CHF Free Signal! Buy!
Hello,Traders!
AUD-CHF fell down sharply
But the pair will soon hit a
Horizontal support level
Of 0.5281 from where we
Can go long with the
Take Profit of 0.5312
And the Stop Loss of 0.5273
Buy!
Comment and subscribe to help us grow!
Check out other forecasts below too!
Disclosure: I am part of Trade Nation's Influencer program and receive a monthly fee for using their TradingView charts in my analysis.

ATOM. Massive Liquidity Grab Incoming. 06/12/25BINANCE:ATOMUSDT At the moment, the price is in an accumulation phase.
The buyer interest zone lies between $3.806 – $3.601, which also serves as a strong support area. We may see solid spot/futures entries here and the potential start of a new upward move.
What we’re really waiting for is liquidity to be swept in this zone — where tons of stop-losses have clustered. Such a shakeout would be a perfect setup for a bullish impulse.
Spot/futures accumulation is valid within this zone.
DYOR.

BNB 1D Ready to Explode? This Chart Says YES. 06/12/25BINANCE:BNBUSDT is forming a tight consolidation right below key resistance at $710, inside a triangle structure. Every dip into the $655–$625 support zone gets quickly bought up — showing strong buyer interest and accumulation.
Price is compressing inside the triangle with higher lows, indicating bullish pressure. A breakout above $710 would likely trigger a strong move toward $770–$780, and potentially a new ATH > $800.
As long as $625 holds — I'm bullish. I expect one more sweep of support before an explosive breakout.
Spot/futures entries: $655–$625
Targets: $710 → $780 → $820+
Invalidation: Daily close below $625.

1INCH 1D. Showing Signs of Accumulation. 06/12/25BINANCE:1INCHUSDT There's growing media and social media attention around the 1INCH project, which could be a bullish sentiment trigger.
Currently, the price is trading within a descending channel and has recently bounced from the lower boundary, signaling a potential long entry or spot accumulation opportunity.
From current levels, I expect a clean 2x upside on spot. Personally, I think it's worth starting to scale in carefully on spot or futures.
However, keep in mind — even after a bounce, price could still dip slightly lower before any meaningful move up. A deeper correction remains a possibility, so always factor in risk.
📌 Key Takeaways:
• Long bias from current levels
• Potential 2x on spot
• Further dip possible — manage risk accordingly
DYOR. Stay sharp.

NZD_JPY WILL KEEP GROWING|LONG|
✅NZD_JPY is trading along
The rising support line
And as the pair is going up now
After the retest of the line
I am expecting the price to keep growing
To retest the supply levels above at 87.429
LONG🚀
✅Like and subscribe to never miss a new idea!✅
Disclosure: I am part of Trade Nation's Influencer program and receive a monthly fee for using their TradingView charts in my analysis.

Lingrid | GBPJPY potential Extension after Bullish BreakoutOANDA:GBPJPY is consolidating just above the key support around 195.05 after bouncing from a higher low and failing to hold the recent breakout above PMH. The bullish structure remains intact within the upward channel, but the pair is currently lacking momentum. If price holds above 195.00 and forms a new bullish wave, a push toward 198.00 remains likely.
📈 Key Levels
Buy zone: 194.80–195.20
Buy trigger: bullish confirmation above 195.60
Target: 198.00
Sell trigger: break below 194.80 with strong volume
💡 Risks
Failure to hold 195 could shift structure to neutral
Extended range may lead to choppy conditions
Yen strength could trigger sudden reversals from resistance
Traders, if you liked this idea or if you have your own opinion about it, write in the comments. I will be glad 👩💻

SOL 1D. Price Action Suggests a Bullish Move. 12/06/25BINANCE:SOLUSDT
The current price action looks bullish, and it's likely we’ll see a push toward the $170–$180 range without major pullbacks. I’ve outlined a potential path on the chart reflecting short-term expectations.
However, if the broader market experiences a correction, there's no reason we couldn't see a retracement to the 0.5–0.618 Fibonacci levels. For that reason, it's wise to have limit orders set just in case.
Entry Points (EP):
• Market
• $140.25
• $123.41
Take Profit (TP):
• $175.28
• $183.42
• $208.90
⚠️ This is not financial advice. Just my personal outlook based on current structure.
Please do your own research and remember: your decisions are your responsibility.
Stick to your risk management plan, and never risk more than 2% of your portfolio per trade.
Wishing everyone green candles and solid gains!
DYOR.

DOGE 1D: Missed PEPE? Don’t Miss DOGE 06/12/25BINANCE:DOGEUSDT
I’m expecting a continuation of the upward movement and a possible trend reversal.
There’s a chance we’ll revisit the 0.618 Fib level to shake out weak hands — a classic move before liftoff.
Looking at the chart, it really feels like altseason is closer than anyone expects. DOGE may lead the charge.
Entry Points (EP):
• Market
• $0.19357
• $0.18009
Take Profit (TP):
• $0.22787
• $0.25439
⚠️ My personal opinion only — not financial advice.
Do your own research and remember: all actions you take are your own responsibility. Practice solid risk management and avoid investing more than 2% of your total capital per trade.
DYOR.

BTC/USDTDo you think Bitcoin has just formed a double top, or is it showing a different pattern? Personally, I think we might range a bit from here and then possibly continue the uptrend. I'm not really into pattern trading—so you tell me, are we bullish or bearish?"

This isn’t a breakout. It’s a setup.ETH has been coiling under this level for weeks. While most watch for breakout confirmation — I’ve already mapped the reaccumulation narrative.
The structure:
Price delivered cleanly off a Daily OB and is now grinding through prior inefficiencies. Multiple D FVGs stack just beneath the current zone — not noise, not gaps — these are algorithmic footprints.
Below price? A refined Daily Order Block at 2558, paired with stacked inefficiencies all the way to 2392. That’s the reload zone if price wants to run it deeper.
But the key here is this: price is compressing under draw-level FVGs. Every candle is building imbalance. Every wick is a test. This isn't weakness — it's staging.
Scenario 1:
Minor pullback into local D FVG cluster
Hold above 2580–2600
Reprice into 3030 FVG
Final objective: 3434 sweep and delivery into premium inefficiency (3650+)
Scenario 2:
Sweep below 2580 into full OB at 2558
Sharp rejection
Acceleration through D FVGs above
Mindset:
You don’t chase moves. You wait where Smart Money builds. This isn’t about predicting pumps — it’s about positioning before they become obvious.
“Structure doesn’t lie. Price just tells you who’s in control.”

WALMART testing its 1D MA50! Will it bounce?Walmart (WMT) hit yesterday its 1D MA50 (blue trend-line) for the first time since April 21. It appears that the rebound from the Trade War Low has turned sideways on a Double Top formation and the 1D MA50 is the first Support to be tested, with the 1D MA200 (orange trend-line) following.
This pattern resembles the August - September 2022 Bull Flag, which despite breaking below its 1D MA50, it resumed the uptrend shortly after and hit the 1.382 Fibonacci extension before the next 1D MA50 pull-back.
As a result, we expect the stock to reach $110.00 (Fib 1.382) by the end of the Summer.
-------------------------------------------------------------------------------
** Please LIKE 👍, FOLLOW ✅, SHARE 🙌 and COMMENT ✍ if you enjoy this idea! Also share your ideas and charts in the comments section below! This is best way to keep it relevant, support us, keep the content here free and allow the idea to reach as many people as possible. **
-------------------------------------------------------------------------------
💸💸💸💸💸💸
👇 👇 👇 👇 👇 👇

WTI OIL Massive rejection on the 1D MA200.WTI Oil (USOIL) has been trading within a Channel Down for over a year now and today its latest Bullish Leg hit the 1D MA200 (orange trend-line) for the first time since February 03 2025.
Unless we see a sustainable structured rise that turns it into a Support, the long-term bearish trend should prevail, and the market has already reacted to this with a strong rejection.
With the 1D RSI almost overbought (>70.00), being consistent with the last 3 major tops, we expect a gradual decline towards Support 1, as it happened on the January - February 2025 Bearish Leg.
Our Target is just above it at $55.50.
-------------------------------------------------------------------------------
** Please LIKE 👍, FOLLOW ✅, SHARE 🙌 and COMMENT ✍ if you enjoy this idea! Also share your ideas and charts in the comments section below! This is best way to keep it relevant, support us, keep the content here free and allow the idea to reach as many people as possible. **
-------------------------------------------------------------------------------
💸💸💸💸💸💸
👇 👇 👇 👇 👇 👇

Dollar - WE HIT OUR FIRST TARGET TODAY!!!Amazing work on the dollar for about a month of analysis and finally hitting our target. Its taken its sweet time to drift lower but we have the bigger move today which clipped our target.
Follow for more updates on dollar and what im looking to trade.
Please like and sub and get notified when videos come out if you like my content.
Go back and look at tall the 2 min clips for the last month. We have been in sync all this time

BITCOIN Megaphone is the last step before $150k.Bitcoin (BTCUSD) is repeating almost to the exact point the 2023/ 2024 uptrend, as right now it is in the process of forming a Megaphone pattern similar to the one during December 2023 - January 2024.
Before that, both patterns started the uptrend when a 1D Death Cross formed the bottom. After the 1st Bullish Leg, a Channel Up on a 1D Golden Cross marked the transition to the 2nd Bullish Leg that eventually led to the Megaphone.
In 2024, when BTC broke above the Megaphone, it started the final Bullish Leg that peaked a little above the 1.786 Fibonacci extension from the bottom. During that process, the 1D RSI sequences among the two fractals have been similar.
As result, aiming for the $150000, which is marginally below the 1.786 Fib ext, is a solid target.
Do you think the pattern will continue to be repeated? Feel free to let us know in the comments section below!
-------------------------------------------------------------------------------
** Please LIKE 👍, FOLLOW ✅, SHARE 🙌 and COMMENT ✍ if you enjoy this idea! Also share your ideas and charts in the comments section below! This is best way to keep it relevant, support us, keep the content here free and allow the idea to reach as many people as possible. **
-------------------------------------------------------------------------------
💸💸💸💸💸💸
👇 👇 👇 👇 👇 👇

EURUSD BULLISH OR BARISH DETAILED ANALYSISEURUSD is showing strong bullish momentum after a clean bounce from the key support zone around 1.12. Price structure confirms higher lows and strong bullish candle formations on the daily chart, suggesting the bulls are in control. This recent move is backed by a textbook retest and rejection from the previous resistance-turned-support zone, giving confidence in a potential continuation toward the 1.19 level. With the current price trading near 1.15 and pushing higher, the market is positioned for a strong bullish wave in the coming sessions.
From a fundamental perspective, the Euro has gained fresh support after the ECB’s decision last week to proceed with a measured and data-dependent rate cut cycle. While the ECB delivered its first cut, the tone was cautious and far less dovish than anticipated, which kept EUR strength intact. On the USD side, traders are pricing in a more dovish outlook for the Federal Reserve, especially with recent CPI and PPI data pointing toward cooling inflation. This divergence in policy outlook continues to favor EURUSD upside in the medium term.
Technical indicators are also confirming the bullish bias. The pair is riding an ascending trendline, and momentum indicators like RSI remain in bullish territory without yet being overbought. A daily close above the 1.1550 area strengthens the case for a continuation move. The price is aiming for the next major resistance around 1.1770–1.19, where bulls are likely to take profit or scale out. Until then, dips are likely to be bought aggressively, as long as the 1.12 support remains intact.
This setup presents a high-probability opportunity in a trending market backed by both fundamentals and technical confluence. As long as the bullish structure holds, I remain long-biased on EURUSD with eyes on the 1.19 zone as the next key level. With increasing market interest, low volatility on the downside, and strong trend-following signals, this pair is set for a continued rally.

DXY Will Grow! Long!
Here is our detailed technical review for DXY.
Time Frame: 2h
Current Trend: Bullish
Sentiment: Oversold (based on 7-period RSI)
Forecast: Bullish
The market is trading around a solid horizontal structure 98.198.
The above observations make me that the market will inevitably achieve 98.620 level.
P.S
Please, note that an oversold/overbought condition can last for a long time, and therefore being oversold/overbought doesn't mean a price rally will come soon, or at all.
Disclosure: I am part of Trade Nation's Influencer program and receive a monthly fee for using their TradingView charts in my analysis.
Like and subscribe and comment my ideas if you enjoy them!

USDJPY Will Go Up From Support! Long!
Please, check our technical outlook for USDJPY.
Time Frame: 1h
Current Trend: Bullish
Sentiment: Oversold (based on 7-period RSI)
Forecast: Bullish
The market is approaching a key horizontal level 143.827.
Considering the today's price action, probabilities will be high to see a movement to 144.499.
P.S
We determine oversold/overbought condition with RSI indicator.
When it drops below 30 - the market is considered to be oversold.
When it bounces above 70 - the market is considered to be overbought.
Disclosure: I am part of Trade Nation's Influencer program and receive a monthly fee for using their TradingView charts in my analysis.
Like and subscribe and comment my ideas if you enjoy them!

GBPJPY Will Go Higher! Buy!
Here is our detailed technical review for GBPJPY.
Time Frame: 1D
Current Trend: Bullish
Sentiment: Oversold (based on 7-period RSI)
Forecast: Bullish
The market is approaching a significant support area 194.845.
The underlined horizontal cluster clearly indicates a highly probable bullish movement with target 199.003 level.
P.S
Overbought describes a period of time where there has been a significant and consistent upward move in price over a period of time without much pullback.
Disclosure: I am part of Trade Nation's Influencer program and receive a monthly fee for using their TradingView charts in my analysis.
Like and subscribe and comment my ideas if you enjoy them!

106.5K and 104.5KMorning folks,
As we've suggested upward action happened. Now overall situation stands relatively easy to understand. 100K seems like short-term vital area for upside tendency. While two support levels of 106.5K and 104.5K are those which market has to hold to keep tendency intact.
I would even prefer 106.5K area because this is also natural support line and because it agrees with downside AB-CD 1.618 extension target.
