Lingrid | ADAUSDT buying OPPORTUNITY in the MarketThe price perfectly fulfilled my previous idea . BINANCE:ADAUSDT has broken out from a descending flag pattern and surged above key structure, confirming a bullish continuation within an upward channel. The recent higher low reinforces positive sentiment, with momentum favoring a push toward higher resistance. If $0.7375 holds, the bullish trend remains intact and may test $0.8500 in the coming days.
📌 Key Levels
Support zone: $0.7375 (breakout retest level)
Breakout target: $0.8500 (channel and resistance alignment)
Invalidation level: Below $0.7375 (would break structure and momentum shift)
⚠️ Risks
A drop below the flag's lower edge may signal a fake breakout
Price is nearing upper resistance levels, where sellers might reappear
Overbought conditions could trigger short-term corrections
Traders, if you liked this idea or if you have your own opinion about it, write in the comments. I will be glad 👩💻
Signalservice

Lingrid | GOLD potential PULLBACK and CONTINUATIONThe price perfectly fulfilled my previous idea . OANDA:XAUUSD is accelerating off the trendline support with a sharp impulse leg and now hovering around a potential breakout zone. Momentum remains bullish as price reclaims previous highs and aims for the upper boundary of the resistance zone. The structure favors continuation as long as the trendline holds.
📌 Key Levels
Support zone: 3,345.000 (PDH and trendline convergence)
Breakout target: 3,495.000 (Resistance ceiling within the TARGET area)
Invalidation level: Below 3,345.000 and trendline breakdown ⚠️ Risks
Potential false breakout above 3,400
Failure to hold above 3,345 may trigger deeper correction
Resistance at ATH level could stall momentum
Traders, if you liked this idea or if you have your own opinion about it, write in the comments. I will be glad 👩💻

Lingrid | AUDJPY potential LONG Trade from SWAP zoneFX:AUDJPY continues to trade within a well-defined upward channel, forming a higher high before entering a consolidating triangle pattern. Price is now pulling back toward a confluence of support, where an upward trendline and horizontal level intersect near 92.25. Bulls may look for a bounce if that zone holds.
📌 Key Levels
Support zone: 92.25 (trendline + horizontal support)
Breakout target: 93.50 (measured move from triangle pattern)
Invalidation level: below 92.00 (channel break would signal weakness)
⚠️ Risks
Failure to hold 92.25 could lead to a fall toward 90.60
Resistance at 93.50 and 94.18 may trigger profit-taking
Pattern invalidation if triangle structure gets disrupted by volatility
Traders, if you liked this idea or if you have your own opinion about it, write in the comments. I will be glad 👩💻

Lingrid | DOGEUSDT classic Continuation PATTERN UnfoldingThe price perfectly fulfilled my last idea . BINANCE:DOGEUSDT is attempting a recovery after rebounding off the ascending trendline and breaking out of a falling wedge formation. Price is now retesting the breakout level near $0.175 with a higher low structure still intact. Buyers are watching closely for continuation toward the next resistance area.
📌 Key Levels
Support zone: 0.17509 (wedge breakout and trendline intersection)
Breakout target: 0.19000 (top of prior range and midpoint of resistance area)
Invalidation level: below 0.17509 with strong candle close
⚠️ Risks
Pullback failure to hold 0.175 could trigger a drop to the broader support level
Overhead resistance at 0.190 and 0.200 may slow upward momentum
Market indecision if volume fades near the wedge apex
Traders, if you liked this idea or if you have your own opinion about it, write in the comments. I will be glad 👩💻

Gold – False Break Signals More DownsideIn my commentary yesterday, I highlighted the importance of the 3360 support zone. While Gold initially found a bid around this level, the sharp reversal from the 3415 Asian session high suggests a failed breakout.
Key Observations:
• The quick rejection above 3360 now looks like a false break, reinforcing the bearish outlook.
• The recent high around 3415 appears to be a lower high following the 3500 ATH, confirming potential trend weakness.
• Given this structure, a drop back to at least the 3270 support zone seems highly probable.
Disclosure: I am part of Trade Nation's Influencer program and receive a monthly fee for using their TradingView charts in my analyses and educational articles.

Ripple is Nearing The Main Trend!!Hey Traders, in today's trading session we are monitoring XRPUSDT for a selling opportunity around 2.16 zone, Ripple is trading in a downtrend and currently is in a correction phase in which it is approaching the trend 2.16 support and resistance area.
Trade safe, Joe.

Lingrid | NZDUSD price ABOVE Previous WEEK HighFX:NZDUSD is holding firmly above the breakout level and riding along the upward trendline. The recent pullback appears shallow, hinting at continuation higher toward the resistance ceiling. Bulls are still in control while price remains above the previous week’s high.
📌 Key Levels
Support zone: 0.59870 (Previous WEEK high)
Breakout target: 0.60410 (TARGET area)
Invalidation level: Below 0.59800
⚠️ Risks
Weak volume on the current push
Potential for false breakout above 0.6040
Loss of the trendline could flip bias to short
Traders, if you liked this idea or if you have your own opinion about it, write in the comments. I will be glad 👩💻

Hellena | GOLD (4H): LONG to resistance area of 3400.Colleagues, I've redrawn the waves a bit, because it looks like the correction should be over.
I believe that the upward movement will resume soon.
I expect two variants of events:
1) the price will reach the support area 3162, form wave “4” and after that we will see an upward movement - this is a variant of entering a position with pending limit orders.
2) Price has already formed wave “4” and then we will see only upward movement. This is a variant of market entry.
In both cases I expect the price to come to the target in the resistance area of 3400. This is a pretty strong level from which there could be a strong correction.
Manage your capital correctly and competently! Only enter trades based on reliable patterns!

Lingrid | TONUSDT market Remains in the ACCUMULATION PhaseOKX:TONUSDT is still locked within a long-term corrective channel, with price gradually grinding along the lower boundary. Accumulation appears underway near the $2.50 zone, suggesting growing demand. The structure hints at a potential breakout, but momentum remains weak for now.
📌 Key Levels
Support zone: 2.49 – 2.00 (BUYING area)
Breakout target: 4.00
Invalidation level: Below 2.00
⚠️ Risks
Persistent downward trendline pressure
Lack of strong bullish volume confirmation
A daily close below $2.49 could signal renewed downside
Traders, if you liked this idea or if you have your own opinion about it, write in the comments. I will be glad 👩💻

Hellena | Oil (4H): SHORT to support area of 54.00.Friends, what do we see after the recent downward movement? Most likely we see a continuation of the downward movement in a combined correction.
The hardest thing about compound corrections is to understand where the wave ends and begins.
I believe that the price is now in the middle wave “C” and will continue the downward movement to the target of 53.991.
Wave “B” is likely to reach the 60.00 area, but I do not recommend long positions. Work with pending limit orders.
Manage your capital correctly and competently! Only enter trades based on reliable patterns!

Lingrid | GOLD structure BREAKOUT. Potential BULLISH RallyThe price perfectly fulfilled my previous idea . OANDA:XAUUSD has broken out of a descending triangle and bearish channel, signaling a short-term reversal. After printing a Lower Low near the support area, price surged past the downward trendline and is now forming a consolidation above it. This suggests bullish strength, but a retest of the breakout level may occur before a continuation.
📌 Key Levels
Support Zone: 3,219 – 3,321
Breakout Target: 3,435
Invalidation Level: Below 3,219 (re-entry into previous bearish structure)
⚠️ Risks
Rejection near 3,435 or failure to hold above the trendline could trigger a correction.
Bearish divergence or strong resistance at 3,487 may cap upside.
Upcoming economic news (e.g., NFP, CPI) could lead to volatility.
Traders, if you liked this idea or if you have your own opinion about it, write in the comments. I will be glad 👩💻

Lingrid | AUDUSD bullish CONTINUATION PotentialFX:AUDUSD is currently respecting an upward trendline after bouncing off the local bottom. The pair broke out of the consolidation range and formed a higher high, signaling bullish continuation. A pullback is now testing the trendline and support zone — a bounce here could lead to a rally toward the upper resistance.
📌 Key Levels
Support Zone: 0.64391 – 0.64450
Breakout Target: 0.65000
Invalidation Level: 0.63934 (below trendline + structural break)
⚠️ Risks
Failure to hold the support zone could lead to a trendline break and deeper drop toward 0.63934.
Low liquidity or fakeouts near 0.65000 may trigger reversals.
Unexpected macro news may distort short-term technicals.
Traders, if you liked this idea or if you have your own opinion about it, write in the comments. I will be glad 👩💻

EURUSD – Quiet but Building for a Break?Unlike the wild volatility in Gold, EURUSD has been relatively calm over the past two weeks.
After a sharp spike above 1.1500, reaching a high near 1.1570, the pair corrected and settled into a tight consolidation, fluctuating within just 1%.
Current Setup:
• Price recently reversed from the 1.1280 support and is now pushing towards the 1.1420 resistance.
• Bulls can watch for a breakout above this resistance, which could open the door for a retest of the 1.1570 high.
• As long as 1.1280 holds, the strategy is to buy the dips.
For now, the range is tight, but a breakout could offer some opportunities.
Disclosure: I am part of Trade Nation's Influencer program and receive a monthly fee for using their TradingView charts in my analyses and educational articles.

Gold – Bulls in Control, but Watch Key Support Gold remains extremely volatile. After finding support around 3200 at the beginning of the month, the price surged nearly 2500 pips within just three trading days, reaching above 3400.
Currently, the price has pulled back and has tested the 3360 zone over night– a former resistance turned support.
Two Scenarios to Watch:
- Bullish Case: If 3360 holds, bulls could push for a retest of the 3500 zone.
- Bearish Case: A clear break below 3360 would confirm a lower high, potentially opening the door for a deeper correction back to 3270.
For now, I’m on the sidelines, waiting for more clarity around this critical support.
Disclosure: I am part of Trade Nation's Influencer program and receive a monthly fee for using their TradingView charts in my analyses and educational articles.

GBPUSD BIG MOVE COMING?Structure Overview:
The market has been ranging within a clear horizontal consolidation zone, with two key zones:
Support Zone: 1.32600 - 1.33000 (gray box at the bottom)
Resistance Zone : 1.33500 - 1.33800 (gray box at the top)
Price recently broke above the upper consolidation range, suggesting bullish momentum.
🔍 Analysis:
The pair has broken out of the consolidation range after multiple rejections from the support zone.
We now look for a potential retest of the previous resistance (1.33500 area) as new support.
Two potential bullish continuation scenarios are highlighted:
📌 Trade Plan:
Scenario 1 – Immediate Continuation:
If price holds above 1.33500, look for bullish continuation toward:
TP1: 1.34026
TP2: 1.34208
Scenario 2 – Retest Setup:
Wait for a pullback to the 1.33000–1.33500 zone.
Confirmation of bullish rejection (e.g., bullish engulfing or pin bar) could provide a high-probability long setup.
Entry: After bullish confirmation in retest zone
SL: Below 1.33000 (invalidates breakout)
TP: 1.34026 / 1.34208
📉 Invalidations:
A clean break and close below 1.33000 may suggest a failed breakout, putting 1.32600 back into play.
🧠 Bias: Bullish (as long as 1.33000 holds)
🕒 Timeframe: 4H

Lingrid | SHIBUSDT long OPPORTUNITY from the SUPPORTBINANCE:SHIBUSDT is currently trading inside a downward wedge pattern, typically a bullish formation. After reaching the resistance zone around 0.00001567 and forming a lower high, the price retraced sharply. It is now approaching a critical support area near 0.00001186, aligned with the wedge base and previous reaction zones. Bullish traders are watching for a breakout to the upside, while bearish pressure remains within the channel.
📉Key Levels to Watch
Support zone: 0.00001186 (wedge base and historic demand)
Breakout target: 0.00001390 (near-term rally cap)
Invalidation level: below 0.00001028
⚠️ Risks
A failure to hold above the wedge support at 0.00001186 could trigger a drop toward the March lows at 0.00001028.
Bearish momentum remains strong, and multiple lower highs signal seller dominance unless invalidated.
False breakouts within wedge patterns are common—confirmation is needed before reacting.
Traders, if you liked this idea or if you have your own opinion about it, write in the comments. I will be glad 👩💻

Lingrid | GOLD Weekly OUTLOOK: Poised for BULLISH ReversalOANDA:XAUUSD market has retraced approximately 50% of the previous month's range and is approaching the critical golden zone at the 61.8% Fibonacci retracement level. After experiencing such strong bullish momentum, we've now witnessed two consecutive red weeks, suggesting a potential reversal point.
Price is currently testing the previous resistance zone, which has now established itself as support—a classic market structure confirmation. The formation of equal weekly lows beneath current price levels represents significant liquidity that could fuel an upward move.
Furthermore, the price action appears to be completing an ABC pullback pattern, which typically precedes trend continuation. This bullish outlook is further reinforced by the emergence of a falling wedge pattern, a technical formation that frequently resolves to the upside.
Overall, I expect prices to move higher in the coming week, potentially catalyzed by the upcoming Federal Funds Rate decision, which could provide the fundamental backdrop for the next leg up in gold's price trajectory.
Traders, if you liked this idea or if you have your own opinion about it, write in the comments. I will be glad 👩💻

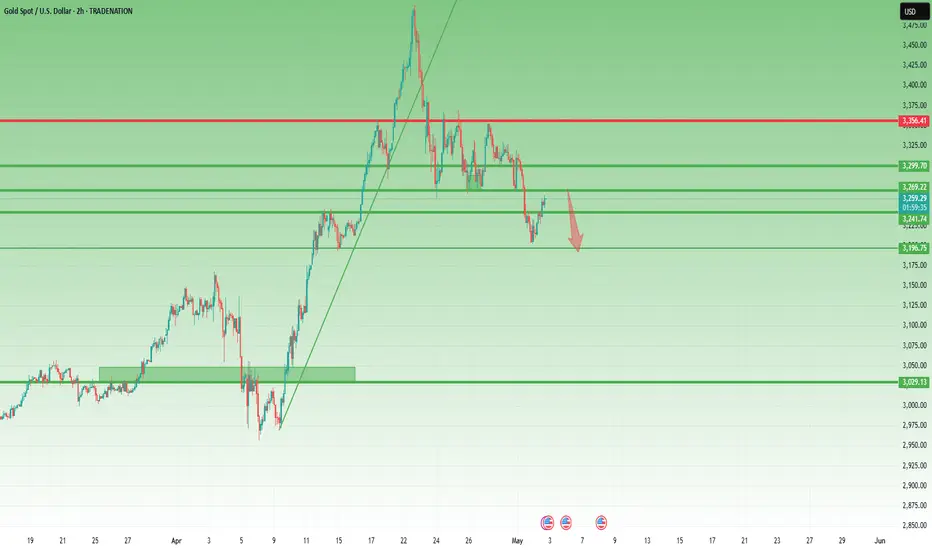
Gold Bear Flag in Play – More Downside Ahead?Last week was a strong one for Gold bears, with price dropping sharply and reaching a low near the 3200 mark.
A normal recovery followed, but the bounce is now facing pressure below the 3270 level – a former support that has now turned into resistance.
Current price action is forming a bear flag, a classic continuation pattern. If we get a break back below 3250, this could trigger a new leg down, targeting the 3170 support zone.
My outlook remains bearish, and I’m continuing to sell rallies into resistance, expecting this bear flag to resolve to the downside.
Disclosure: I am part of Trade Nation's Influencer program and receive a monthly fee for using their TradingView charts in my analyses and educational articles.

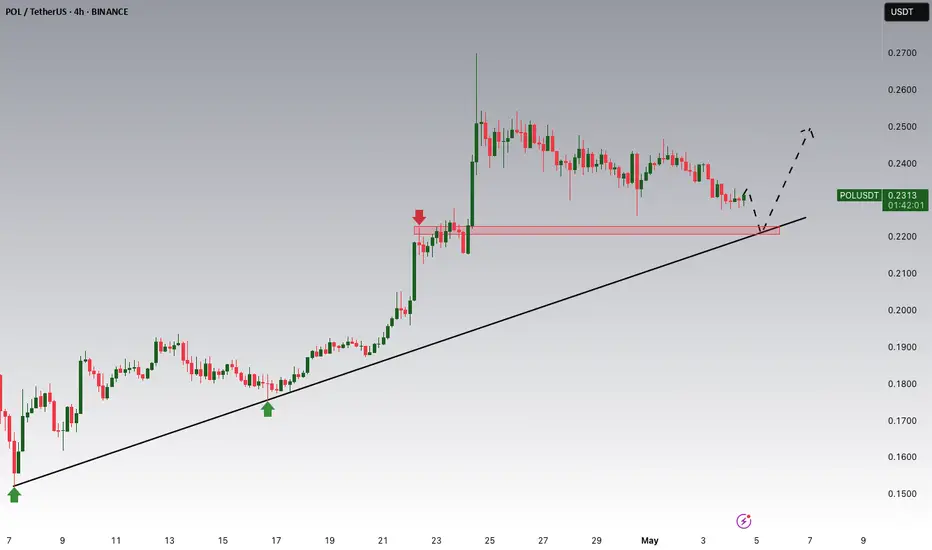
POLUSDT Potential UpsidesHey Traders, in today's trading session we are monitoring POLUSDT for a buying opportunity around 0.2220 zone, POLUSDT is trading in an uptrend and currently is in a correction phase in which it is approaching the trend at 0.2220 support and resistance area.
Trade safe, Joe.
Lingrid | ARBUSDT potential BREAKOUT. Long from SUPPORT zoneThe price perfectly fulfilled my previous idea . BINANCE:ARBUSDT is moving inside a clean upward channel, currently pulling back toward the 0.3175 support and trend-line after rejecting from the 0.3627 resistance. If buyers step in around trend-line support, the bullish structure could continue, pushing price back toward the top of the range.
📈 Key Levels
Buy zone: 0.3175 – 0.3200
Buy trigger: bounce from trend-line
Target: 0.3627
Sell trigger: break and hold below 0.3175
💡 Risks
Flag breakdown or failure at support may push price lower.
Loss of trend-line = structure invalidation.
Market-wide pullbacks could pressure ARB even with strong setup.
Traders, if you liked this idea or if you have your own opinion about it, write in the comments. I will be glad 👩💻

Gold Bears Won Big – Here’s the Next Resistance to WatchYesterday was a great day for Gold bears – just as anticipated, price dropped nearly 1,000 pips and hit my target zone around 3200.
After such a strong move, we’re now seeing a typical rebound, which might offer a fresh opportunity to sell into strength and ride the prevailing trend.
🔍 Key Zone:
- 3270 now acts as resistance.
- If price stalls here, it’s the ideal area to look for short entries targeting a retest of 3200.
🛠️ Plan: Sell spikes into 3270 resistance and stay with the trend.
Hellena | BITCOIN (4H): LONG to resistance area of 98,000.Dear colleagues, in this forecast I will not make too forward-looking plans. I believe that the upward movement is not over yet, because the wave “C” is not yet completed and consists of five waves.
I think that we should expect to reach the resistance area of 98,000. A small correction to the support area of 90,000 is possible.
Manage your capital correctly and competently! Only enter trades based on reliable patterns!

Lingrid | GOLD trendline BREAKOUT: Short-Term BEARISH MoveOANDA:XAUUSD made a strong bullish run, but after reaching the top near 3500, the price entered a sideways range and recently broke below the upward trend-line. Now it’s retesting the 3,283–3,300 zone, which may act as resistance. If price fails here, we could see a drop back to the 3,150 support area. Bulls will need a solid recovery above 3,300 to regain control.
📈 Key Levels
Sell zone: 3,283 – 3,300
Sell trigger: rejection from retest area
Target: 3,150
Buy trigger: strong breakout and hold above 3,300
💡 Risks
Gold is sensitive to US macro data this week (FOMC, NFP, PCE).
Retest of the trend-line might trigger volatility and fakeouts.
Break above 3,300 could invalidate the bearish scenario.
Traders, if you liked this idea or if you have your own opinion about it, write in the comments. I will be glad 👩💻
