Lingrid | ETHUSDT Trend Continuation Pattern. Potential LongBINANCE:ETHUSDT is consolidating inside an upward channel, holding just above the 1,757 support and the upward trend-line. After reaching a higher high near the channel top, price pulled back but remains within structure. If the trend-line holds, a rebound toward the 1,990 resistance looks likely. The bullish setup remains valid while price trades above the trend-line.
📈 Key Levels
Buy zone: 1,750 – 1,760
Buy trigger: bounce from trend-line
Target: 1,990
Sell trigger: break below 1,750
💡 Risks
If ETH loses trend-line support, momentum could flip to bearish.
Volatility from BTC or macro events may trigger false moves.
Watch for breakout above consolidation highs for early confirmation.
Traders, if you liked this idea or if you have your own opinion about it, write in the comments. I will be glad 👩💻
Signalservice

Lingrid | TONUSDT pullback Approaching Psychological LevelThe price perfectly fulfilled my last idea . It reached the target. OKX:TONUSDT is pulling back after testing the upper resistance area near 3.40. Price is now moving toward a key support zone around 3.00, where the downward trend-line intersects horizontal structure. If bulls defend this level, the chart suggests a possible bounce back toward 3.25. The bullish scenario remains active as long as the trend-line holds.
📈 Key Levels
Buy zone: 3.03 – 3.06
Buy trigger: bounce from trend-line support
Target: 3.25
Sell trigger: break below 3.03
💡 Risks
Loss of 3.03 could lead to a drop toward the 2.78 support.
If the bounce lacks volume, recovery may be weak.
Watch for fakeouts near the trend-line—confirmation is key.
Traders, if you liked this idea or if you have your own opinion about it, write in the comments. I will be glad 👩💻

EURUSD – Bear Flag Before Further Drop?Like most of the market, EURUSD reacted strongly on April 22–23 with a sharp move down. Since then, price has entered a consolidation phase — and thIS pause has now taken the shape of a bear flag, a classic continuation pattern that often leads to further correction once confirmed.
📉 Key levels to watch:
1.1350 – Initial trigger for the flag break
1.1300 – Confirmation of bearish momentum
Target: 1.1100
Invalidation: A return above 1.1500 would negate the pattern and call for reassessment.
Disclosure: I am part of Trade Nation's Influencer program and receive a monthly fee for using their TradingView charts in my analyses and educational articles.

GBPUSD Analysis – Classic Spike, But Bearish Bias HoldsTwo days ago, TRADENATION:GBPUSD did what it often does – spiked above the previous high with no solid fundamental reason, likely just to hunt stops.
This return into the resistance zone might look bullish on the surface, but the bigger picture remains unchanged.
Has the market really resumed its up move, or was this just a trap?
Despite the upward push, the overall outlook stays bearish. A drop towards the 1.3000 zone is still highly probable – but we need confirmation.
Why the bearish scenario remains valid:
• The spike occurred without strong fundamental backing.
• Price hasn't broken the strong 1.35 resistance.
• Key support for a breakdown lies at 1.3330–1.3350 – a clear break here is the signal for downside continuation.
Trading Plan:
Wait for a break below 1.3330–1.3350, and then look for short setups on lower timeframes.
Invalidation comes only if the pair pushes and sustains above 1.3500, in which case the bearish thesis is off the table.
Disclosure: I am part of Trade Nation's Influencer program and receive a monthly fee for using their TradingView charts in my analyses and educational articles.

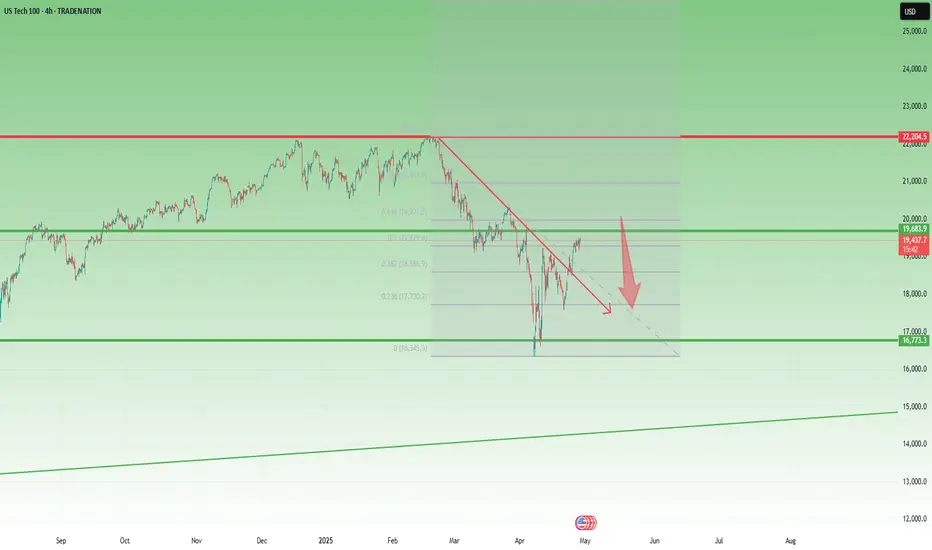
NASDAQ Recovery Looks Fragile Below 20,500After the steep drop to 16,300, NAS100 started to recover, forming a higher low and managing to break back above the falling trendline drawn from the all-time high (ATH).
While these are positive developments, in my opinion, the trend is likely to reverse to the downside soon.
Technically, the index is now entering a heavy resistance zone, marked by:
• The golden sell zone between the 50% and 61.8% Fibonacci retracement,
• Psychological resistance at 20,000,
• Major horizontal resistance around 20,500.
As long as the price remains below 20,500, I favor short trades, targeting a potential drop to at least 18,000
Disclosure: I am part of Trade Nation's Influencer program and receive a monthly fee for using their TradingView charts in my analyses and educational articles.
Gold Plan: Waiting for the 1000 Pips Drop UnderwayYesterday, I highlighted that the 3280 support zone looked fragile and warned of a potential breakdown.
However, once New York opened, bulls stepped in aggressively, pushing Gold above Friday’s close and triggering my stop loss along the way.
Key Question:
Has the bullish momentum changed the bigger picture?
Why I Still Expect a Drop:
- Despite yesterday's green close, the broader structure remains bearish.
- The 3370 resistance zone is still intact, and Gold is vulnerable under it.
- My target remains a move under 3280, aiming for the 3200 area.
T rading Plan:
I will continue to look for selling opportunities, especially on spikes toward resistance zones, targeting a 1000 pips move down.
Final Words:
The market needs to confirm the plan, but patience and discipline will bring the 🚀 in the right direction!
Disclosure: I am part of Trade Nation's Influencer program and receive a monthly fee for using their TradingView charts in my analyses and educational articles.

Lingrid | GOLD Market COMPRESSION: Coiling Up Before BREAKOUTOANDA:XAUUSD is forming a potential triangle pattern after bouncing from support near 3,220, where multiple key levels converge. The price is holding above the short-term upward trend-line, showing signs of compression. If buyers defend this area again, we could see a breakout toward the 3,380 resistance. Until then, the pair remains in a consolidation phase.
📈 Key Levels
Buy zone: 3,280 – 3,290
Buy trigger: bounce from trend-line
Target: 3,380
Sell trigger: break below 3,280 with confirmation
💡 Risks
Gold remains sensitive to USD news — strong data can limit upside.
A sudden break of the triangle base may shift bias to bearish.
Volatility expected ahead of key macro releases this week.
Traders, if you liked this idea or if you have your own opinion about it, write in the comments. I will be glad 👩💻

Gold Stuck in Limbo- Sell Rallies, Ride the DropAfter the explosive rally that pushed Gold up to the 3500 area, the market quickly reversed with a sharp sell-off on April 22–23, dropping almost 2500 pips.
Since then, price has entered a consolidation phase.
Initially, the range was between 3270 and 3370, but since yesterday, the range has started to tighten — a classic sign that a breakout is approaching.
Looking at the structure, we’re dealing with a blow-off top followed by a range with clear support and resistance levels. In this context, I lean toward a downside breakout.
The key support is now at 3300 — and a break below it would likely expose 3270 again.
However, I don’t expect the move to stop there. If 3300 is broken, a continuation toward the 3200 zone becomes very likely.
🔹 Trading Plan:
As long as price stays below the 3360–3370 resistance zone, the strategy is to sell rallies, especially when price approaches the upper boundary of the range. Entries can be taken on rejection candles or confirmation patterns near resistance, with stops just above 3370. If 3300 breaks, watch for continuation setups toward 3200.
Only a sustained breakout above 3370 with strong bullish momentum would invalidate the bearish scenario and call for a reassessment.
Disclosure: I am part of Trade Nation's Influencer program and receive a monthly fee for using their TradingView charts in my analyses and educational articles.

Lingrid | AUDCHF trend Continuation Pattern. Long The price perfectly fulfilled my last idea . It hit the target zone. FX:AUDCHF is holding above the upward trend-line, forming a series of higher lows after the recent flag pattern correction. The price is consolidating above support at 0.5265 and may soon bounce from this area to resume its bullish leg. As long as buyers protect the trend-line, the structure stays bullish with eyes on the 0.5337 resistance.
📈 Key Levels
Buy zone: 0.5265 – 0.5270
Buy trigger: bounce from trend-line
Target: 0.5337
Sell trigger: break below 0.5265
💡 Risks
Break below the trend-line could shift the short-term bias to bearish.
Watch for false breaks or low-volume bounces — confirmation is key.
Volatility may increase around CHF news or cross-pair flows.
Traders, if you liked this idea or if you have your own opinion about it, write in the comments. I will be glad 👩💻

Lingrid | DOGEUSDT Potential LONG on Pullback to SWAP ZoneThe price perfectly fulfilled my last idea . It reached the target. After a strong rally and fake breakout above the resistance near 0.1915, BINANCE:DOGEUSDT is now pulling back and trading inside a sideways range. Price is heading toward the 0.1700–0.1710 support area, which aligns with the upward trend-line. If bulls hold this zone, a rebound toward 0.1850 looks likely. As long as price stays above the trend-line, bullish structure remains valid.
📈 Key Levels
Buy zone: 0.1700 – 0.1710
Buy trigger: bounce from trend-line
Target: 0.1850
Sell trigger: break below 0.1700
💡 Risks
If price breaks below 0.1700, it may open the way toward deeper support.
Sudden spikes in Bitcoin or market-wide sentiment shifts can shake the setup.
Lower timeframe volatility near trend-line could trap early entries.
Traders, if you liked this idea or if you have your own opinion about it, write in the comments. I will be glad 👩💻

EURGBP Technical Setup: 1:3 R:R Opportunity on RetestAfter the drop to 0.8250 — a level not touched since 2022 — EURGBP rebounded to 0.8450 before starting another decline.
However, the 0.8250 support held firm once again, a higher low follow, and EURGBP eventually broke above 0.8450, confirming a double bottom pattern.
Price acceleration quickly took the pair above 0.8700, and now EURGBP is undergoing a normal correction.
The broken neckline at 0.8450 now acts as clear support.
Traders could look to buy near the 0.8450 retest, using a tight stop below the neckline, and aiming for at least a 1:3 risk-reward ratio.
Disclosure: I am part of Trade Nation's Influencer program and receive a monthly fee for using their TradingView charts in my analyses and educational articles.

Lingrid | GBPCAD bullish BREAKOUT with Short-Term PullbackThe price has perfectly followed my previous analysis . Recently, the FX:GBPCAD price broke and closed above the previous week's high and the psychological level at 1.85000. Following this significant breakout, the market is pulling back toward the support level, trendline, and triangle pattern. If the market remains above this support zone, the chance of continuation is high. I expect the price to reject this level and rebound, following with continuation toward the next resistance zone. This price action demonstrates classic market behavior following a key breakout, where a retest of former resistance as new support often provides an optimal entry point for traders aligned with the prevailing trend direction. My goal is resistance zone around 1.86510
Traders, if you liked this idea or if you have your own opinion about it, write in the comments. I will be glad 👩💻

Lingrid | SOLUSDT Consolidation After KEY Resistance BreakThe price perfectly fulfilled my previous idea . BINANCE:SOLUSDT market has effectively bounced off the support level and continues moving higher. The price has established a significant swap zone around the 135.00 level, where it has repeatedly found resistance or support in previous tests.
Recently, the market broke and closed above the 140.00 resistance zone, and following this breakout, the market has entered a consolidation phase, suggesting it may continue moving sideways in the near term. However, if the price pulls back toward the established swap zone, we can anticipate continuation of the current bullish trend. This consolidation pattern following a resistance break often signals strengthening market conviction before the next meaningful advance. My goal is resistance zone around 165.00
Traders, if you liked this idea or if you have your own opinion about it, write in the comments. I will be glad 👩💻

XAUUSD: Massive Volatility, Weak Support at 3270!Last week was extremely volatile for Gold, with incredible swings that caught many traders off-guard. After reaching a new all-time high at 3500, the price dropped by more than 2000 pips in less than 24 hours!
After this crash, the market settled somewhat, and towards the end of the week, Gold established a strong ceiling around 3370 – exactly as we discussed in last week's analysis.
The key question now: Is the correction over or is there more downside coming?
At the same time, we can clearly observe a floor around 3270, a level that Gold is testing again at the time of writing.
Here’s why I believe the correction is not over yet:
- Price action remains vulnerable below 3370 resistance.
- The support at 3270 looks fragile, with pressure building for a break.
- Market volatility is still extremely high, favoring continuation moves.
Trading Plan:
I am looking to sell rallies above 3300, aiming for a target around 3200.
Due to the recent wild volatility, I will adjust my stop losses accordingly, allowing enough room for noise without exposing the position to unnecessary risk.
Disclosure: I am part of Trade Nation's Influencer program and receive a monthly fee for using their TradingView charts in my analyses and educational articles.

Lingrid | GOLD Weekly Analysis: CORRECTIVE Phase after the SurgeOANDA:XAUUSD market initially rallied during the week, reaching the key 3500 level. However, we have a corrective move, showing a bit of profit taking as traders are looking to the tariff noise for direction. The market made a sharp decline resulting in a long-tailed bearish bar on the weekly timeframe, suggesting the price may continue pushing lower toward the 3150 support levels. The price shows similar price action to what we saw at the beginning of this month when a market decline was followed by a week of sideways movement, which then led to continuation of the bullish trend.
I think we might see 2 scenarios to identify the potential endpoint of this corrective move. On the daily timeframe, the price is near the 50% retracement of the bullish swing move, which may be a potential level for continuation. The second scenario is an ABCD pullback where price dips below the 3200 level to find support. In any case, we should react to the price action and how it develops. If the Monday candle gaps up, this potentially indicates that price may move higher. And if we get a gap down, then we can expect a deeper pullback in the market.
Traders, if you liked this idea or if you have your own opinion about it, write in the comments. I will be glad 👩💻

Lingrid | EURUSD possible REVERSAL from Critical RESISTANCE FX:EURUSD is currently testing a significant upward trendline while consolidating in a narrow sideways range just above this crucial support. Notable bearish signals have emerged, including a clear divergence pattern and a false breakout attempt above the previous higher high level – a classic trap for bullish traders. Adding weight to the bearish case, price action has formed a long-tailed rejection bar on the daily timeframe precisely at the key resistance zone that corresponds with the 2022 high level. This powerful rejection at historical resistance shouldn't be overlooked. I anticipate a meaningful pullback once price decisively breaks below the upward trendline support. This corrective move appears increasingly probable given that price has now completed a textbook ABC pattern on the daily timeframe. The completion of this pattern, combined with the other technical signals, suggests we're likely at an inflection point where momentum could shift significantly to the downside. My goal is supprot zone around 1.11550
Traders, if you liked this idea or if you have your own opinion about it, write in the comments. I will be glad 👩💻

Lingrid | BTCUSD weekly BULLISH Closure Above KEY LevelsThe price perfectly fulfilled my last idea . It reached the target level. Last weekly candle closed bullish showing bulls stepped in, and previous week BINANCE:BTCUSDT closed above the last 6 week highs. The market completed the ABC movement, therefore the market is moving sideways around the 95,000 level. At this point we can see the pullback in the market since it's testing the previous week high and ABC completion. This pullback would give us the opportunity to go long from the support zone in expectation of continuation. Looking left on the daily chart, we can see the price kept rebounding from the support level around 90,000 from November and February, which shows the importance of this zone. If the price pulls back toward this key level, the chance of bouncing off is pretty high. This historical support combined with the recent bullish momentum creates a compelling case for potential upside continuation after the current retracement completes. My mid-term goal is resistance zone around 99600
Traders, if you liked this idea or if you have your own opinion about it, write in the comments. I will be glad 👩💻

AVAX Analysis: Building Up for a Potential Breakout🔹 Since mid-December, AVAX dropped hard, losing more than 70% from the highs.
🔹 Recently, the coin found strong support around the $15 zone, testing it twice — possibly forming a double bottom pattern.
🔹 At the time of writing, price is consolidating right under the neckline and seems to be building momentum for a move.
Key technical points:
• Massive drop from $55 opens room for a stronger relief rally.
• A breakout above the $23 resistance would confirm bullish continuation.
• $18 is now the new support zone — as long as it holds, the bias remains bullish.
• Major target for bulls: $30–31 area.
🚀 Plan: Watching for a confirmed breakout above $23 for potential continuation higher. As long as $18 support holds, dips could be seen as opportunities.

Bitcoin: Short-Term Bullish, but Herd Mentality ReturnsAfter reaching my 75K target, Bitcoin started to recover nicely. In its comeback, it delivered two important bullish confirmations:
➔ First, it broke above the descending trendline around 84K.
➔ Then, it made a small consolidation, followed by a new leg up that pushed the price above the critical 92K technical zone — also reclaiming the psychological 90K mark.
At the time of writing, the price holds well above horizontal support. From a technical perspective, as long as the 90-91K area remains intact, we can expect higher prices. The next big resistance is around 100K, and if support holds, we might see Bitcoin testing that zone again in the coming days.
Speculators could look to buy dips as long as the structure stays healthy.
My take:
Even though the setup looks technically decent, I'm personally staying out for now. Once again, the crowd is shouting that "the correction is over" and "it's time to buy" — a classic red flag in market psychology.

GBPJPY Reclaims 190 – Ready for 195?After breaking below the 188.00 support zone and testing 184.50 support, GBPJPY quickly reversed, signaling strong buying interest and a classic false breakdown.
Last week, the pair also reclaimed the key 190.00 level – an important technical and psychological area – showing clear strength and readiness for a potential continuation higher.
The key question now: Is GBPJPY ready to launch towards new highs?
Here’s why I stay bullish:
- Strong rejection at 184.50 confirms buyer dominance.
- Recovery above 190.00 is a major bullish signal.
- Market structure now favors buying dips
T rading Plan:
I’m looking to buy dips, staying bullish as long as 187.00 remains intact.
🎯 Targeting a move towards 195.00.
Disclosure: I am part of Trade Nation's Influencer program and receive a monthly fee for using their TradingView charts in my analyses and educational articles.

GBPUSD Rejected at Key Resistance – Bearish Outlook StaysLast week, in my GBPUSD analysis, I highlighted that the pair had reached a major resistance area – a level that has acted as both support and resistance over the past few years. I mentioned that a correction from this zone was very likely.
The market reacted perfectly: GBPUSD dropped from that resistance, and after the initial move, it entered into a consolidation phase.
The key question now: Is the correction finished or will the downside continue?
My outlook remains the same – I still expect further downside towards the 1.3000 level.
Here’s why I stay bearish:
- Strong historical resistance rejected the price.
- No real bullish momentum above 1.34 zone.
- Consolidation after the drop looks more like a pause, not a reversal.
Trading Plan:
I will look to sell rallies, staying bearish as long as the 1.3400 area (recent high) is not broken.
Disclosure: I am part of Trade Nation's Influencer program and receive a monthly fee for using their TradingView charts in my analyses and educational articles.

Lingrid | TONUSDT support REBOUND Confirms POSSIBLE Reversal The price has perfectly fulfilled my previous forecast . OKX:TONUSDT market bounced off the support level and is now showing clear signs of reversal. Additionally, price action broke and closed above the psychological level at 3.00, confirming bullish momentum. The price action is creating an ABC pattern, suggesting the market may reach the upper border of the channel. Currently, the price is testing the weekly high level, and from this zone, a short-term pullback may form. If the price retraces toward the swap zone, we can expect it to rebound and continue pushing higher. We should look at the current test of the weekly high for signs of temporary resistance before the anticipated pullback. My goal is resistance zone around 3.40
Traders, if you liked this idea or if you have your own opinion about it, write in the comments. I will be glad 👩💻

Lingrid | TRXUSDT broke CONSOLIDATION zone. Potential LongThe price perfectly fulfilled my last idea . It hit the target level. BINANCE:TRXUSDT market has decisively broken through the 0.2500 psychological level and consolidation zone with an impulse leg. Additionally, it has broken through the downward trendline, confirming the strength of this move. On the higher timeframe, the market is forming an ABC pattern, suggesting that price may reach the resistance zone around 0.2780. I expect a pullback in the near term, which would likely present a buying opportunity, followed by continuation of the bullish trend. My goal is resistance zone around 0.2595
Traders, if you liked this idea or if you have your own opinion about it, write in the comments. I will be glad 👩💻
