DXY Bounces Back: I’m Staying BullishAfter breaking below the 104 support and hitting a low of 103.75, TVC:DXY staged a strong recovery, reclaiming support and signaling a potential false breakout.
The overnight retest of 104 established a higher low, suggesting further upside potential.
As long as 104 holds, I remain bullish and will look to sell EUR/USD and GBP/USD.
Signalservice

Lingrid | GOLD breaks Records REACHING New All-Time HighOANDA:XAUUSD market gapped up and continued to rise, reaching a new all-time high. It has already approached the resistance zone I highlighted in the weekly forecast and is above the 3100 level, which could serve as an entry zone due to the range and upward trendline below. As the monthly candle is set to print today, I believe the price may trade sideways around the current levels. However, if the price makes a correction toward support and rejects it, we should look for a buying signal in the market. My goal is resistance zone around 3150
Traders, If you liked this educational post🎓, give it a boost 🚀 and drop a comment 📣

Gold- Way, way too deviated from the MEAN!!!As I’ve mentioned many times in my analyses, my trading approach focuses on identifying the next big move (500 to 1,000 pips) rather than chasing small gains of 30-50 pips, which often feels more like staying busy than truly making money.
In this post, I’ll explain why I believe the next major move in Gold is downward rather than upward.
I’ll take a slightly different approach than usual, focusing on the bigger picture and using a simple 20-period moving average (MA) to smooth price action.
Looking at the posted chart, since the beginning of the recent bull market—highlighted in the chart at the 1,600 zone back in November 2022—Gold has been in a strong uptrend. A key observation is that the 20-period moving average has been forming higher lows.
After the second higher low in October 2023, the trend became even more aggressive, with only two notable higher lows since (looking on MA)—one in July 2024 and another in January 2025.
However, even during these sharp bullish legs, the market has consistently reversed to the mean—with the mean being the 20-period moving average.
At the time of writing, Gold is trading around 3,110, which is significantly deviated from the mean, currently around 2,990.
Conclusion:
Based on this pattern, we could expect either a deep retracement or at least a period of consolidation to allow the moving average time to catch up with the price.
Of course, shorting into such a strong bull run carries high risk, especially without a clear stop-loss level. However, even if Gold spikes to 3,150 or even 3,170, I strongly believe that the price will eventually drop and touch the 20-period moving average.
Disclosure: I am part of Trade Nation's Influencer program and receive a monthly fee for using their TradingView charts in my analyses and educational articles.

Lingrid | EURUSD ABC pullback Completed. Possible SHORTOANDA:EURUSD market formed an ABC pullback and tested the area above Friday's high. The price action remains within the previous week's range, indicating a lack of overall trend in the market. However, if the price rejects the resistance zone, I believe it may drop further, potentially forming another ABC move toward the 1.06000 support level. Since the price has cleared zone below the 1.07700 level, it may retest this area, despite the previous false breakout. I anticipate that if the price does not close above the 1.08500 resistance zone, it will likely move toward the previous week's low. My goal is support zone around 1.07610
Traders, If you liked this educational post🎓, give it a boost 🚀 and drop a comment 📣

Lingrid | BTCUSD continues to Consolidate. Potenial LongBINANCE:BTCUSDT market tested the previous week's high but then pulled back from the resistance zone around 89,000. On the daily timeframe, the last candle is a doji, indicating a loss of selling pressure. Additionally, it reached the low of the last two weeks, and below this level, there is liquidity waiting to be tapped. Given that the overall market is moving sideways after sell offs, I believe the price may bounce off the PWLs and the psychological level at 80,000 towards the 85,000. Overall, I expect the monthly candle to close as a doji as well. My goal is resistance zone around 84,000
Traders, If you liked this educational post🎓, give it a boost 🚀 and drop a comment 📣

Gold- Target and new ATH reached. Now what?In my analysis yesterday, I mentioned that Gold would likely reach a new all-time high (ATH), but for that to happen, it was crucial for bulls to hold strong at the 3025-3030 support zone.
Indeed, Gold made a new ATH, reaching my target zone of 3080 overnight. I closed my buy trade with a profit of 550 pips.
Now, the key question is: What’s next?
In my opinion, there’s a strong possibility that Gold will continue its upward movement and test the 3100 level. However, at the current price of 3075, entering a buy trade is not justified from a risk perspective.
For now, I’m staying out of the market. If a retracement occurs, I’ll be watching the 3050 zone closely—most importantly, I’ll assess how the market reacts at that level before making any decisions.
Disclosure: I am part of Trade Nation's Influencer program and receive a monthly fee for using their TradingView charts in my analyses and educational articles.

Lingrid | GOLD Weekly MARKET OutlookOANDA:XAUUSD market started the week quietly, but we saw significant bullish movements on Tuesday and Friday. At this stage, any pullback in the market may be viewed as a buying opportunity. The market broke through and closed above the previous resistance zone around 3050 level. Furthermore, it closed above the high from the previous week, marking four consecutive bullish weeks.
On a lower timeframe, the market formed an ascending triangle pattern, which is a bullish continuation pattern. If the price breaks above this pattern next week, it could continue to climb higher. Given the recent bullish momentum in the market, there’s a possibility that the price may consolidate after such a strong move, similar to what we observed between Monday and Wednesday. Alternatively, we might see a corrective move toward the previous week’s high, which would present an optimal entry zone.
With the ongoing tariff war in mind, I expect the bullish trend to persist until the price action shows otherwise.
Traders, If you liked this educational post🎓, give it a boost 🚀 and drop a comment 📣

Lingrid | SUIUSDT fake break of CONSOLIDATtion zoneThe price perfectly fulfills my last idea . It hit the target level. BINANCE:SUIUSDT consolidated around the 2.30 level before breaking above it; however, the price subsequently pulled back and returned to the consolidation zone. This behavior resembles a "dead cat bounce," as we did not observe further upward movement. Below, we can see an upward trendline that has been tested multiple times. I believe the price may break through this trendline and continue moving downward since it was tested may times. My goal is support zone around 2.100
Traders, If you liked this educational post🎓, give it a boost 🚀 and drop a comment 📣

VIDTUSDT(VIDTDAO) Updated till 28-03-25VIDTUSDT(VIDTDAO) Daily timeframe range. PA trying to hold above its 0.01233 level. it can have some relief if it gets a valid close above 0.02066. not so much retail interest it can see better day if market gets some volume.

Lingrid | GOLD soars to NEW All-Time High LEVELSThe price perfectly fulfilled my previous idea. It hit the target level. OANDA:XAUUSD broke above last week's high and is currently testing the resistance level at 3080. After such a surge, it seems prudent to wait for a potential pullback. With the prevailing bullish momentum, the market may continue to rise towards the next resistance levels or move sideways untile next week. If a pullback occurs, it may provide an opportunity to go long from the previous resistance zone that has now become support. Given the upcoming high-impact news, the market might form a range or pull back toward support. Overall I expect a rebound from the support level around 3050, leading back toward all-time high levels. My goal is resistance zone around 3085
Traders, If you liked this educational post🎓, give it a boost 🚀 and drop a comment 📣

Lingrid | GBPAUD anticipating POTENTIAL Consolidation-ExpansionFX:GBPAUD market continues to oscillate between the resistance and support levels of 2.0300 and 2.0600. It has broken and closed above the downward trendline and the highs from the last two days. With a bullish outlook on the daily timeframe, we anticipate a classic consolidation expansion move. If the price holds above the support level and trendline, we can expect a retest of at least last week's high and potentially further bullish moves. My goal is resistance zone around 2.06490
Traders, If you liked this educational post🎓, give it a boost 🚀 and drop a comment 📣

Lingrid | TONUSDT Potential BULLISH Momentum in the MarketOKX:TONUSDT market continues to rise following a period of consolidation, testing the significant psychological level of 4.00. It may pull back toward the support level and the upward trendline, but since it has broken and closed above the consolidation zone—which typically serves as both support and resistance. I think the price may bounce back and move higher if the market retests this area. Additionally, on the daily timeframe, the formation of a bullish engulfing candle indicates strong bullish pressure. I anticipate that the price will continue to push higher towards the resistance zone between 4.50 and 4.80. My goal is to resistance zone zone around 4.40
Traders, If you liked this educational post🎓, give it a boost 🚀 and drop a comment 📣

Lingrid | GOLD Continues to CONSOLIDATE above the 3000 level Yesterday, OANDA:XAUUSD price moved higher, briefly taking liquidity above the previous day's high at 3035 before pulling back to consolidate. This resembles the price action we observed at the beginning of the month when the price consolidated around the 2900 level, tested the bottom of the consolidation, made a false break, and then moved to higher levels. Given that the price has tested the bottom of the current consolidation zone twice, I anticipate a similar scenario may unfold, where the price could retest the area below the psychological level once more before climbing higher, particularly if a false break occurs. My goal is the resistance zone around 3060
Traders, If you liked this educational post🎓, give it a boost 🚀 and drop a comment 📣

Hellena | GOLD (4H): LONG to resistance area 3075.Colleagues, I believe that price will reach the 3075 area, completing an upward five-wave impulse. Earlier I talked about the level of 3100 and I believe that it will be reached too, just a little later and after a correction.
In any case, within the wave “3” of the senior order, gold is waiting for an upward movement, because the big impulse is not completed yet.
Manage your capital correctly and competently! Only enter trades based on reliable patterns!

Gold Recovers After Dip – Is a New ATH Next?After reaching its recent all-time high exactly one week ago, Gold began a correction, dropping to $3,000, where buyers stepped in. This led to a recovery, pushing the price above a key resistance zone at $3,025–$3,030.
At the time of writing, the price is sitting at the upper boundary of this support zone. If it stabilizes above this level, a new ATH could be on the horizon.
I remain bullish as long as the daily close stays above this zone.
Disclosure: I am part of Trade Nation's Influencer program and receive a monthly fee for using their TradingView charts in my analyses and educational articles.

Market Consolidation Key Levels for Profitable Moves and 1000Hey Trader! 👋
Market in Range Consolidation – Time to Make Smart Moves! 🔥
Right now, the market is consolidating in a tight range between 3015 to 3030, creating a perfect opportunity to sell at resistance and buy at support. 📉📈 The price action is bouncing back and forth, and our strategy is simple—wait for the range break to confirm the next big move! 🚀 If we get that break, we're looking at 1000 pips profit potential! 💰
🔑 KEY LEVELS:
- BUY at3050: Watch for a potential breakout above this level! If the market pushes past here, we could see a new all-time high (ATH) and 3100 isn't too far off for gold! 🏅✨
- SELL at 3000: First, let’s see if the market sweeps this level. If it does, we could be headed to **2970**—another great opportunity to capitalize on the bearish move! 📉
As always, follow risk management to protect your capital. 📊🔒 Set your stops and position sizes wisely, and stay patient as we wait for that key range break to confirm the trend! 🛑⚖️
Ready to make moves? Let’s keep an eye on these key levels and let the market come to us! 💪💥

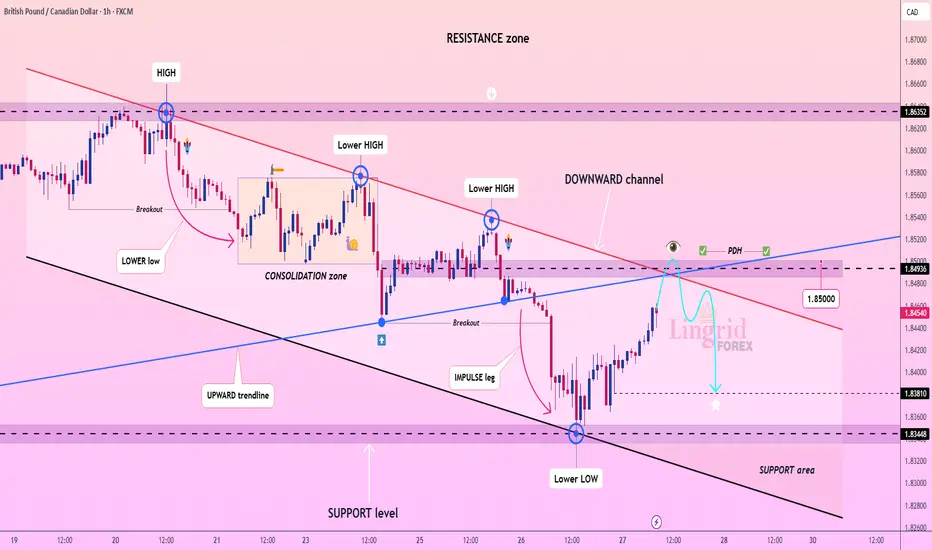
Lingrid | GBPCAD anticipating REBOUND from KEY Resistance ZoneFX:GBPCAD market bounced off the support level and is moving toward the key level of 1.8500. Overall, the price is creating lower lows and lower closes on the 1H timeframe showing bearish trend. I think that if the price forms a false breakout above the previous day's high and the psychological level at 1.8500, there is a good chance the market will continue lower. Additionally, the channel border and upward trendline create a solid confluence zone for shorting the market if a signal presents itself. I expect the price to keep pushing lower unless it breaks above the channel. My goal is to support zone around 1.83810
Traders, If you liked this educational post🎓, give it a boost 🚀 and drop a comment 📣
Lingrid | ARBUSDT pullback TRADE. Potential SHORT OpportunityBINANCE:ARBUSDT market tested the support level before rolling back toward the psychological level of 0.400, appearing to form an ABC pullback that typically precedes a retracement. With the market moving above last week's high, I anticipate a potential price drop after it grabs liquidity above that point. A comparison of the current bullish pullback with the stronger bearish moves on the left suggests the bears are more dominant than the bulls. If the market fails to break through the channel border, trendline, and resistance at 0.420, we can expect a downward movement to lower levels. My goal is support zone around 0.3500
Traders, If you liked this educational post🎓, give it a boost 🚀 and drop a comment 📣

Lingrid | GOLD price SQUEEZE Signals a Surge AheadOANDA:XAUUSD market has formed a triangle pattern, which is a continuation pattern, and it appears likely to break through the downward trendline. On the 4H timeframe, the price has created long-tailed bars, suggesting bullish pressure that could lead to a retest of the all-time high level. Since the price bounced off the 3000 level twice, I think the market will move higher if it breaks and closes above the triangle pattern, setting up a classic contraction continuation scenario. My goal is resistance zone around 3038
Traders, If you liked this educational post🎓, give it a boost 🚀 and drop a comment 📣

Trading opportunity for BIDUSDTBased on technical factors there is a Buy position in :
📊 BIDUSDT
🔵 Buy Now
🪫Stop loss 0.04350
🔋Target 0.08000
📏 R/R 2,6
💸RISK : 1%
We hope it is profitable for you ❤️
Please support our activity with your likes👍 and comments📝

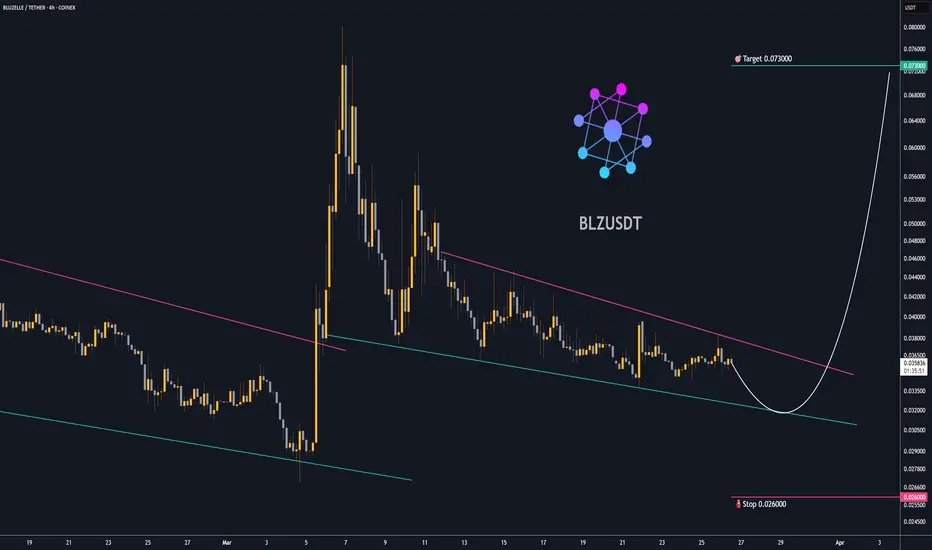
Trading opportunity for BLZUSDTBased on technical factors there is a Buy position in :
📊 BLZUSDT
🔵 Buy Now
🪫Stop loss 0.026000
🔋Target 0.073000
📏 R/R 3,8
💸RISK : 1%
We hope it is profitable for you ❤️
Please support our activity with your likes👍 and comments📝
Lingrid | CADJPY anticipating UPWARD Continuation after PullbackThe price perfectly fulfilled my previous idea . It hit the target. FX:CADJPY market is showing bullish dominance, by the formation of higher highs and higher lows. On the daily timeframe, an inside bar pattern has formed, suggesting a potential consolidation followed by a continuation move since it closed above the 105.000 level. Currently, the price is testing the Monday high, and if it breaks above this level, we can anticipate further upward movement. I expect the price to establish a range around this level before advancing to higher levels from the previous week high and upward trendline. My goal is the resistance zone around 106.300
Traders, If you liked this educational post🎓, give it a boost 🚀 and drop a comment 📣

Lingrid | LINKUSDT short-term BULLISH Momentum in the MARKETThe price perfectly fulfilled my previous idea . It hit the target level. BINANCE:LINKUSDT has gained upward momentum on the 1H timeframe, surging above the 15.00 level and downward trendline. On the daily timeframe, we see a series of four consecutive bullish candles, indicating strong buying pressure. Recent price action suggests the formation of ABC signals, implying that the market is positioning itself for an upward move towards the next resistance level around 17.00. As momentum builds, it is likely to test this key level, which could lead to further price increases unless sudden negative news triggers sell offs. Overall, I expect a pullback followed by a continuation move. My goal is the resistance zone around 16.45
Traders, If you liked this educational post🎓, give it a boost 🚀 and drop a comment 📣
