Lingrid | USDCHF Corrective MOVEMENT and TREND ContinuationFX:USDCHF market is consolidating after the bearish momentum. We can see the price making lower lows and lower closes showing bearish dominance. The market bounced off the support level and is forming a corrective leg against the major bearish trend. I think the market may retest the resistance zone at 0.88700, which is a range zone that often acts as both support and resistance. If we see a rejection at this area, we can anticipate the continuation of the current trend toward the previous week low. My goal is support zone around 0.87750
Traders, If you liked this educational post🎓, give it a boost 🚀 and drop a comment 📣
Signalservice

Lingrid | GOLD channel BREAKOUT: All-Time HIGH on the Horizon?The price perfectly fulfilled my previous idea. It hit the target zone. The price of OANDA:XAUUSD is currently at a critical level, as it faces resistance near the weekly high and the February high, where it may struggle to break above. However, the price broke and closed above the upward channel, which is a bullish sign. Overall, the price action is forming an ABC move, with point C expected to complete around the 2975 level. Additionally, the price has broken above a bullish flag pattern on the 1H timeframe. Given the high-impact today, there is a possibility that the price could make a false breakout above the February high before pulling back after the news release, so caution is warranted. I expect the market to complete the ABC move, although there is also a chance that the price may take liquidity above the key resistance before rolling back. My mid-term goal is resistance zone around 2975
Traders, If you liked this educational post🎓, give it a boost 🚀 and drop a comment 📣

BNXUSDT(BinaryX) Updated till 13-03-25BNXUSDT(BinaryX) Daily timeframe range. despite market downtrend its still on its midrange. buyers are not giving up that easy. if market cools down it got potential. for that it needs to stay above 0.7158. local resistance at 1.2646.

Lingrid | NZDUSD long Trade SETUP in CONSOLIDATION ZoneThe price perfectly fulfilled my previous idea. It hit the target zone. FX:NZDUSD market is currently consolidating after a period of bullish momentum. It has been making false breakouts at previous support and resistance zones, indicating that it is in a sideways trend. The market is approaching the previous day's low, and I believe it may create a false breakout in this zone before moving higher, especially given the prevailing bullish momentum. My goal is resistance zone around 0.57270
Traders, If you liked this educational post🎓, give it a boost 🚀 and drop a comment 📣

Lingrid | BNBUSDT capitalizing on the PULLBACK OpportunityThe price perfectly fulfilled my previous idea. It hit the target. BINANCE:BNBUSDT market is continuing to create lower lows and lower closes showing bearish dominance. It recently broke below the 600 level and has retested the area above the psychological level of 500. Currently, the price is forming an ABC pullback toward the trendline, with the next key resistance zone around the 600 level. I think the price might rebound from this level and continue to push lower, unless the market formes an impulse leg toward the resistance zone. My goal is support zone around 546.
Traders, If you liked this educational post🎓, give it a boost 🚀 and drop a comment 📣

Lingrid | GOLD bullish TREND Continuation PotentialOANDA:XAUUSD market tested the 2880 level as I anticipated yesterday. It formed a false breakout from the consolidation zone and moved higher, breaking above the 2900 level and by taking liquidity from below the range zone. Currently, the price is testing the midpoint of the consolidation zone, which typically acts as both support and resistance. Therefore, there is a possibility that the price may roll back, especially if upcoming news proves to be negative for the market. However, this seems unlikely given the current bullish momentum. Since the price has tested the zone below the consolidation zone, I expect it to aim for the zone above the consolidation zone and previous week high. My goal is resistance zone around 2935
Traders, if you liked this idea or if you have your own opinion about it, write in the comments. I will be glad 👩💻

Gold Breaks Out: Is a New All-Time High on the Horizon?Finally, after a week of range-bound trading and a false downside breakout, Gold has found direction and surged to the upside.
As expected, the inflation data served as the catalyst. With the reported figure coming in lower than anticipated, traders are now pricing in potential rate cuts.
Technically, as mentioned, the price broke above the 2930 resistance level and reached a high at 2947 just shy of the all-time high.
Currently, Gold is undergoing a normal correction, which should present traders with an opportunity to buy at lower levels. The ideal buy zone is between 2920 and 2930, with the bullish outlook negated if the price falls back into the previous range.
In terms of targets, the old ATH acts as resistance, but I wouldn’t be surprised if Gold pushes higher and sets a new record above the 2960 zone.
Disclosure: I am part of Trade Nation's Influencer program and receive a monthly fee for using their TradingView charts in my analyses and educational articles.

VICUSDT(VICTION) Updated till 12-03-25VICUSDT(VICTION) Daily timeframe range. we can see a decent pull back from its new low. and making 0.1825 its recent support. it will be more optimal here if PA can get a valid close above 0.3187. fails their will send it back to trouble zone.

GBPJPY BULLISH OR BEARISH? TRADE IDEAGBPJPY Trade Idea | 1H Timeframe
Price recently tapped into a key supply zone / resistance trendline confluence, showing signs of a potential rejection from the liquidity grab area marked in yellow.
🔹 Liquidity Sweep above recent highs observed.
🔹 Price is reacting from the supply zone, indicating bearish intent.
🔹 Sell-side liquidity range marked below as potential target zone.
🔹 Expecting price to drop further toward 191.500 – 191.300 range after this minor pullback.
🎯 Entry: Around 192.400
🛑 SL: Above 193.300
✅ TP: 191.300 – Risk-Reward ~3.5R
A clean rejection setup after liquidity manipulation – following smart money concept.
Let me know your thoughts below 👇
#GBPJPY #SmartMoneyConcept #LiquiditySweep #ForexAnalysis #PriceAction #SMC #ForexTrading #SupplyAndDemand

Lingrid | EURJPY corrective MOVEMENT from KEY Resistance ZoneThe price perfectly fulfilled my previous idea. It reached the target zone. FX:EURJPY market has formed higher highs and higher closes, yet there remains strong resistance above. On the higher time frame, the price has been oscillating between 155,000 and 165,000, and it seems to be approaching the top of this range near last year’s closing level. If we get rejection at the psychological level of 163,000, we can expect a pullback from this point. Additionally, on the daily time frame, there is a global downward trendline that the price has bounced off multiple times. My goal is support zone around 160.250
Traders, If you liked this educational post🎓, give it a boost 🚀 and drop a comment 📣

BTC/USDT updateBefore the correction, we had already shared the most probable scenario for #BTC in Spot Club and, with a slight delay, in this channel. As expected, the price dropped around 11% in spot within wave C, leading to significant liquidity being absorbed in the market.
However, we had already warned tarde-ai.bot members about this potential move in advance.
We still consider our previous outlook as the most probable scenario for Bitcoin's next move. If our perspective changes, we will update the analysis accordingly.

Lingrid | ADAUSDT ongoing BEARISH Pressure in the MARKETSBINANCE:ADAUSDT market initially tested the January highs before dropping, taking liquidity above. On the weekly time frame, a massive bearish engulfing candle has formed suggesting further bearish move. Given that we've recently witnessed a dead cat bounce in the markets, I believe the price may push lower towards the November low zone. I expect the market to consolidate a bit in this area before continuing its downward trend by breaking through the upward trendline towards the next liquidity zone below February low. My goal is support zone around 0.5266
Traders, If you liked this educational post🎓, give it a boost 🚀 and drop a comment 📣

Hellena | EUR/USD (4H): LONG to the area of 1.08878.Colleagues, I'm going to make a new forecast that will be a little different from the last one. In the past, the price quickly reached the target, but I still expect a correction in wave “4” to the 1.06966 area to open profitable long positions. The target will still be the same 1.8978 area.
Manage your capital correctly and competently! Only enter trades based on reliable patterns!

Lingrid | TRXUSDT Remains in a CONSOLIDATION PhaseAfter the recent sell-off, BINANCE:TRXUSDT market has been moving sideways within a downward channel. The price is consolidating below the key level of 0.25. Zooming out, we can observe that the price is forming a triangle pattern. I believe there is a possibility of a fake breakout at the channel boundary and resistance zone, which would likely lead to continued sideways movement. If a false breakout occurs at the resistance zone, I expect the price may move to lower levels, especially since this area coincides with the previous week’s highs from the last two weeks. My goal is support zone around 0.2250
Traders, if you liked this idea or if you have your own opinion about it, write in the comments. I will be glad 👩💻

BANANAUSDT(BananaGun) Updated till 11-03-25BANANAUSDT(BananaGun) Daily timeframe range. we can see a retrace here but need more push to actually get over 19.82. getting over 19.82 is more optimal here below that is a trouble zone. PA found a support at 10.82 breaking below is void zone.

Short-Term Opportunity in NAS100: Rebound in Play?Since reaching its all-time high (ATH) three weeks ago, NAS100 has dropped approximately 3,000 pips, hitting a low near the 19,000 zone yesterday.
Currently, the CFD price is rebounding, and this recovery could extend into the New York trading session.
Although my overall correction target remains around 18,000, I anticipate a short-term relief rally at this stage.
From a short-term trading perspective, the 19,000 level could present a good entry opportunity. With a tight stop and a target slightly above 20,000, this setup offers a favorable risk-reward ratio.

Lingrid | XRPUSDT Head and Shoulders Pattern: Bearish Signal?BINANCE:XRPUSDT is currently making lower lows and lower closes. The market took liquidity above the 2.80 level before pulling back to the support level at 2.00. This movement essentially created a false breakout, suggesting that buyers are hesitant to enter the market at those price levels. Taking a broader view, we can observe that the price action is forming a head-and-shoulders pattern, which is typically indicative of a reversal. Given that the previous weekly candle was a significant bearish candle, it suggests that the price may retest the 1.50 level. Therefore, I anticipate XRP to retest the resistance followed by moving lower. My goal is support zone around 1.63
Traders, if you liked this idea or if you have your own opinion about it, write in the comments. I will be glad 👩💻

Choppy Gold Price Action: Bearish Bias, But With CautionIn my post yesterday, I mentioned that Gold would likely break below the 2900 support zone.
Indeed, after multiple tests and annoying price action, the price finally dropped below this level, reaching an intraday low of 2880. However, it quickly reversed and is now trading back around the same level.
To be honest, while my outlook remains slightly bearish, this kind of choppy movement is not ideal.
In conclusion, my strategy remains to sell on rallies—but with caution and lower volumes.
Disclosure: I am part of Trade Nation's Influencer program and receive a monthly fee for using their TradingView charts in my analyses and educational articles.

Lingrid | BTCUSDT falls to NEW Lower LOWS. Potential Short BINANCE:BTCUSDT price dropped below the 90,000 level. The previous weekly candle was a big bearish one, indicating a decline of 15%. Recently, the price broke below the upward trendline and closed below the higher low indicating potential trend continuation. I think the market will continue to push lower to test the liquidity below February's low. I anticipate that the price may find support around the October highs, between 74,000 and 76,000. Overall, I expect the price to bounce off the resistance and the upward trendline. My goal is support zone around 76700.00
Traders, if you liked this idea or if you have your own opinion about it, write in the comments. I will be glad 👩💻

Lingrid | GOLD Weekly Market OUTLOOK: Sideways MOVE After 2900 This trading week the OANDA:XAUUSD market went through a three-day sideways movement following two trending days. After breaking through the 2900 level, the price is now stuck in the range zone. Notably, the price failed to reach last week's high or low, forming an inside bar pattern on the weekly timeframe. This suggests that a false breakout of last week's highs or lows could determine the next move in the market in the near term.
Interestingly, gold struggled to rally further upward despite the sharp drop in TVC:DXY amid escalating trade tensions. This may indicate that prices may continue to move sideways between 2940 and 2870. Zooming out, we can expect that price action appears to be forming a triangle pattern, which is a typical consolidation pattern. I think there is a possibility that the market could form a second corrective leg down or retest the weekly opening levels. Some oscillators are showing a hidden bearish divergence, which supports the idea of another corrective leg down. Overall, I expect the market to continue to fluctuate until price breaks above or below last week's high or low.
Traders, if you liked this idea or if you have your own opinion about it, write in the comments. I will be glad 👩💻

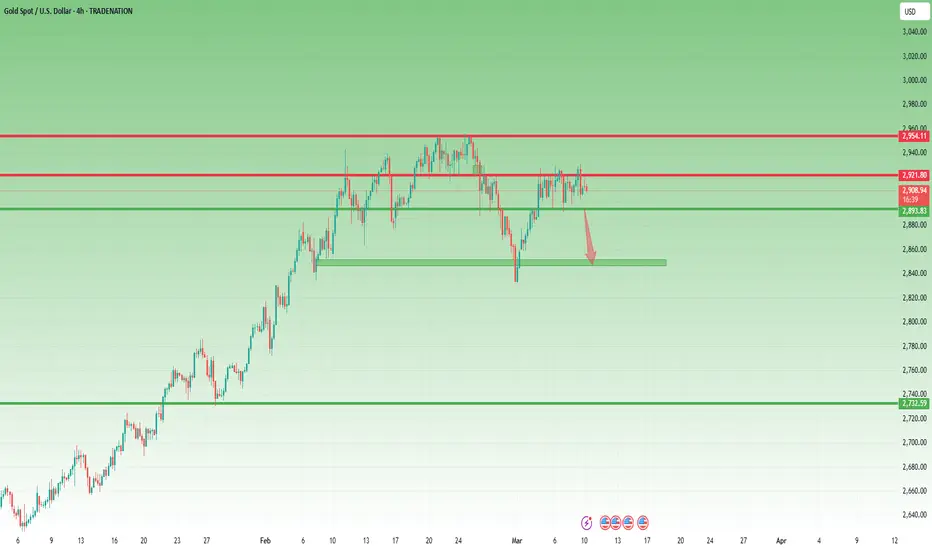
Gold Outlook Unchanged: Waiting for a Break Below SupportFriday's NFP turned out to be a non-event, with gold prices remaining stuck in their familiar range between 2,895 and 2,930.
Following the announcement, prices initially spiked to resistance but quickly retreated to the middle of the range by the weekly close.
Looking ahead, my outlook remains unchanged—I expect a break below the 2,895 support level. If this happens, we could see accelerated downside momentum, potentially testing recent lows in the 2,830–2,840 zone.
My strategy also remains the same: selling rallies against the range’s resistance.
Disclosure: I am part of Trade Nation's Influencer program and receive a monthly fee for using their TradingView charts in my analyses and educational articles.
Lingrid | EURUSD pullback After an IMPULSIVE SurgeFX:EURUSD market reached the November high area and is currently testing last week's high as well. On the weekly timeframe, the price has formed a large bullish candle, indicating an impulse leg. Typically, after such a move, prices tend to make a sharp drop. Given the presence of both the weekly and November highs above, I think the market may struggle to move higher. I expect a more oscillating phase below the resistance. On the 4H timeframe, the price has formed a higher high; however, there is a bearish divergence that supports the idea of a corrective move in the market. I expect a short-term pullback from the resistance zone. My goal is support zone around 1.07000
Traders, if you liked this idea or if you have your own opinion about it, write in the comments. I will be glad 👩💻

Hellena | GOLD (4H): LONG to resistance area 2955 (Wave 3).Dear Colleagues, after Trump's statements and the general political situation, the price went sharply into a downward movement, but this does not mean that I give up the upward movement.
At the moment I think that wave “2” is completing the correction and soon we will see the long-awaited upward movement.
I think that the price can still update the minimum of wave “2” in the area of 2833, then (or immediately) will start an upward movement in wave “3” at least to the area of the maximum of 2955 of wave “1”.
Manage your capital correctly and competently! Only enter trades based on reliable patterns!
