Lingrid | EURJPY bullish Opportunity from DEMAND ZoneThe price perfectly fulfilled my previous idea. It reached the target zone. FX:EURJPY market made a false breakout of the support zone around the 156,000 level. On the daily timeframe, we can see that the price reached a demand zone it has bounced off multiple times. Recently, the price broke through the previous high in market structure, then pulled back to retest the support level and the upward trendline. I expect the price to retest the upper boundary of the channel and potentially move above it. My goal is resistance zone around 158,000
Traders, if you liked this idea or if you have your own opinion about it, write in the comments. I will be glad 👩💻
Signalservice

AAVEUSDT(Aave) Updated till 04-03-25AAVEUSDT(Aave) Daily timeframe range. consider how recently market dumped its still on its February range. we can see strength of buyers and holders here. now if it can hold 180.12 and stay above it that can push it to recent resistance 261.10.

Gold Recovers After a Sharp Drop – What’s Next?Last week was a tough one for Gold bulls, with the price dropping sharply to a low of $2,830, breaking through multiple support levels.
However, after Friday’s close back above the $2,850 zone, the market opened on Monday with a gap. Once that gap was filled, the price rebounded, breaking back above the key $2,880–$2,890 technical zone.
Furthermore, at the time of writing, Gold is trading at $2,915, nearing the next technical resistance at $2,920.
What’s Next?
✅ Bulls currently have the upper hand, and as long as the $2,890 zone holds, new all-time highs (ATHs) could be on the horizon.
✅ I'm currently out of the market, but if the price stabilizes above $2,900, buying dips should be the preferred strategy.
Disclosure: I am part of Trade Nation's Influencer program and receive a monthly fee for using their TradingView charts in my analyses and educational articles.

Lingrid | PEPEUSDT the "Dead Cat Bounce" in the MarketsThe price perfectly fulfilled my previous idea . It reached the target. BINANCE:PEPEUSDT market initially took liquidity above the range zone before pulling back and making a lower low. The entire crypto market appears to be experiencing a "dead cat bounce." On the monthly timeframe, the price formed a significant bearish candle, indicating a potential further downward move. I think that the price will retest the middle of the range zone, as it often acts as a support or resistance level and then push lower September low. My goal is support zone around 0.00000585
Traders, if you liked this idea or if you have your own opinion about it, write in the comments. I will be glad 👩💻

Hellena | EUR/USD (4H): LONG resistance area 1.04630 (Wave 5).Dear colleagues, I decided that I will make a new forecast, as the previous forecast was put to breakeven and the price updated the low of 1.04016.
At the moment I have redrawn the waves a bit and I still believe that the upward movement will continue, as the five-wave impulse is not over.
I believe that the price may slightly update the minimum of wave “4”, then I expect the price to reach at least the area of 1.04630.
Manage your capital correctly and competently! Only enter trades based on reliable patterns!

Lingrid | GOLD Weekly Technical AnalysisOANDA:XAUUSD market closed February with a significant pullback, creating a wick on the monthly timeframe that retraced over 50% of the recent bullish gains. On the weekly chart, price broke and closed below the lows of the previous two weeks, signaling bearish momentum after an impressive run of eight consecutive bullish weeks. This pattern suggests we may be entering a correction phase with potential for prices to test and possibly break below February's low.
A critical development is the breakout of the upward trendline that had provided support for the past two months. Additionally, the market has dropped below the psychologically important 2900 level. Daily timeframe analysis shows that bearish moves are demonstrating greater strength compared to bullish rebounds.
The current price action might form an ABC correction pattern from resistance, with the A leg already in place. Should the market reject the resistance zone above Friday's high, we could see continued downward pressure and lower prices in the near term.
Traders, if you liked this idea or if you have your own opinion about it, write in the comments. I will be glad 👩💻

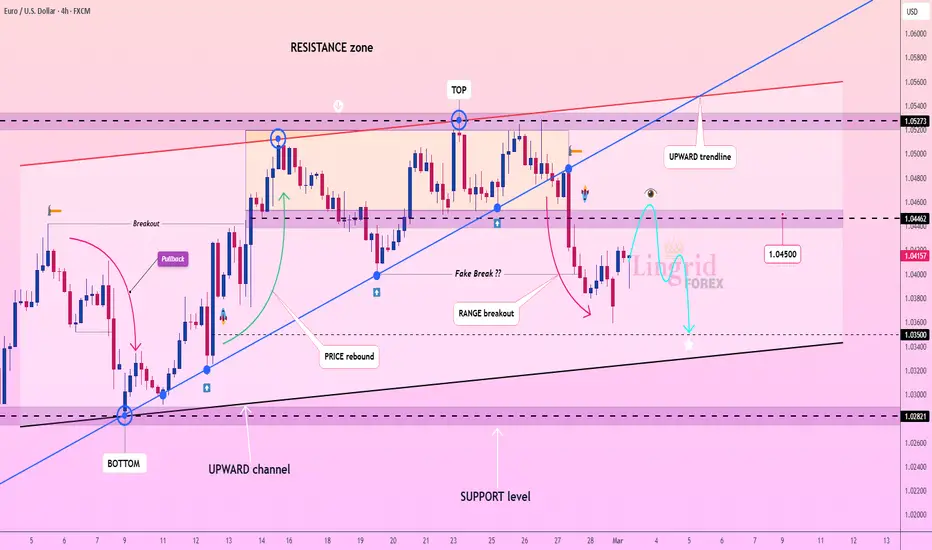
Lingrid | EURUSD possible PULLBACK and BEARISH ContinuationThe price perfectly fulfilled my last idea . It hit the target level. The Monday candle opened with a gap, which was later partially filled. FX:EURUSD price struggled to move above the January high, resulting in a significant bearish weekly candle. On the current timeframe, we can interpret this as a bearish impulse leg that broke and closed below the consolidation zone. On the 1H timeframe, the price action looks like it might form an ABC pullback, retesting the resistance area above 1.04400. If we receive a bearish signal at this zone, I expect the price to continue pushing lower, especially since the market previously experienced a drop from this area. My goal is support zone around 1.03500
Traders, if you liked this idea or if you have your own opinion about it, write in the comments. I will be glad 👩💻
Lingrid | BTCUSDT bullish PATTERN and Long PotentialBINANCE:BTCUSDT market dipped below the December and January lows, but after taking liquidity in that area, it a bounced off creating fake breakout of the consolidation zone. On the weekly timeframe, the price action has created a significant long-tailed bar formation, indicating potential bullish continuation in near future. Additionally, the price has formed a triangle pattern and subsequently broke below it. Historically, after a breakout below a triangle, the price tends to dip approximately 15-20% before rebounding and reaching new highs. Therefore I think that the price will consolidate around the 90,000 level before moving higher toward the all-time high. My goal is resistance zone at 100,000
Traders, if you liked this idea or if you have your own opinion about it, write in the comments. I will be glad 👩💻

AMPUSDT(Amp) Updated till 01-03-25AMPUSDT(Amp) Daily timeframe range. PA tried to get out of 0.005483 need little bit more volume here for that. it got long way to go. if PA can stay above 0.004353 breaking its recent resistance wont be a problem.

Lingrid | SUIUSDT continues to CONSOLIDATE after SELL OFFBINANCE:SUIUSDT is currently consolidating below the round number of 3.00, and it may continue to move sideways following the recent fake breakout of the support level. The price is still trading within the weekly range, indicating a lack of strong directional momentum. There is a possibility that the price may retest the 2.00 support area, which corresponds to the highs from October, especially since the market has broken below the 3.00 level. Given the sideways movement, I expect the market to retest the recent support level from the psychological level at 3.00 before potentially making further moves downward. My goal is support zone around 2.6630
Traders, if you liked this idea or if you have your own opinion about it, write in the comments. I will be glad 👩💻

Solana’s 60% Correction: Time to Buy the Dip?After reaching an all-time high around the $300 zone, Solana experienced a sharp decline of approximately 60%, dropping to a key support level above $120.
This pullback could present a strong buying opportunity for speculators anticipating a reversal toward $200.
Conclusion:
✅ Dips below $140 should be considered potential entry points.
✅ The setup becomes invalid if the price closes below $120 on a daily basis.
✅ A move toward $200 remains a reasonable and achievable target.

Ethereum’s Dip: A Golden Buying Opportunity?Ethereum has been a disappointment for traders.
Many were expecting a new all-time high, but so far, Ethereum has failed to deliver.
However, for speculators like me, this type of market movement presents an ideal trading opportunity.
Recently, ETH reached a key confluence support zone around the psychologically significant $2,000 level, reinforced by multiple technical factors. This setup suggests a strong potential for a reversal.
What’s Next?
✅ The $2,000 support zone remains critical, and I expect it to hold, leading to an upside move.
✅ While not aiming for extreme highs, I’m looking to buy dips near $2,200 with a target around $2,800.

ICP Trading Plan: Buying Dips with a 1:3 Risk-Reward RatioLike most altcoins, ICP has been declining since December. At the beginning of February, it reached a key support level around $6. After this drop, the coin began to consolidate, but recent price action suggests a potential reversal to the upside.
A confirmed breakout above $7 would strengthen this outlook, potentially leading to a test of the psychologically significant $10 level.
I’m looking to buy dips in anticipation of this scenario, aiming for a minimum risk-to-reward ratio of 1:3.

ERNUSDT(EthernityChain) Updated till 28-02-25ERNUSDT(EthernityChain) Daily timeframe range. over 129% retrace within market dump day thats some serious performance. buyers packed their bag if it can stay above its local low 1.202 it can push again. recent resistance at 1.677.

Lingrid | EURUSD Drops from 1.05000 RESISTANCE. Possible ShortFX:EURUSD market formed a triangle-shaped pattern, indicating a price squeeze. Following the release of high-impact news, the price dropped, remaining mostly sideways before breaking through the upward trendline and the range zone. On the daily timeframe, the price broke and closed below the previous weekly low, forming a significant bearish candle. I think the price may continue on this bearish momentum towards the January close level. I expect the market to form an ABC pullback before pushing lower, especially if upcoming news does not drive the market higher. My goal is support zone around 1.035500
Traders, if you liked this idea or if you have your own opinion about it, write in the comments. I will be glad 👩💻

Lingrid | GOLD under SELLING Pressure. BEARISH Reversal ?OANDA:XAUUSD market moved lower following the release of the Unemployment Claims data, breaking below the lows of the last two weeks. On the monthly timeframe, we can observe that the price is forming a long tailed bar pattern and it may close near the level of the previous month's high. Additionally, the market broke below the upward channel and dipped below the swap zone that previously acted as support and resistance. I expect the price to pull back towards the resistance zone around 2880–2890 or Wednesday low before continuing the bearish movement. Don't forget that new economic data is set to be released today, it could significantly impact the market. My goal is support zone around 2825
Traders, if you liked this idea or if you have your own opinion about it, write in the comments. I will be glad 👩💻

Lingrid | TONUSDT Bearish MOMENTUM. Shorting PotentialThe price perfectly fulfilled my previous idea. It reached the target level. OKX:TONUSDT is currently making lower lows and it has closed below the 3.50 mark. Furthermore, the February monthly candle potentially will close bearish, indicating that the price could drop to even lower levels. On the daily timeframe, the market has formed lower lows, with the price recently reaching the February high from 2024. I think the market may retest the 3.00 levels to test the liquidity below. As a result, I anticipate that the market will continue to push lower. My target is support zone around 3.00
Traders, if you liked this idea or if you have your own opinion about it, write in the comments. I will be glad 👩💻

DXY Correction Plays Out – Is a Reversal Next? Since the end of January, I have been anticipating a correction in the TVC:DXY , with a target around the 106 support level.
This correction has unfolded as expected, with the Dollar Index touching 106 on Monday, followed by another test and reversal yesterday.
A key observation is that since the early February spike, the DXY has been trading within a falling wedge—a pattern that often signals a potential reversal.
What’s Next?
✅ Bullish confirmation would come with a daily close above the 106.60–106.70 zone. If this happens, we could see a move up to 108.50, a key resistance level.
✅ Interim resistance sits at 107.30, which could also act as a potential target for bulls.
Trading Implications:
If the Dollar Index confirms an upside breakout, it could present selling opportunities in FX:EURUSD , FX:GBPUSD , FX:AUDUSD , and TRADENATION:NZDUSD .

Gold Outlook: Bearish Pressure ContinuesYesterday, Gold once again rebounded from the newly formed support around 2890. However, after reaching the 2920 resistance zone, the price started to decline again.
While the daily candle on the chart appears as a Doji, signaling indecision, overnight price action suggests renewed downside pressure, testing support once more.
The overall chart structure and price action indicate that this support level is likely to break. In my view, even the older technical support at 2880 may not hold.
🔹 Trading Strategy:
✅ Focus on selling rallies, with confirmation below support.
✅ Negation of the bearish bias only occurs if Gold moves above 2920 resistance.
✅ Target: A deeper correction towards 2850.
Stay disciplined and trade wisely! 📉
Disclosure: I am part of Trade Nation's Influencer program and receive a monthly fee for using their TradingView charts in my analyses and educational articles.

Lingrid | GOLD short-Term BULLISH Momentum KEY SupportThe price perfectly fulfilled my previous idea. It reached the target level. OANDA:XAUUSD market is currently testing the previous week's low and Tuesday's low. After breaking through the triangle pattern, the price has moved lower, but I think we may see a short-term bounce off these levels. Given the high-impact news scheduled for today, the market is likely to be volatile, so we should proceed with caution. If the price closes above the 2890 level, it may continue to rise and retest the midpoint of the triangle pattern. Overall I expect short term upward move from the PWL zone. My goal is resistance zone around 2910
Traders, if you liked this idea or if you have your own opinion about it, write in the comments. I will be glad 👩💻

Gold Drops Hard – Will 2880 Be the Next Support Test? Yesterday was marked by significant volatility in Gold.
After reaching an intraday high of 2945, the price plummeted more than 500 pips, hitting a low of around 2890.
As I highlighted in my previous analysis, 2930 was a key pivot level, and breaking below it triggered an accelerated decline. This level has now turned into resistance and was already tested overnight.
Looking ahead, this correction may not be over yet and the price could drop below 2900 again and we could see a test of the 2880 horizontal support level.
I remain bearish on Gold as long as the 2930–2935 zone remains intact. 📉
Disclosure: I am part of Trade Nation's Influencer program and receive a monthly fee for using their TradingView charts in my analyses and educational articles.

Lingrid | EURNZD shorting After RESISTANCE Zone RejectionFX:EURNZD market broke above the range zone and is now heading toward the resistance zone at 1.84500, as well as the channel boundary. However, since the market moved above the previous week's high, I believe it may soon reverse and move downward forming fake breakout. This is supported by the fact that the price is currently testing an area where it previously dropped and there is bearish divergence on the 1H timeframe. Therefore, I think there is a good chance that the weekly candle may close below the previous week's high at the end of the trading week. My target is support zone around 1.83350
Traders, if you liked this idea or if you have your own opinion about it, write in the comments. I will be glad 👩💻

Lingrid | DOTUSDT selling Opportunity Amidst SIDEWAYS TrendBINANCE:DOTUSDT market is currently moving sideways after the recent sell-off in January, with prices making lower lows on the weekly timeframe. Consolidation is occurring between the 4.50 and 5.50 levels. I think the price may test the area above this consolidation zone, where liquidity is present. I expect the price will bounce off the resistance zone, which is defined by an upward trendline and the channel boundary. If we see the formation of rejection candles, the likelihood of a bounce increases. My goal is support zone around 4.50
Traders, if you liked this idea or if you have your own opinion about it, write in the comments. I will be glad 👩💻
