PNUTUSDT(PeanuttheSquirrel) Updated till 22-02-25PNUTUSDT(PeanuttheSquirrel) Daily timeframe range. 0.1356 is like its last low from its old data. breaking that will push it down to price discovery. buyers trying to hold it now pushing it to 0.2273. thats recent resistance.
Signalservice

Lingrid | XLMUSDT triangle PATTERN. Breakout on the HORIZONBINANCE:XLMUSDT market is forming a triangle pattern, indicating a consolidation phase. However, the price dipped below the December and January lows, testing the psychological level at 0.3000 before bouncing back. Since the price has been trading above the upward trendline for the past three weeks, I think it may continue to bounce off this line. I expect the price to move toward the next key resistance level around 0.4000. My goals is resistance zone around 0.3500
Traders, if you liked this idea or if you have your own opinion about it, write in the comments. I will be glad 👩💻

PYTHUSDT(PYTHNETWORK) Updated till 20-02-25PYTHUSDT(PYTHNETWORK) Daily timeframe range. looks like it found a support at 0.1732. it will be optimal if it stays above it below that is a void. recent resistance at 0.2673. if money flows into it, it could cover some range here.

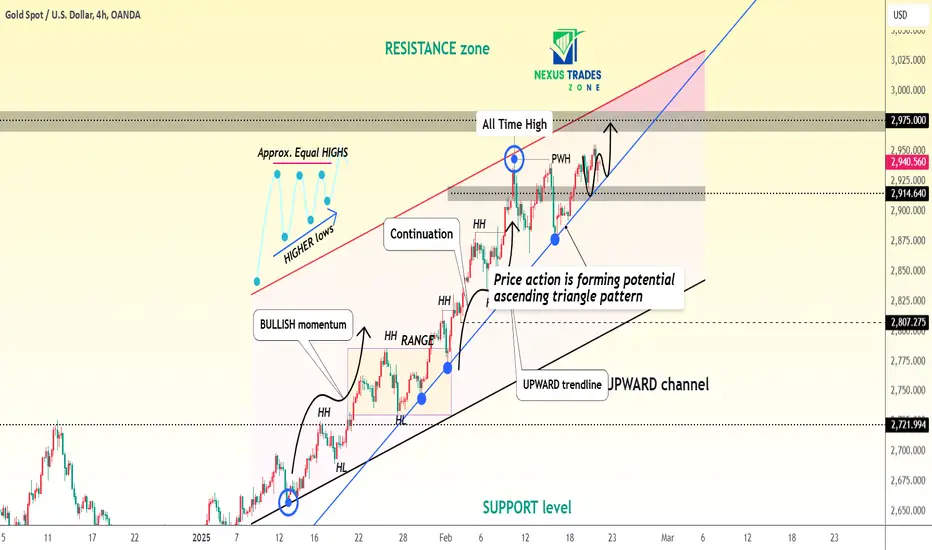
Gold (XAU/USD) Analysis – Bullish Momentum with Ascending TriangFollowing the news announcement, the XAUUSD market jumped and reached the resistance zone/equal highs level. Currently, the price is testing the previous week's high and may close higher. Historically, the market has frequently broken and closed above a crucial level on the third or fourth attempt. Given the present positive momentum, the price could rise to the 3000 mark this week. If the price pulls back, it may form an ascending triangle, which is a trend continuation pattern. Overall, I expect the market to continue its upward trend. My target is the resistance zone around 2975.
The market set a new all-time high by breaking and finishing above the previous week's high. The price has now reached the next resistance zone, 2950. As expected, the market broke through the resistance zone on the third attempt. However, we should proceed with caution at this point, as the market may fall below the previous week's high and enter a period of consolidation. This is especially important considering the forthcoming release of Unemployment Claims data, which may affect price movements. Despite this, I predict the price to rise, as the last daily candle formed a doji, signaling market momentum. My target is a resistance zone about 2974.
📊 Timeframe: 4H
💰 Current Price: $2,941
📈 Trend: Uptrend
Market Overview:
Gold has been consistently making higher highs (HH) and higher lows (HL), confirming a strong bullish trend. Price action is currently inside an ascending triangle pattern, signaling a potential breakout to the upside.
Key Levels to Watch:
✅ Resistance Zone: $2,975 – $3,000 (All-Time High)
✅ Support Levels: $2,914 - $2,920 (Current Support), $2,807 (Stronger Support)
✅ Uptrend Confirmation: Price holding above the blue upward trendline
Technical Pattern:
🔹 Ascending Triangle: Price action is forming a series of higher lows while resistance remains steady, indicating a buildup for a possible breakout.
🔹 Upward Channel: Gold remains within a broader bullish channel, further supporting the uptrend.
Trade Plan:
🔹 Bullish Scenario:
If price breaks above $2,975, expect a strong rally toward $3,000+
A successful retest of $2,914 could be an entry for another upward move
🔻 Bearish Scenario:
A breakdown below the trendline support ($2,914) may lead to a correction towards $2,807 - $2,721
XAUUSD READY TO BOOM 3000?Market Structure:
I N B O X- F O R -T R A D E -S I G N A L S
The price has been in an uptrend but recently experienced a pullback.
After making a higher high, the market retraced and is now showing a possible bullish reversal.
Trade Setup:
A long (buy) position is placed, with the entry point around 2,935.725.
Stop-Loss (SL): 2,927.165 (marked in red).
Take-Profit (TP): 2,955.208 (marked in blue).
Risk-Reward Ratio:
The trade is structured with a risk-reward ratio greater than 1:1, which indicates a balanced approach to risk management.
Key Levels to Watch:
Support: 2,930.000 (recent low).
Resistance: 2,955.000 (target level).
If price breaks above the 2,955 resistance, the next target could be 2,970+.
Possible Trading Strategy:
Bullish Confirmation: If price sustains above 2,941, it could indicate further upside momentum.
Bearish Risk: If price falls below 2,935, the trade setup might become invalid, leading to a stop-loss hit.
Conclusion:
📌 The market is currently at a key decision point. If the price maintains above 2,935, buyers may push towards the 2,955 level. However, if the price breaks below support, a deeper pullback may occur. Risk management is crucial in this setup.

Trading minute impulseOn the minute timeframe of GBPJPY at the moment we have the completion of the impulse formation. If the price continues to move in the direction of the impulse and the support zones do not allow it to overcome the base of the impulse, it may reach the targets 1 and 2. If the price fails to advance in the direction of the momentum and overcomes the support zone at the base of the momentum, it is very likely that the price will move sideways or against the direction of the momentum.

Lingrid | GOLD bulls Maintain CONTROL as MARKET Pushes HigherFollowing the news release, OANDA:XAUUSD market surged higher, reaching the resistance zone/equal highs level. Currently, the price is testing the previous week high, and it may close above it. Historically, the market often breaks and closes above a key level on the third or fourth attempt. Considering the current bullish momentum, we could see the price surge towards the 3000 level this week. If the price pulls back, it may form an ascending triangle pattern, a trend continuation pattern. Overall, I expect the market continuing to push towards higher levels. My goal is resistance zone around 2975.
Traders, if you liked this idea or if you have your own opinion about it, write in the comments. I will be glad 👩💻

Lingrid | AUDUSD capitalizing on the BULLISH ContinuationFX:AUDUSD market continues to make higher highs, indicating that bulls are in control. The price has formed a range zone near last week's high, and there is a chance it may break above and reach higher levels. The market formed a small pause before continuing, as the price closed above the psychological level of 0.63000. On the daily timeframe, the price took liquidity below the previous day's low, and the subsequent move higher demonstrates bullish dominance. I expect the price to move toward the upper border of the channel. My goal is resistance zone around 0.64380
Traders, if you liked this idea or if you have your own opinion about it, write in the comments. I will be glad 👩💻

Lingrid | BNBUSDT anticipating BEARISH Shift in the SHORT RUNThe price perfectly fulfilled my previous idea. It hit the target. BINANCE:BNBUSDT market recently tested the area above the 700 level then pulled back by taking liquidity. Currently, the market appears calm and is moving sideways. However, on the 1h timeframe, the price is forming an ABC pattern from the resistance zone. Recently, it broke and closed below the consolidation zone, followed by a pullback to retest this area. I think the price might retest the key support level around 600, as it is moving within the range formed in the previous week. I expect short-term bearish move from the consolidation zone. My goal is support zone around 615
Traders, if you liked this idea or if you have your own opinion about it, write in the comments. I will be glad 👩💻

Hellena | GOLD (4H): LONG to area of 2972.207.Colleagues, if you look at this upward movement, what can you say? Of course the lower order wave “3” continued and updated its top. This means that we can expect 2 variants of events:
1) Price will continue the development of wave “3”.
2) Wave “4” will make a correction and then wave “5” will start.
The target is the area of 2972.207.
Manage your capital correctly and competently! Only enter trades based on reliable patterns!

Hellena | EUR/USD (4H): LONG resistance area 1.05712 (Wave C).Colleagues, I expect that price has not yet completed the upward movement. Judging by the nature of the last waves - this is a big correction “ABC” and at the moment wave “C” should update the maximum. Therefore, I expect to reach the area of 1.05712.
Manage your capital correctly and competently! Only enter trades based on reliable patterns!

Gold Bulls Are Insatiable—Is a Breakout Above 2940 Next?Yesterday, Gold continued its rebound from Friday’s sell-off. Although I expected a new leg down from my 2920-2925 sell zone, the price exceeded that level and retested the all-time high zone for the third time in just eight days.
This type of price action—strong reversals after a sell-off—could indicate that bulls are not done yet, making a breakout above 2940 likely.
At this point, I’ve cut my losses and exited the market, waiting to see if the price confirms the potential for a new all-time high this week.
Disclosure: I am part of Trade Nation's Influencer program and receive a monthly fee for using their TradingView charts in my analyses and educational articles.

Lingrid | NZDUSD Trend Continuation Trade. LongFX:NZDUSD market continues to establish higher highs and higher lows, showing bullish momentum. It broke and closed above the key level of 0.570000. Overall, the market is forming an ABCD move. The price pulled back towards the support level, then bounced off it, taking out the liquidity below. Furthermore, on the daily timeframe, the price made a fake breakout of the previous day's low. Considering this fake breakout, it could signal a trend continuation, completing the ABCD move. I expect the price moving higher, potentially retesting the November low. My goal is resistance one around 0.57800
Traders, if you liked this idea or if you have your own opinion about it, write in the comments. I will be glad 👩💻

Lingrid | SOLUSDT monthly Low FALSE Break. Potential BUYThe price perfectly fulfilled my previous idea. The market has reached the January low, as I predicted in my previous post. It has also almost touched the November low. I believe the market might bounce off the support level around the 150 level, a significant psychological level, and then move higher. Before the recent drop, the price formed a triangle pattern, which on the weekly timeframe looks like a potential fakey pattern. This pattern suggests a reversal. If the price closes above 175 at the end of this week, there is a high probability of the market moving to higher levels. I expect some consolidation at this support zone before a further upward movement, especially given the fake breakout of the previous month's low. My goal is resistance zone around 200
Traders, if you liked this idea or if you have your own opinion about it, write in the comments. I will be glad 👩💻

NZD/USD Strength Persists: Dips Remain Buying OpportunitiesOver the past two weeks, I have drawn attention to major USD pairs, suggesting that a reversal could be imminent and that an upside correction might follow the downtrend from the last quarter of 2024.
NZD/USD is no exception. After finding strong support around the 0.5550 zone, the pair began to reverse to the upside. Following last week’s higher low, it broke resistance on Friday. After an initial correction and confirmation, bulls have regained control.
I expect NZD strength to continue, and as long as 0.5650 holds, there is a high probability of a move toward 0.58 or higher.
In conclusion, buying dips remains a favorable strategy, aiming for a risk-reward ratio of at least 1:2.
Disclosure: I am part of Trade Nation's Influencer program and receive a monthly fee for using their TradingView charts in my analyses and educational articles.

ACHUSDT(AlchemyPay) Updated till 18-02-25ACHUSDT(AlchemyPay) Daily timeframe range. last pump fully retraced now its trying to push back for recovery. confirm close above 0.03076 can send it to 0.04700 if volume keeps up. local support at 0.01999.

EUR/CAD - 1H Trade Setup Must Follow🔹 Pair: EUR/CAD
🔹 Timeframe: 1H
🔹 Analysis Type: Break & Retest
📊 Market Structure:
The price was respecting an ascending trendline but has now broken below it, indicating a possible trend reversal.
A bearish break of structure has occurred, confirming a shift to the downside.
Key Supply Zone around 1.48775, acting as resistance.
Key Demand Zone around 1.47516, a potential target area.
📉 Trade Setup (Short Position):
✅ Entry: After the break of the trendline and a bearish retest near 1.48400 - 1.48775.
📍 Stop Loss: Above the recent high (1.48775).
🎯 Take Profit: 1.47516, aligning with the next demand zone.
📏 Risk-Reward Ratio: 1:2
⚠️ Confirmation Checklist:
✅ Break & Retest of trendline
✅ Rejection from Supply Zone
✅ Momentum shift to bearish
📌 Keep an eye on price action around 1.48400; if price shows rejection with bearish confirmations, this setup remains valid.
🚀 Good luck & trade safe!

Gold–A Bullish Revival or Just a Correction After Friday's Drop?Yesterday was a very quiet day for TRADENATION:XAUUSD traders.
After a normal rebound from the 2880 support, the price hovered around 2900 in a low-volatility environment.
Overnight, bulls found some strength and pushed the price to a high of 2916. At the time of writing, Gold is trading around 2910.
In my view, this is merely a correction following Friday’s sharp drop, not a resumption of the bullish trend. As I mentioned yesterday, I am looking to sell rallies.
My idea would be invalidated by a daily close above Friday’s high.
As for the target, in the medium term, we could see the price drop to 2850.
Disclosure: I am part of Trade Nation's Influencer program and receive a monthly fee for using their TradingView charts in my analyses and educational articles.

Lingrid | GOLD Consolidation ZONE: Possible SHORT SetupOANDA:XAUUSD pulled back to the 2915-2920 resistance zone, as suggested in yesterday's analysis, forming an ABCD move. Looking at the previous price action, we can see that the current bearish momentum is stronger than the previous one, while the current bullish rebound is comparatively weaker. This suggests that we may be entering a consolidation phase or potentially a deeper retracement. We usually see a roll back after the completion of the ABCD move, so I expect a potential bounce from this resistance area. However, with important news scheduled for today, we could see price either break higher or go to lower levels, so caution should be exercised. My goal is support level around 2880
Traders, if you liked this idea or if you have your own opinion about it, write in the comments. I will be glad 👩💻

Lingrid | GBPCAD short OPPORTUNITY - Testing STRONG ResistanceThe price has perfectly followed my previous analysis. OANDA:GBPCAD market is approaching a significant resistance zone. This area is defined by the previous day's high and a level where the price has previously reversed downwards. I expect the market may retest this resistance level and subsequently fall, potentially forming a false breakout. If the price breaks and closes below the upward trendline, I think the pricemight retest of the previous week's low. As a result, I anticipate the long-tailed bar or engulfing candle coupled with divergence, which would signal rejection of the resistance level and confirm a short. My goal is to support zone around 1.78450
Traders, if you liked this idea or if you have your own opinion about it, write in the comments. I will be glad 👩💻

Lingrid | ETHUSDT bullish REVERSAL Potential from Key ZONEBINANCE:ETHUSDT market continues to consolidate following the spike at the beginning of this month. Price is moving sideways above the key zone around 2500. Looking left at previous price action, we can see that this zone has served as a bounce point before, triggering bullish momentum. On the monthly timeframe, price has swept the liquidity below September, October, and November lows, effectively testing last year's low area. After such a significant move, I expect that price could close above the January high on the February monthly candle close and continue to move higher. My goal is resistance zone around 3300
Traders, if you liked this idea or if you have your own opinion about it, write in the comments. I will be glad 👩💻

Bitcoin’s Struggle Continues: Key Levels to WatchBitcoin’s price action over the past two months has been frustrating, with the price stuck in a range.
The brief drop to the 90K zone following Trump’s tax announcement was quickly reversed. However, after a spike above 100K, BTC has once again been consolidating below this key level for the past two weeks.
At the time of writing, BTC/USD is sitting on newly formed support at 95K. A break below this level could lead to another test of 90K.
If bulls fail to hold the 90K support, the price could extend its decline, potentially dropping to 85K in the first instance.

EUR/USD Outlook: Bullish Trend Intact, Next Target 1.06?In my post last week about EUR/USD, I argued that the pair could rise to 1.05 and that dips around 1.03 should be seen as buying opportunities.
Indeed, after briefly dipping below 1.03, the pair reversed to the upside and reached my 1.05 target.
Currently, the pair is undergoing a small correction and is trading at 1.0460 at the time of writing. However, my bullish outlook remains unchanged. Dips around 1.04 should once again be considered buying opportunities.
The next target for bulls could be the 1.06 resistance zone.
Disclosure: I am part of Trade Nation's Influencer program and receive a monthly fee for using their TradingView charts in my analyses and educational articles.
