Lingrid | BTCUSDT strong Bullish Trend Continues The price perfectly fulfilled my last idea . BINANCE:BTCUSDT CRYPTOCAP:BTC broke out of a long consolidation range and confirmed a higher low at 98,200, initiating a new impulsive rally inside the upward channel. The price is now trading well above the 116,643 breakout level and holding near the mid-range of the next resistance zone. As long as the bullish structure holds, price is expected to target the upper resistance band near 130,000 in the coming sessions. Momentum and structure remain in favor of the bulls, supported by trendline and volume strength.
📉 Key Levels
Buy trigger: breakout and sustained move above 116,643
Buy zone: 116,643–120,000 (retest of structure and upper trendline)
Target: 130,000
Invalidation: drop below 116,000 breaks upward trend bias
💡 Risks
False breakouts around resistance zone may delay continuation
Macro uncertainty or ETF-related news can shift sentiment
Failure to hold above 116,643 would expose the trend to deeper correction
If this idea resonates with you or you have your own opinion, traders, hit the comments. I’m excited to read your thoughts!
Signalservice

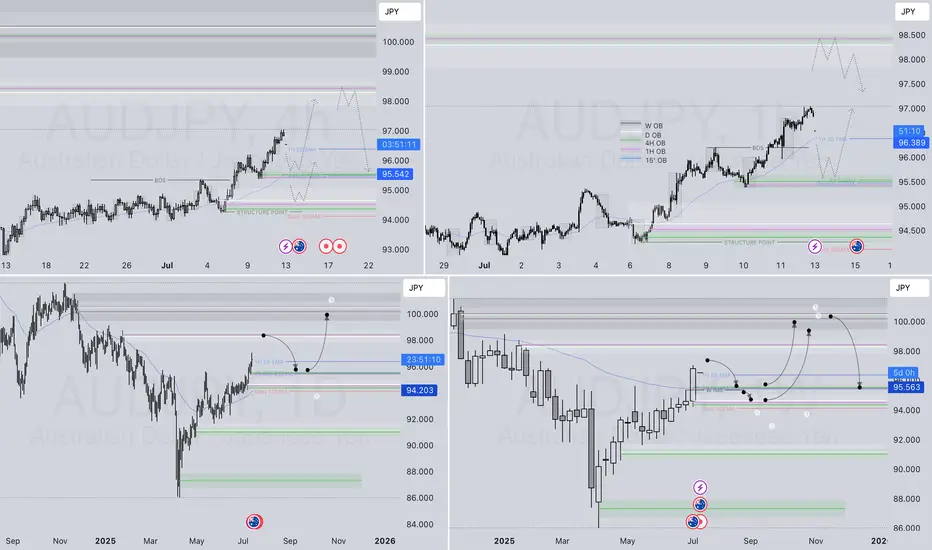
AUDJPY LONG & SHORT – WEEKLY FORECAST Q3 | W29 | Y25💼 AUDJPY LONG & SHORT – WEEKLY FORECAST
Q3 | W29 | Y25
📊 MARKET STRUCTURE SNAPSHOT
AUD JPY is currently reaching for a key higher time frame supply zone, looking for price action to show weakness at premium levels. Structure and momentum are now aligning for a short opportunity backed by multi-timeframe confluence.
🔍 Confluences to Watch 📝
✅ Daily Order Block (OB)
Looking for Strong reaction and early signs of distribution.
✅ 4H Order Block
Break of internal structure (iBoS) confirms a short-term bearish transition.
✅ 1H Order Block
📈 Risk Management Protocols
🔑 Core principles:
Max 1% risk per trade
Only execute at pre-identified levels
Use alerts, not emotion
Stick to your RR plan — minimum 1:2
🧠 You’re not paid for how many trades you take, you’re paid for how well you manage risk.
🧠 Weekly FRGNT Insight
"Trade what the market gives, not what your ego wants."
Stay mechanical. Stay focused. Let the probabilities work.
🏁 Final Thoughts from FRGNT
📌 The structure is clear.
The confluences are stacked.
Let execution follow discipline, not emotion.
Lingrid | GOLD Potential A-B-C Movement in ProgressOANDA:XAUUSD bounced strongly from the ascending trendline and reclaimed key structure near 3,275, signaling strength after rejecting the prior downward channel. Price has broken above the descending trendline and is now testing the 3,329 resistance zone with bullish momentum. If buyers maintain control above this breakout area, a push toward the 3,400 level becomes increasingly likely. The structure supports a continuation of the bullish leg unless price drops back under 3,275.
📉 Key Levels
Buy trigger: breakout and retest hold above 3,329.3
Buy zone: 3,300–3,329 (breakout + structure support)
Target: 3,400 first, extended toward 3,500
Invalidation: sharp drop below 3,275 negates bullish setup
💡 Risks
False breakout above 3,329 could invite short-term pullback
Rejection at 3,400 may lead to consolidation below resistance
Macro shocks (Fed, CPI) could reverse sentiment abruptly
If this idea resonates with you or you have your own opinion, traders, hit the comments. I’m excited to read your thoughts!

Lingrid | AUDCAD Shoring Opportunity at Monthly HighThe price perfectly fulfilled my last idea . FX:AUDCAD surged through the previous resistance and is now testing the 0.9045–0.9050 zone, where both a horizontal supply and red descending trendline converge. This area is a critical junction, and current price action shows early hesitation with a potential rounding top formation. A deeper pullback is possible if buyers fail to break above this resistance convincingly, with downside targets near prior breakout levels. The broader uptrend remains intact, but short-term correction risks are rising from this confluence zone.
📉 Key Levels
Sell trigger: confirmed rejection below 0.9050 with bearish engulfing or wick exhaustion
Sell zone: 0.9025–0.9050 (key resistance + trendline)
Target: 0.8960 initially, with deeper extension to 0.8822
Invalidation: clean hourly close above 0.9060 signals continuation of uptrend
💡 Risks
Minor support near 0.9000 could stall decline
Stronger-than-expected AUD data could lift price through resistance
False breakout wicks above 0.9050 might trap early sellers
If this idea resonates with you or you have your own opinion, traders, hit the comments. I’m excited to read your thoughts!

Lingrid | TONUSDT Accumulation-to-Distribution Phase ShiftThe price perfectly fulfilled my last idea . OKX:TONUSDT is forming a bullish continuation after an extended accumulation phase above the support level at 2.67. The recent breakout above the downward channel and the retest of the blue trendline suggest strength building for a move toward the 3.10 resistance. If buyers hold above the 2.87 pivot zone, the price may rally into the upper red trendline before facing significant pressure. Confirmation above local structure is key to unlocking the full upside toward the resistance zone.
📈 Key Levels
Buy zone: 2.70–2.87 (blue trendline + April & May lows)
Buy trigger: strong hourly hold above 2.87 with follow-through
Target: 3.10 first, with extension to 3.40
Invalidation: breakdown below 2.67 kills bullish momentum
💡 Risks
Failure to hold above 2.87 may trap late buyers
Resistance at 3.10 may cause sharp rejection
Wider market weakness could negate this breakout attempt
If this idea resonates with you or you have your own opinion, traders, hit the comments. I’m excited to read your thoughts!

Lingrid | XRPUSDT Potential Upside BreakoutBINANCE:XRPUSDT is currently retesting its upward trendline and support near 2.20 after failing to hold above the June high. The asset remains in a higher-low structure with repeated attempts to break resistance around 2.35, indicating bullish accumulation. If the price holds this trendline, an upside breakout toward the 2.45 target zone becomes more likely.
📈 Key Levels
Buy zone: 2.20–2.17 (trendline + horizontal support)
Sell trigger: break and close below 2.15
Target: 2.45 resistance, followed by potential toward 2.60
Buy trigger: bullish reversal above 2.20 confirming trendline defense
💡 Risks
Breakdown below 2.20 opens downside risk to 1.92 support
Flat momentum may lead to range-bound movement
Resistance at 2.45 could stall rallies without volume support
If this idea resonates with you or you have your own opinion, traders, hit the comments. I’m excited to read your thoughts!

GOLD XAUUSD TODAYGOLD XAUUSD TODAY is still bearish.
I have to ways
1. Entry now and SL above today's high.
2. If break high. wait for next SSM reversal

Lingrid | GOLD selling Opportunity at Resistance ZoneOANDA:XAUUSD recently rebounded from the support level near 3280 and pushed upward into the 3329 resistance zone. However, the price is struggling to break above both the red descending trendline and the horizontal supply zone, suggesting exhaustion of bullish momentum. A lower high formation and rejection from this confluence area signal a likely bearish continuation. If confirmed, price may slide toward 3305, with potential to revisit the 3280 support area.
📉 Key Levels
Sell trigger: rejection from 3330 with bearish confirmation
Sell zone: 3325–3330 (confluence of horizontal and diagonal resistance)
Target: 3305 first, extended to 3282.3
Invalidation: strong hourly close above 3330 breaks bearish structure
💡 Risks
False breakout traps near 3305 may reverse sentiment
Unexpected macro events (CPI, Fed comments) can shift short-term trend
Price bouncing at 3305 before full target reach might attract dip buyers
If this idea resonates with you or you have your own opinion, traders, hit the comments. I’m excited to read your thoughts!

Lingrid | GBPJPY possible Pullback From Psychological LevelThe price perfectly fulfilled my last idea . FX:GBPJPY is testing the upper boundary of the resistance zone near the psychological 200.000 mark after a strong bullish impulse. Price is showing early signs of rejection from the red trendline and horizontal resistance, suggesting potential for a corrective move. If confirmed, a drop toward the 197.600–197.000 region becomes likely, aligning with the lower bound of the rising channel. A break below this level could expose deeper downside toward the 195.5 support.
📉 Key Levels
Sell trigger: confirmed rejection from 200.000 with bearish engulfing
Sell zone: 200.50–200.00 (key resistance zone and trendline touch)
Target: 197.600
Invalidation: sustained close above 200.500 flips structure bullish
💡 Risks
Strong bullish continuation above 200.000 would invalidate short setup
Yen weakness from BOJ policy shifts could drive GBPJPY higher
Support at 197.600 may cause bounce and false breakout scenarios
If this idea resonates with you or you have your own opinion, traders, hit the comments. I’m excited to read your thoughts!

Lingrid | HYPEUSDT Trend Continuation Pattern ConfirmedThe price perfectly fulfilled my last idea . KUCOIN:HYPEUSDT has respected the higher low structure and bounced from the lower bound of its upward channel. After a corrective move and consolidation above the $38.80 level, the asset has formed a trend continuation pattern. With bullish structure still intact, price is gearing for a breakout toward the $48.00 resistance area. Continuation within the channel keeps the upside scenario valid.
📈 Key Levels
Buy zone: $38.80 support with bounce confirmation
Buy trigger: breakout above trend continuation structure
Target: $48.00 major resistance and top of ascending channel
Invalid level: sustained close below $38.80 risks invalidation of bullish bias
💡 Risks
Loss of channel support would trigger bearish momentum
Volatility near resistance levels may cause fakeouts
Macro shifts in sentiment could delay the breakout pattern
If this idea resonates with you or you have your own opinion, traders, hit the comments. I’m excited to read your thoughts!

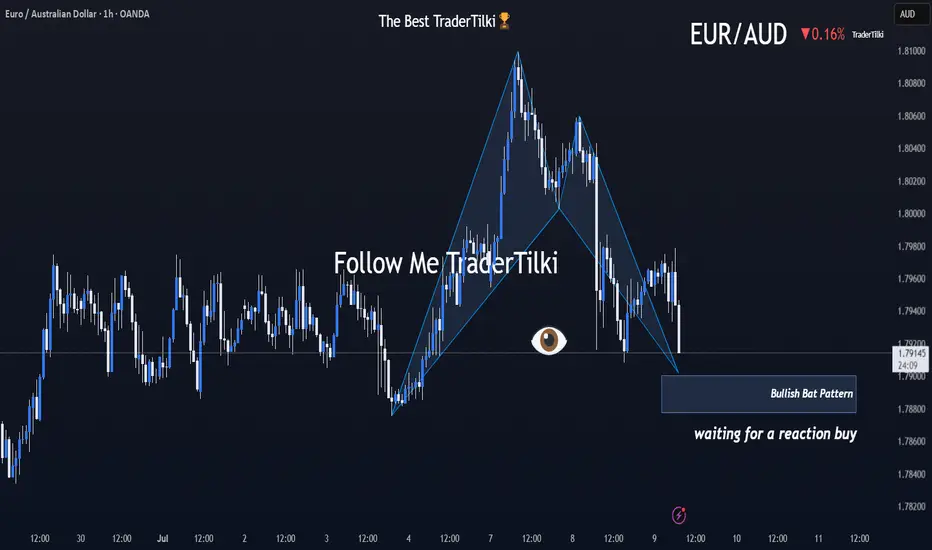
Brace Yourselves: EURAUD’s Harmonic Storm Is Coming!Good morning, Traders ☀️
I've identified a bullish harmonic Bat pattern on the EURAUD pair.
At this stage, I'm only anticipating a reactional buy from the marked zone.
I'll determine my target level after observing the market's response from that area.
📌 I’ll be sharing the target details under this post once the reaction unfolds.
Your likes and support are what keep me motivated to share these analyses consistently.
Huge thanks to everyone who shows love and appreciation! 🙏
Lingrid | BTCUSDT Short-Term Bullish Momentum The price perfectly fulfilled my last idea . BINANCE:BTCUSDT continues to trade within a strong upward channel, supported by consecutive higher highs and an ascending trendline. After breaking above the range near $108,200, price briefly peaked above $110,000 before pulling back to retest the mid-support zone. Current action shows a rebound from the upward trendline, suggesting buyers are preparing for another leg up toward $110,500 and possibly the $112,000 resistance zone.
📈 Key Levels
Buy zone: around 108,000 or below
Sell trigger: break below 107,000 with close under channel
Target: 110,500 – midpoint resistance, followed by 112,000
Buy trigger: bounce from trendline and reclaim of 109,000
💡 Risks
Weak rebound could signal range re-entry and stall upside
Break below the trendline may shift bias to 105,000
Multiple rejections near 110,000 could indicate topping pressure
If this idea resonates with you or you have your own opinion, traders, hit the comments. I’m excited to read your thoughts!

Lingrid | GOLD Major Support Level ViolatedOANDA:XAUUSD has formed a lower high beneath the key resistance at 3,310, showing fading bullish momentum after a breakout failure. Price is trading below the upward trendline and moving toward the 3,260 support zone with a corrective structure. The rejection from the resistance block and breakdown of a key level suggests continued bearish pressure.
📉 Key Levels
Sell trigger: rejection from 3,300–3,330 resistance block
Target: 3,260 key support, followed by 3,240 lower zone
Invalid level: breakout and close above 3,320 regains bullish bias
Resistance zone: 3,310–3,330 acting as a ceiling for upside attempts
⚠️ Risks
Reclaiming 3,310 would shift the bias back to neutral/bullish
Sideways range between 3,260–3,320 could cause fakeouts
Volatility spikes from macroeconomic events may trigger stop hunts
If this idea resonates with you or you have your own opinion, traders, hit the comments. I’m excited to read your thoughts!

Lingrid | GBPNZD Trend Continuation OpportunityThe price perfectly fulfilled my last idea . FX:GBPNZD is rebounding strongly after forming a Higher Low just above the key support at 2.2587, sustaining the bullish structure. The recent impulse leg broke out of the previous downward channel, and price is now stabilizing for a potential rally toward the 2.2900 resistance. If momentum sustains above the trendline retest area, we may see another wave toward the top of the resistance zone.
📈 Key Levels
Buy zone: 2.2580–2.2660 near support and trendline confluence
Buy trigger: breakout continuation above 2.2700 with bullish structure
Target: 2.2900 resistance zone, top of the current wave
Sell invalidation: drop below 2.2370 breaks the bullish market structure
💡 Risks
Failure to hold 2.2580 support could push price back toward 2.2370
Resistance around 2.2700–2.2750 may delay breakout if volume weakens
Broader rangebound conditions may trap early long positions
If this idea resonates with you or you have your own opinion, traders, hit the comments. I’m excited to read your thoughts!

Lingrid | AVAXUSDT Bullish Surge Potential After BreakoutBINANCE:AVAXUSDT is attempting a breakout from the long-standing downward trendline after rebounding from the 17.62 support area. Price is consolidating just beneath the descending resistance, hinting at an imminent breakout toward the 21.30 target level. If bulls maintain pressure above the breakout zone, this move could invalidate the previous bearish momentum and initiate a mid-term bullish reversal.
📈 Key Levels
Buy zone: 17.60–18.00 (above rebound base and trendline test)
Buy trigger: confirmed breakout above 18.50 with strong volume
Target: 21.30 intermediate resistance zone
Sell invalidation: break below 17.00 may reintroduce selling pressure
💡 Risks
Failed breakout may trap buyers and push price back below 17.60
Broader bearish structure still intact unless price clears 21.30
Thin momentum could result in choppy price action before breakout
If this idea resonates with you or you have your own opinion, traders, hit the comments. I’m excited to read your thoughts!

No Bullish Confirmation – Targeting 3250 on XAU/USDIn yesterday’s analysis, I mentioned that due to Monday’s daily Pin Bar, I closed my short trade on Gold around break-even and decided to wait for more confirmation.
Unfortunately, that wasn't the best decision. The price failed to break above resistance for a bullish continuation and instead dropped sharply, closing the day exactly at the 3300 figure. At the time of writing, Gold is trading even lower at 3293, after briefly rebounding from the 3285 support zone—a level I’ve highlighted in the past.
Moving forward, after the failed bullish continuation and yesterday’s bearish move, it’s clear that bears are back in control. A drop toward the 3250 zone is now on the table.
Conclusion: I’m looking to sell rallies, with my invalidation zone set above 3340, aiming for a good risk-to-reward setup.
Disclosure: I am part of TradeNation's Influencer program and receive a monthly fee for using their TradingView charts in my analyses and educational articles.

Lingrid | EURUSD Bullish Trend ContinuesFX:EURUSD is holding a bullish structure inside an upward channel after bouncing from the 1.1670 demand zone. The current retracement appears corrective, and buyers may step in again near the confluence of the trendline and horizontal support. If confirmed, the price is expected to push toward the 1.1885 resistance and the upper channel target at 1.1900.
📈 Key Levels
Buy zone: 1.1650–1.1680 (trendline + key support)
Sell trigger: break below 1.1600
Target: 1.1885 – 1.1900 zone
Buy trigger: bullish reversal candle near 1.1700
💡 Risks
Failure to hold trendline support could lead to deeper retracement
1.1885 may cap upside if momentum fades
Bearish divergence could emerge if price surges too fast
If this idea resonates with you or you have your own opinion, traders, hit the comments. I’m excited to read your thoughts!

Lingrid | USDJPY Pullback From the Key Resistance ZoneThe price perfectly fulfilled my previous idea . FX:USDJPY is moving inside an upward channel after reclaiming support near 145.25 and breaking out from its previous range. The pair printed a higher low and is now approaching resistance around 146.78, testing the upper boundary of the ascending channel. If it fails to break through the red resistance trendline, a retracement toward the 145.25–145.00 support is likely.
📈 Key Levels
Buy zone: 146.78 - 147.00
Sell trigger: rejection from 146.78 and lower high below resistance
Target: 145.25
Buy trigger: bullish breakout above 147.00 with momentum confirmation
💡 Risks
Price rejection near 146.78 may cause a sharp pullback
A surge above 147.00 breaks trendline structure
Market reaction to macro data could distort short-term pattern
If this idea resonates with you or you have your own opinion, traders, hit the comments. I’m excited to read your thoughts!

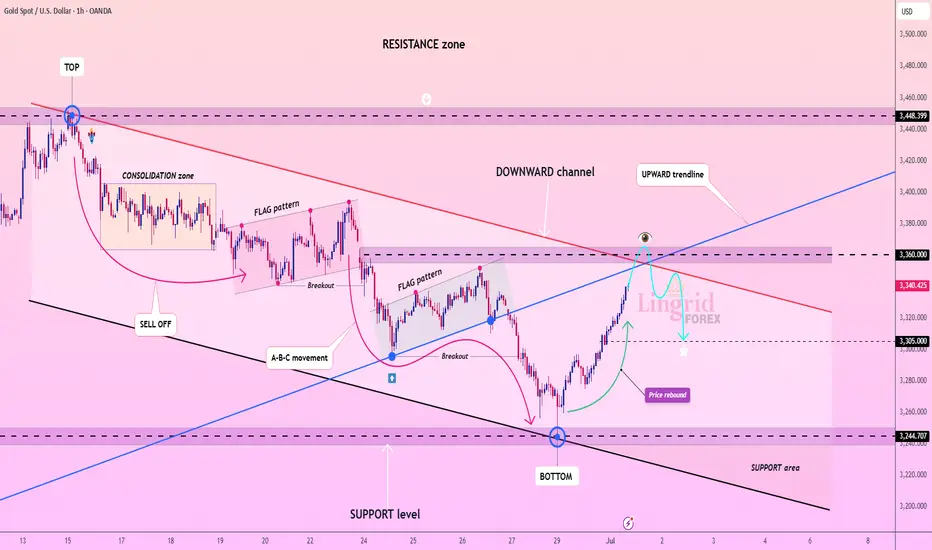
Lingrid | GOLD Shorting Opportunity at Confluence ResistanceOANDA:XAUUSD is approaching the key resistance near 3360 after rebounding from the 3245 support level and breaking out of the downward channel. Price is now testing the upward trendline from below, intersecting with the red descending trendline and horizontal resistance. If this confluence zone rejects the rally, a return toward 3305 or lower is likely, forming a potential bearish retest.
📉 Key Levels
Sell zone: 3350–3360
Buy trigger: breakout above 3360 with close above 3375
Target: 3305
Sell trigger: rejection from 3360 and break of 3340
⚠️ Risks
Break and retest of 3360 may invalidate short setup
Volatility around red trendline could trigger fakeouts
Demand near 3305 may cause sharp bounces if sellers stall
If this idea resonates with you or you have your own opinion, traders, hit the comments. I’m excited to read your thoughts!
Lingrid | EURAUD Trend Continuation Pattern FX:EURAUD is maintaining bullish momentum within a broad upward channel after bouncing from the 1.7900 support zone and forming a triangle continuation pattern. Price is coiling just below the 1.8000 handle and the red resistance boundary of the channel. A confirmed breakout above 1.8000 could open the path toward the 1.8100 target area, extending the broader bullish structure.
📈 Key Levels
Buy zone: 1.7880–1.7900
Sell trigger: breakdown below 1.7880
Target: 1.8100
Buy trigger: breakout and retest of 1.8000–1.8020 zone
💡 Risks
Rejection from 1.8000 resistance could trigger a pullback
Break below the blue trendline may invalidate bullish setup
Low momentum breakout may stall below 1.8050
If this idea resonates with you or you have your own opinion, traders, hit the comments. I’m excited to read your thoughts!

Lingrid | GOLD Breakout of Trend Continuation PatternThe price perfectly fulfilled my last idea . FX:XAUUSD is forming a bullish base just above the upward trendline and key support near 3,310, showing signs of price compression within a flag continuation pattern. After the recent pullback, the market is holding structure and coiling for a potential breakout toward the 3,365 resistance. If price rebounds from the confluence zone, it would signal bullish continuation with upside momentum building.
📈 Key Levels
Buy zone: 3,305–3,310 support confluence
Buy trigger: break and close above 3,340 minor structure
Target: 3,365–3,370 resistance zone
Sell invalidation: break below 3,290
💡 Risks
Breakdown below the flag may turn structure bearish
Weak volume on breakout could result in fakeout
Resistance at 3,365 may reject price on first test
If this idea resonates with you or you have your own opinion, traders, hit the comments. I’m excited to read your thoughts!

Gold Reverses with a Pin Bar – Is the Drop Over?📈 What happened yesterday on Gold (XAU/USD)?
Gold had a tricky session – during the early hours it dipped just below 3300, testing support. But by the New York session, bulls stepped in strongly, pushing price back up and closing near the daily highs. The result? A strong daily Pin Bar with a long tail, signaling possible bullish reversal.
________________________________________
❓ Is the drop over, or will the market fake out again?
That's the big question now. Yesterday’s close definitely leans bullish, but we need to see confirmation.
________________________________________
📌 Why a continuation to the upside is possible:
• Price rejected sub-3300 levels pretty strongly.
• A daily Pin Bar formed, signaling buyer strength.
• A break above yesterday’s high would confirm bullish intent.
• 3390–3400 is the next key resistance zone on the radar.
________________________________________
🧠 My trading plan:
I closed my short near break-even – no need to fight the price action. Now I'm patiently waiting for a clean break above yesterday’s high to enter long trades, aiming for the 3390–3400 resistance area.
Disclosure: I am part of TradeNation's Influencer program and receive a monthly fee for using their TradingView charts in my analyses and educational articles.

GOLD XAUUSD TodayThree posible scenarious
1.Now GOLD is bulish but possible is deep correct
2.UNTIL break my SSM Structure on H4 possible SSM reversal
3. If break SSM area go to new high
