PANW Palo Alto Networks Options Ahead of EarningsIf you haven`t bought PANW here:
Then Analyzing the options chain of PANW Palo Alto Networks prior to the earnings report this week,
I would consider purchasing the 190usd strike price Calls with
an expiration date of 2023-6-16,
for a premium of approximately $8.75
If these options prove to be profitable prior to the earnings release, I would sell at least half of them.
Looking forward to read your opinion about it.
Signalsgroup

FTCH Farfetch Limited Options Ahead of EarningsAnalyzing the options chain of FTCH Farfetch Limited prior to the earnings report this week,
I would consider purchasing the 5usd strike price Puts with
an expiration date of 2024-1-19,
for a premium of approximately $0.80
If these options prove to be profitable prior to the earnings release, I would sell at least half of them.
Looking forward to read your opinion about it.

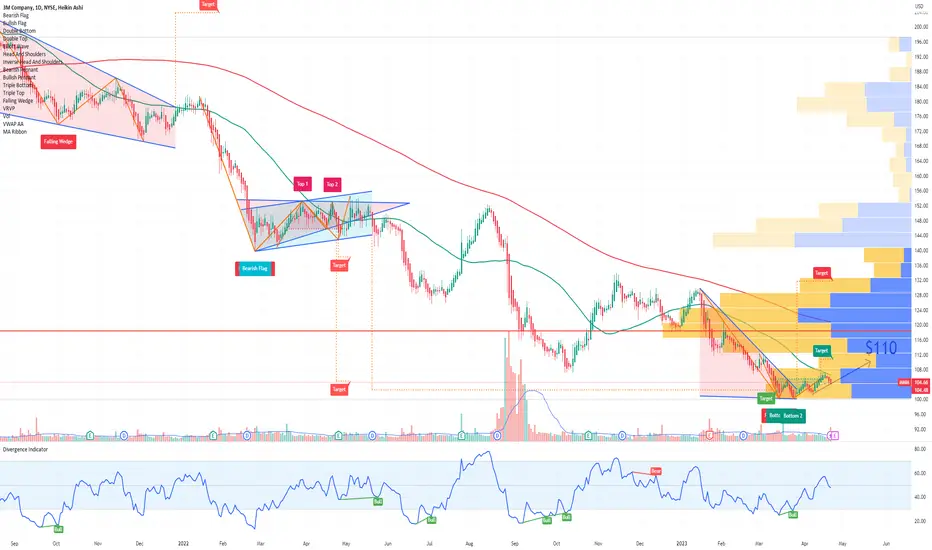
MMM 3M Company Options Ahead of EarningsIf you haven`t bought those calls here:
Then analyzing the options chain of MMM 3M Company prior to the earnings report this week,
I would consider purchasing the 110usd strike price Calls with
an expiration date of 2023-9-15
for a premium of approximately $4.45.
If these options prove to be profitable prior to the earnings release, I would sell at least half of them.
I am interested to hear your thoughts on this strategy.
GS Goldman Sachs Options Ahead of EarningsAfter the last Price Target was reached:
Now analyzing the options chain of GS Goldman Sachs prior to the earnings report this week, I would consider purchasing
Calls with a 350usd strike price and an expiration date of 2023-5-19, for a premium of approximately $5.75.
If these options prove to be profitable prior to the earnings release, I would sell at least half of them.
I am interested to hear your thoughts on this strategy.

AGX Argan Options Ahead Of EarningsLooking at the AGX Argan options chain ahead of earnings , I would buy the HKEX:40 strike price Calls with
2023-10-20 expiration date for about
$2.90 premium.
If the options turn out to be profitable Before the earnings release, i would sell at least 50%.
Looking forward to read your opinion about it.

VRAY ViewRay Oversold | Calls to BuyVRAY ViewRay went down due to market conditions on no particular news.
In fact, in a report released on Feb 28, Oppenheimer reiterated a Buy rating on VRAY Viewray, with a price target of $8.00.
The stock is now trading at $3.36, being extremely oversold, with the RSI at $16.92.
Looking at the options chain, I would buy the $4 strike price Calls with
2023-4-21 expiration date for about
$0.10 premium.
Looking forward to read your opinion about it.

WDFC WD-40 Company Options Ahead of EarningsLooking at the WDFC WD-40 Company options chain ahead of earnings , I would buy the $160 strike price Puts with
2023-1-20 expiration date for about
$6.65 premium.
If the options turn out to be profitable Before the earnings release, i would sell at least 50%.
Looking forward to read your opinion about it.

CHWY Chewy Options Ahead Of EarningsIf you haven`t bought the all time low:
Then you should know that looking at the CHWY Chewy options chain ahead of earnings , i would buy the $43.5 strike price Puts with
2022-12-9 expiration date for about
$2.46 premium.
If the options turn out to be profitable Before the earnings release, i would sell at least 50%.
Looking forward to read your opinion about it.

CRWD CrowdStrike Holdings Options Ahead Of EarningsLooking at the CRWD CrowdStrike Holdings options chain ahead of earnings , i would buy the $135 strike price Puts with
2022-12-16 expiration date for about
$6.65 premium.
If the options turn out to be profitable Before the earnings release, i would sell at least 50%.
Looking forward to read your opinion about it.

WTI CRUDE OIL US OIL DROP MORE ?Hey traders! In the US OIL Market structure we see after drop of oil prices on 14 sep from 90$ per barrell price is now holding its support area which is 84$.
What we see in market structure?
Price breakout its market structure in 2h timeframe and show the selling pressure at 86$ which is very stong support for usoil now price again come to this level now as a resistance and respect this level/ also bearish flag formation also indicate that we see selling continuation in the price of us crude oil on monday market opening. Price is near its support and test multiple time and it show the weakness of support we see on monday and coming week/ this week also fed rates are coming so banks and institution smart money also looking for fresh data coming from US/
TECHNICALLY US OIL is showing selling pressure after the breakout of bear flag we go for the short position sell in wti us oil for the target of next pivot point support 82.40 level and next the low of 08 sep 81.36 level which is strong support we see in oil price. Our stop loss is in the monday high or the previous 2h candle high or above the 2h previous candle.

JMIA Jumia Technologies Options Ahead Of EarningsLooking at the MMAT Meta Materials options chain, i would buy the $8 strike price calls with
2022-8-26 expiration date for about
$0.48 premium.
Looking forward to read your opinion about it.

CHK Chesapeake Energy Options Ahead Of EarningsLooking at the CHK Chesapeake Energy options chain, i would buy the $105 calls with
2023-1-20 expiration date for about
$9.00 premium.
Looking forward to read your opinion about it.

VRM gap to fillVroom, Inc. (VRM) is getting closer and closer to a short squeeze in my opinion.
The gap to fill is $4.58 - $5.15, you know that they usually do!
This is also my price target for VRM this year, $4.60.
Looking forward to read your opinion about it.

ZEC US leaked bill to eliminate anonymous crypto projectsA leaked copy of US draft bill proposes to eliminate anonymous crypto projects.
DAOs, DeFi and exchanges will be required to legally register in the US!
My entry area for ZEC is $69.
Looking forward to read your opinion about it.

Meta Platforms, Inc. (FB) closer to our Buy areaIf you haven`t shorted FB at $340:
Then you should know that after the SNAP guidance warning, Facebook could face the same problem!
My first price target is $162.
Looking forward to read your opinion about it.

COST Costco the next TGT?TGT is down 25% after the earnings today.
Could COST be next?
if we look at the P/E ratio, TGT has a P/E of 15.58, while COST much higher, 39.87.
I wouldn`t be surprised to see a retracement of COST at the pre-pandemic level of $387.
Looking forward to read your opinion about it.

SHOP Earnings Miss | Slowest Revenue Growth in Seven YearsIf you haven`t sold SHOP at $945:
Then you should know that Shopify said adjusted earnings for Q1 came in at 20 cents per share per share VS a profit of $2.01 per share over the same period last year and VS a consensus forecast of 77 cents per share.
Gross merchandise volumes rose 16% to $43.2 billion VS Street forecasts of a $45.4 billion.
The stock is closer to our $350-400 buy range now.
Looking forward to read your opinion about it.

ETSY Disappointing ForecastQ1 earnings:
Revenue $579.3Mil vs $575.6Mil estimate
ADJ. EPS: $0.60 in line with 0.60 expected
Forecast Q2 revenue $540 - 590Mil vs $628Mil estimate
EDJ EBITDA 25% vs 26.5% estimate
My price target is $77.
Looking forward to read your opinion about it.

UBER Strong Support AreaIf you haven`t sold UBER on this bearish call:
Then you should know that even if they released an extremely bullish guidance for Q2, higher than the estimates, it could face the same problems as LYFT, spend more on driver incentives, and they won`t deliver the expected results.
My price target is the $26.50 support.
Looking forward to read your opinion about it.

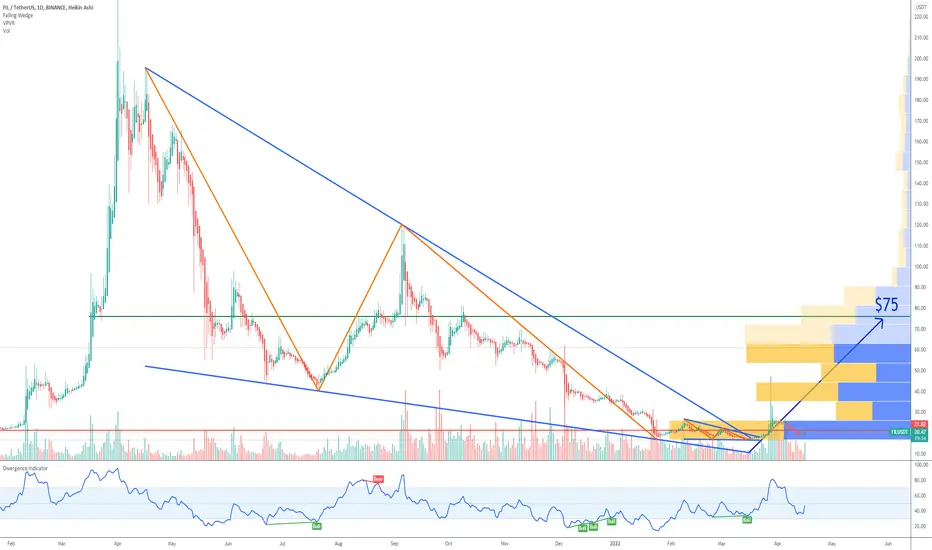
FIL massive falling wedge chart patternA strong breakout from the massive falling wedge could lead FIL Filecoin to the $75 resistance.
Looking forward to read your opinion about it.
APE price forecast APE bounced from the strong support of 11.20 and is now heading to the $13.20 resistance.
Looking forward to read your opinion about APE.

OCEAN / USDT — Perfect Signal for Crypto Coin ✅❇️Greetings to you all , dear colleagues and beloved readers , good morning !
—————————
Our team posted this signal tonight .
It was gorgeous , but it probably doesn't end there , the coin is held at the same level and getting ready to move on .
We made purchases at $ 0.90 . Now at the time of this writing , the price is hovering around $ 0.93.
Now let's all watch her together ; )
Be sure to add the idea to your watchlist ...
We ask you not to leave just like that, but to communicate with us in the comments and support our work.
Yes , it’s creativity , because for us it’s not work , but art ; )
Visit other ideas here @Professional_Crypto_Analytics
—————————
This idea is not a financial recommendation and is educational in nature ! ♠️♥️♣️♦️

DOGEUSDT Technical Analysis
Very clear downtrend on the 1 hour time frame. After the price broke below the Support and got out of the Triangle with a long big red candle it's expected to go lower to 0.25 and even lower to 0.225. there might be a pullback which might happen at the Resistance line of the triangle. but most likely it will go lower.
Have a Profitable Day
If you find this helpful and want more FREE forecasts in TradingView
Please show your support back,
Hit the 👍 LIKE button,
Drop some feedback below in the comment!
❤️ Your Support is really appreciated!❤️
