Lingrid | BTCUSDT Consolidation DIP Buying OpportunityBINANCE:BTCUSDT completed an expanding triangle breakout and reached a higher high within the resistance zone. After the bullish run, price pulled back toward the $100,250 level and may enter a brief consolidation phase above the upward channel’s midline. If support holds, bulls may aim for $106,850 to test the upper boundary of the channel.
📌 Key Levels
Support: $100,250
Midline Guide: $102,000–$103,000
Target: $106,850
⚠️ Risks
Rejection from the resistance band may trap buyers
Falling below $100K could shift bias short-term
Low volatility may delay breakout attempts
Traders, if you liked this idea or if you have your own opinion about it, write in the comments. I will be glad 👩💻
Signalsprovider

Lingrid | SHIBUSDT long OPPORTUNITY after PULLBACKThe price has perfectly fulfilled my previous forecast . BINANCE:SHIBUSDT saw a strong rally with an A-B-C structure and triangle breakout, leading to a fake breakout above the resistance zone. After the rejection at the red resistance line, the price pulled back to retest the ascending black trendline, which now aligns with the 0.00001382 level. A bounce here could push price back toward the 0.00001600 target if support holds.
📌 Key Levels
Support: 0.00001382
Intermediate Target: 0.00001600
Resistance: 0.00001727
⚠️ Risks
Breakdown below the trendline could retest 0.00001230
The blue downward trendline may act as short-term resistance
Weak volume could invalidate the breakout attempt
Traders, if you liked this idea or if you have your own opinion about it, write in the comments. I will be glad 👩💻

Lingrid | GOLD Weekly Low False Breakout. Possible LongThe price perfectly fulfilled my previous idea . OANDA:XAUUSD after a steep selloff from the top, OANDA:XAUUSD formed a new lower low just beneath the black support trendline, potentially faking out the weekly low. A bounce has begun, and if momentum holds, the price could reclaim the blue downtrend line, eyeing the $3,290 zone as a bullish target.
📌 Key Levels
Support: $3,111.81
Mid-range: $3,171.05
Resistance Target: $3,290.00
⚠️ Risks
Failure to hold above $3,171.05 may signal trend weakness
Blue trendline may act as resistance
Possible fakeout below support could trap bulls
Traders, if you liked this idea or if you have your own opinion about it, write in the comments. I will be glad 👩💻

Lingrid | GBPUSD retest the RESISTANCE zone and FALLFX:GBPUSD price is approaching the confluence of the red resistance trendline and the $1.334 level after an extended climb along the upward trendline. Despite short-term bullish momentum, this zone has acted as a strong barrier in the past. A rejection here could signal the start of a local correction toward $1.325 or lower.
📌 Key Levels
Support: $1.32540
Resistance: $1.33413
Reversal Zone: Red trendline near $1.334
⚠️ Risks
Breakout above $1.334 could invalidate the reversal setup
Momentum remains bullish above the blue trendline
Failure to reject the red trendline may shift bias to breakout continuation
Traders, if you liked this idea or if you have your own opinion about it, write in the comments. I will be glad 👩💻

Lingrid | TONUSDT buying OPPORTUNITY from SUPPORT zoneOKX:TONUSDT found support just above the $3.00 psychological level after a double top formation triggered a sharp correction. Price is currently hovering near the upward trendline and may enter a consolidation phase before attempting a rebound. A successful break above the descending trendline could open the way toward $3.30.
📌 Key Levels
Support: $3.00
Resistance: $3.30
Potential Breakout Trigger: Descending trendline above $3.15
⚠️ Risks
Failure to hold $3.00 could expose the $2.78 support
Bearish continuation if the descending trendline resists breakout
Market indecision near psychological levels may lead to volatility
Traders, if you liked this idea or if you have your own opinion about it, write in the comments. I will be glad 👩💻

SUI/USDT: Key Support Test Within Ascending ChannelThe SUI/USDT market recently retested the $4.00 resistance after an extended period of ranging and has since slipped toward the lower boundary of its ascending channel. The price is now approaching the $3.50 support zone, a critical area that may spark a bullish rebound and continuation of the current structure.
The trend remains defined by higher lows, with price action contained within the upward-sloping channel. A strong reaction near the blue trendline support could pave the way for a move toward the $4.50 resistance

2000+ Pips Down This Week – Can Gold Finally Breathe?Yesterday, Gold continued its aggressive drop and, as expected, broke below the key 3200 level, reaching the 3165 support zone and even exceeding it — trading now around 3136.
The move that started on Monday is extremely sharp — more than 2,000 pips lost in just a few days — and follows the same pattern we've seen recently: rapid, volatile swings.
________________________________________
❓ Is this the bottom, or will the fall continue?
At this stage, calling a bottom is risky. There is no clear sign of exhaustion on higher timeframes, and Gold remains vulnerable.
________________________________________
📌 What I’m watching now:
• Lower timeframes (M30–H1) for signs of a temporary reversal
• Potential bullish divergence
• Watching for spikes down followed by sharp reversals to the upside as potential long entries — aiming to catch a short-term correction within the broader downtrend
________________________________________
📊 Trading Plan:
For now, I will wait for a possible upside correction, but I won’t rush in. If signs of a bottom emerge, I might catch a short-term bounce, with tight risk.
Disclosure: I am part of Trade Nation's Influencer program and receive a monthly fee for using their TradingView charts in my analyses and educational articles.

Lingrid | GOLD ABC Complete - REVERSAL SetupThe price perfectly fulfilled my previous idea . OANDA:XAUUSD touched the lower boundary of its descending channel near $3,108 and showed signs of a short-term bounce. The A-B-C correction appears complete, and buyers may attempt a rebound toward the $3,220 level. However, overall market structure remains bearish unless a breakout above the upper trendline confirms reversal.
📌 Key Levels
Support: $3,108
Resistance: $3,220
Structure: Descending channel with lower highs and lows
⚠️ Risks
Rejection near $3,220 could reinforce bearish control
Failure to hold $3,108 opens room toward deeper support
Bearish macro pressure from DXY or rate expectations could limit upside potential
Traders, if you liked this idea or if you have your own opinion about it, write in the comments. I will be glad 👩💻

Lingrid | GBPNZD Primed For BULLISH Move. LongFX:GBPNZD bounced off the upward trendline and cleared the $2.24561 resistance, reclaiming bullish momentum after a pullback and fake breakout. With a breakout retest underway, bulls are eyeing a move toward the $2.27480 resistance zone. Higher lows confirm the channel remains intact.
📌 Key Levels
Support: 2.24561
Resistance: 2.27480
Structure: Rising trendline with breakout and retest dynamics
⚠️ Risks
Failure to hold $2.24561 may trigger deeper correction
Rejection near resistance without volume may signal a bull trap
Any sharp breakdown of the upward trendline would shift the outlook to neutral or bearish
Traders, if you liked this idea or if you have your own opinion about it, write in the comments. I will be glad 👩💻

Lingrid | SUIUSDT potenatil PULBACK Trade from SUPPORTThe price perfectly fulfills my last idea . BINANCE:SUIUSDT retested the $4.00 top after an extended range and has now slipped toward the lower edge of its ascending channel. Price is eyeing the $3.50 support zone for a possible bounce to resume bullish structure. The reaction near the blue trendline will be key to unlocking upside toward $4.50.
📌 Key Levels
Support level: 3.5000
Resistance: 4.0000 and 4.5000
Trend structure: Higher lows inside an ascending channel
⚠️ Risks
Failure to hold $3.50 could trigger a deeper pullback
Rejection at the $4.00 mark again would signal waning momentum
Breakdown below the upward trendline would invalidate the current bullish bias
Traders, if you liked this idea or if you have your own opinion about it, write in the comments. I will be glad 👩💻

Lingrid | GOLD Sideways PRICE ACTION after DeclineOANDA:XAUUSD printed a clear breakout below the key upward trendline, invalidating its previous bullish range structure. This opens the door for a potential correction toward the $3,165 support zone as bearish pressure builds. Reclaiming $3,285 would be required to reintroduce bullish momentum.
📌 Key Levels
Support level: 3,165
Invalidation level: Above 3,285
Target area: 3,165 and possibly 2,967.73
⚠️ Risks
A recovery above 3,285 may trigger a fakeout reversal
Watch for bounce signals at the lower boundary of the channel
Traders, if you liked this idea or if you have your own opinion about it, write in the comments. I will be glad 👩💻

Lingrid | BNBUSDT Bullish Pause Before Potentail RallyThe price perfectly fulfilled my previous idea . BINANCE:BNBUSDT recently broke out of a prolonged downward channel and surged into the resistance zone, briefly tapping the 700 level before retracing. The price action now consolidates above the swap zone, suggesting a potential retest before continuation. This A-B-C corrective move could provide a launchpad for bulls.
📌 Key Levels
Support zone: 637
Invalidation level: Below 637
Target area: 700
⚠️ Risks
A failure to hold the swap zone may lead to a drop toward the 600–580 range
Bearish divergence or sharp rejection from 700 may limit upside continuation
Traders, if you liked this idea or if you have your own opinion about it, write in the comments. I will be glad 👩💻

Lingrid | GOLD Accelerating BEARISH Momentum in the MARKETOANDA:XAUUSD recently faced rejection at a lower high within the resistance zone and is now trading beneath a firm downward trendline. After a failed attempt to hold above $3,264, price has dropped sharply, signaling continuation of the bearish momentum that began after the breakout failed to sustain. The downtrend remains intact with sellers eyeing deeper support unless bulls reclaim $3,264 with momentum.
📌 Key Levels
Support zone: $3,150
Breakout target: $3,150
Invalidation level: $3,264 (local resistance / trendline retest)
⚠️ Risks
Short-term rebounds may test the trendline before continuation
False breakdown risk exists near $3,150 without volume support
Unexpected bullish reversal above $3,264 would invalidate bearish bias
Traders, if you liked this idea or if you have your own opinion about it, write in the comments. I will be glad 👩💻

Lingrid | GBPAUD Pre-Extension Coiling FormationThe price perfectly fulfilled my previous idea . FX:GBPAUD remains confined within a range below the descending trendline, where lower highs have formed consistent resistance. Price is currently rejecting the upper boundary and moving toward the trend support, aligning with a potential bearish continuation setup. If momentum persists, price could revisit the support zone and possibly extend toward the target area. Sellers may remain in control as long as price respects the descending structure and holds below key resistance.
📌 Key Levels
Resistance zone: 2.0634
Target level: 2.0350
Invalidation level: Above 2.0881
⚠️ Risks
Failed breakdown attempts from the range may cause price to retest resistance
Fakeouts above 2.0634 could trap sellers
Bullish reversal from trend support could invalidate the bearish setup
Traders, if you liked this idea or if you have your own opinion about it, write in the comments. I will be glad 👩💻

Lingrid | AVAXUSDT Bullish Momentum ContinuationThe price perfectly fulfilled my previous idea . BINANCE:AVAXUSDT has bounced from its higher low near trend support and is now pulling back after reaching a local high. The structure remains bullish overall, with price still trading inside the upward channel and holding above the $22.84 swap zone. As long as this support holds, a continuation toward the $28 resistance area remains likely. As long as the structure maintains higher lows and stays within the upward channel, bulls remain in control targeting higher levels.
📌 Key Levels
Support zone: $22.84
Breakout target: $28.00
Invalidation level: Below $22.00 (channel break and support failure)
⚠️ Risks
Deeper pullbacks may revisit the support and test demand
Failure to hold $22.84 opens potential drop toward $19.25
Resistance at $28 may trigger sharp rejections on first touch
Traders, if you liked this idea or if you have your own opinion about it, write in the comments. I will be glad 👩💻

Lingrid | BTCUSDT potential PATHWAY to New All-Time HIGHBINANCE:BTCUSDT is testing the upper boundary of its breakout structure after reclaiming the $100,000 level and pushing above the blue upward trendline. The broader uptrend remains intact as price forms a higher low within the ascending channel and sets sights on fresh highs. Price action remains bullish with room for upside continuation if BTC holds above the breakout zone.
📌 Key Levels
Support zone: $98,000 - $100,000 (prior breakout and trendline retest)
Breakout target: $118,760 (resistance area top)
Invalidation level: Below $98,000 (break of structure + channel midline)
⚠️ Risks
Strong resistance lies just above ATH; could lead to rejection
Consolidation under resistance may delay breakout
Weekly close below $100,000 could shift momentum short-term
Traders, if you liked this idea or if you have your own opinion about it, write in the comments. I will be glad 👩💻

DXY Ready to Pop – Watch That 100 Break!After breaking below the key psychological level at 100 and making a low just under 98, the Dollar Index ( TVC:DXY ) has entered a consolidation phase.
Over the past three weeks, price has developed an inverted head and shoulders pattern, with the neckline perfectly aligning with the horizontal resistance at 100 — a strong zone of confluence from both a technical and psychological standpoint.
Despite the current hesitation under resistance, the structure suggests bullish potential. I believe we are approaching a breakout above 100, and once that happens, an acceleration to the upside is likely to follow.
🎯 Target: 102
🔒 Invalidation: A break below 98 would cancel the bullish bias.
As long as the price stays above the 98 area, I remain bullish and expect the dollar to strengthen.
🚀 The breakout hasn’t happened yet — but the pressure is building.

Lingrid | GOLD Weekly MARKET Analysis: CONSOLIDATION PhaseOANDA:XAUUSD has made a positive move but faced resistance at $3,430, with strong support established at $3,250. The market is likely to trade sideways or experience a deeper correction in the near term. A major resistance barrier appears to be forming overhead, making further upside difficult without significant catalysts.
These temporary pullbacks may prove beneficial within what appears to be a longer-term uptrend. It is natural for markets to move sideways and form consolidation patterns after the bullish momentum we've witnessed since the beginning of this year. Therefore, sideways consolidation currently represents the healthiest market reaction.
Last year, we observed similar price action where the market made a bullish move from February through April before consolidating for two months. Current price action suggests we may see consolidation in the form of a triangle pattern before a major catalyst fuels the next market move. Overall, I expect the market to continue moving sideways within the April trading range, with the possibility of a deeper correction.
Traders, if you liked this idea or if you have your own opinion about it, write in the comments. I will be glad 👩💻
Bitcoin Potential Continuation To The UpsidesHey Traders, in today's trading session we are monitoring BTCUSDT for a buying opportunity around 100,000 zone, Bitcoin is trading in an uptrend and currently is in a correction phase in which it is approaching the trend at 100,000 support and resistance area.
Trade safe, Joe.

Lingrid | HBARUSDT continuation From the SUPPORT zoneBINANCE:HBARUSDT continues to climb within its upward channel, recently bouncing from the confluence of an upward trendline and prior breakout zone. The structure suggests a bullish continuation pattern is forming, targeting the channel's upper boundary. As long as the price holds above 0.199, bulls retain control with sights on the 0.23 resistance zone.
📌 Key Levels
Support zone: 0.19922 (trendline + previous structure)
Breakout target: 0.23000 (upper channel resistance)
Invalidation level: Below 0.19900 (would break bullish trendline structure)
⚠️ Risks
Breakdown below the blue trendline would weaken momentum
Price may consolidate if buying volume fades
Lower timeframe pullbacks can delay breakout
Traders, if you liked this idea or if you have your own opinion about it, write in the comments. I will be glad 👩💻

Lingrid | GOLD complex PULLBACK from RESISTANCE zoneOANDA:XAUUSD is maintaining its structure above a key upward trendline after a higher low formed near support. The market remains technically bullish while staying above this level, with the recent pullback looking corrective rather than impulsive. Buyers may step in for a renewed attempt toward the upper resistance area. Watch for a bullish breakout continuation above 3,326 toward 3,380 if buyers hold the current support line.
📌 Key Levels
Support zone: 3,305.583 (upward trendline and structure base)
Breakout target: 3,380.000 (resistance ceiling of range)
Invalidation level: Below 3,304.696 (would negate bullish setup)
⚠️ Risks
Breakdown below trendline could trigger deeper correction
Price consolidation may reduce momentum short term
Rejection near 3,326 could signal fading bullish strength
Traders, if you liked this idea or if you have your own opinion about it, write in the comments. I will be glad 👩💻

Lingrid | ADAUSDT buying OPPORTUNITY in the MarketThe price perfectly fulfilled my previous idea . BINANCE:ADAUSDT has broken out from a descending flag pattern and surged above key structure, confirming a bullish continuation within an upward channel. The recent higher low reinforces positive sentiment, with momentum favoring a push toward higher resistance. If $0.7375 holds, the bullish trend remains intact and may test $0.8500 in the coming days.
📌 Key Levels
Support zone: $0.7375 (breakout retest level)
Breakout target: $0.8500 (channel and resistance alignment)
Invalidation level: Below $0.7375 (would break structure and momentum shift)
⚠️ Risks
A drop below the flag's lower edge may signal a fake breakout
Price is nearing upper resistance levels, where sellers might reappear
Overbought conditions could trigger short-term corrections
Traders, if you liked this idea or if you have your own opinion about it, write in the comments. I will be glad 👩💻

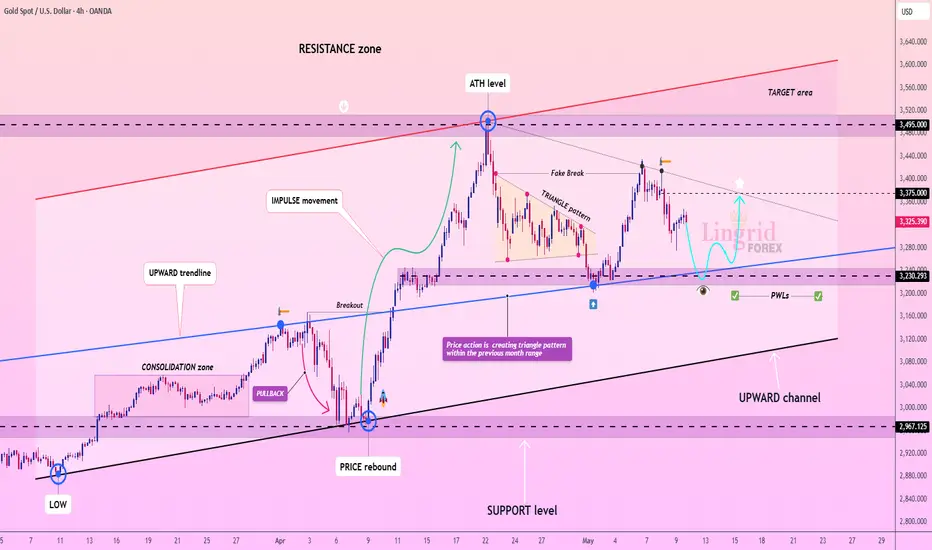
XAU/USD: Bullish Momentum Builds Near Breakout Zone, Key SupportGold (XAU/USD) is gaining strength after rebounding from trendline support, forming a sharp impulsive move and now hovering near a potential breakout zone. Momentum remains bullish, as the price reclaims previous highs and eyes the upper resistance boundary around 3,495.000.
The structure favors trend continuation as long as price remains above the key support zone at 3,345.000, where trendline and previous day’s high converge. A sustained move above 3,400 could confirm a breakout, but the risk of a false breakout remains.
Currently, the price is consolidating above a critical intersection of trendline and horizontal support near 3,300. This level must hold for bulls to retain control. A bounce from this zone would support a move toward the upper resistance, with the next target at 3,495.000. However, a break below 3,345.000 may invalidate the setup and lead to deeper correction
