EURUSD is Trading Under the Pressure of a Strong DollarHey traders, in today's trading session we are monitoring EURUSD for a selling opportunity around 1.13500 zone, EURUSD is trading in a downtrend and currently is in a correction phase in which it is approaching the trend at 1.13500 support and resistance area.
Trade safe, Joe.
Signalsprovider

USDCHF Potential UpsidesHey Traders, in today's trading session we are monitoring USDCHF for a buying opportunity around 0.82700 zone, USDCHF is trading in an uptrend and currently is in a correction phase in which it is approaching the trend at 0.82700 support and resistance area.
Trade safe, Joe.

Lingrid | TONUSDT pullback Approaching Psychological LevelThe price perfectly fulfilled my last idea . It reached the target. OKX:TONUSDT is pulling back after testing the upper resistance area near 3.40. Price is now moving toward a key support zone around 3.00, where the downward trend-line intersects horizontal structure. If bulls defend this level, the chart suggests a possible bounce back toward 3.25. The bullish scenario remains active as long as the trend-line holds.
📈 Key Levels
Buy zone: 3.03 – 3.06
Buy trigger: bounce from trend-line support
Target: 3.25
Sell trigger: break below 3.03
💡 Risks
Loss of 3.03 could lead to a drop toward the 2.78 support.
If the bounce lacks volume, recovery may be weak.
Watch for fakeouts near the trend-line—confirmation is key.
Traders, if you liked this idea or if you have your own opinion about it, write in the comments. I will be glad 👩💻

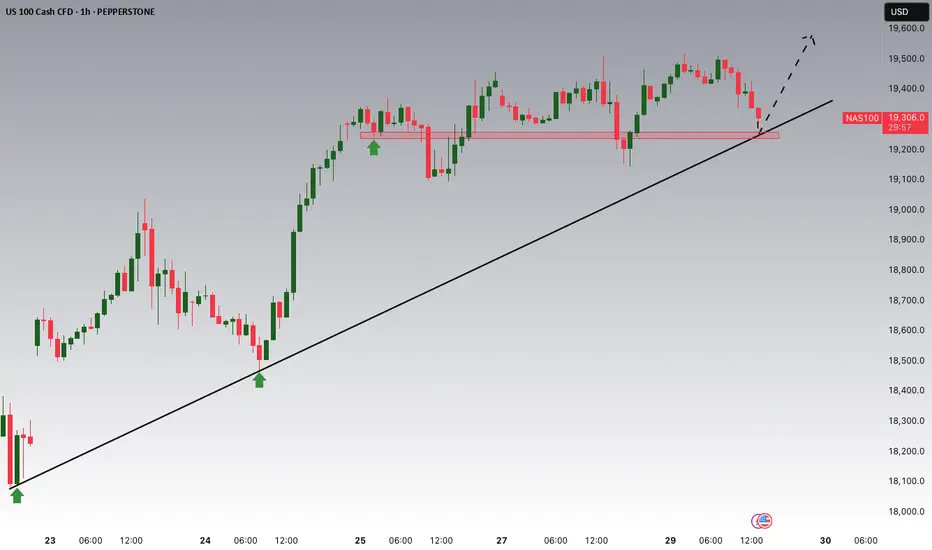
NASDAQ Potential UpsidesHey Traders, in today's trading session we are monitoring NAS100 for a buying opportunity around 19250 zone, NASDAQ is trading in an uptrend and currently is in a correction phase in which it is approaching the trend at 19250 support and resistance area.
Trade safe, Joe.
Lingrid | AUDCHF trend Continuation Pattern. Long The price perfectly fulfilled my last idea . It hit the target zone. FX:AUDCHF is holding above the upward trend-line, forming a series of higher lows after the recent flag pattern correction. The price is consolidating above support at 0.5265 and may soon bounce from this area to resume its bullish leg. As long as buyers protect the trend-line, the structure stays bullish with eyes on the 0.5337 resistance.
📈 Key Levels
Buy zone: 0.5265 – 0.5270
Buy trigger: bounce from trend-line
Target: 0.5337
Sell trigger: break below 0.5265
💡 Risks
Break below the trend-line could shift the short-term bias to bearish.
Watch for false breaks or low-volume bounces — confirmation is key.
Volatility may increase around CHF news or cross-pair flows.
Traders, if you liked this idea or if you have your own opinion about it, write in the comments. I will be glad 👩💻

Lingrid | DOGEUSDT Potential LONG on Pullback to SWAP ZoneThe price perfectly fulfilled my last idea . It reached the target. After a strong rally and fake breakout above the resistance near 0.1915, BINANCE:DOGEUSDT is now pulling back and trading inside a sideways range. Price is heading toward the 0.1700–0.1710 support area, which aligns with the upward trend-line. If bulls hold this zone, a rebound toward 0.1850 looks likely. As long as price stays above the trend-line, bullish structure remains valid.
📈 Key Levels
Buy zone: 0.1700 – 0.1710
Buy trigger: bounce from trend-line
Target: 0.1850
Sell trigger: break below 0.1700
💡 Risks
If price breaks below 0.1700, it may open the way toward deeper support.
Sudden spikes in Bitcoin or market-wide sentiment shifts can shake the setup.
Lower timeframe volatility near trend-line could trap early entries.
Traders, if you liked this idea or if you have your own opinion about it, write in the comments. I will be glad 👩💻

Lingrid | GBPCAD bullish BREAKOUT with Short-Term PullbackThe price has perfectly followed my previous analysis . Recently, the FX:GBPCAD price broke and closed above the previous week's high and the psychological level at 1.85000. Following this significant breakout, the market is pulling back toward the support level, trendline, and triangle pattern. If the market remains above this support zone, the chance of continuation is high. I expect the price to reject this level and rebound, following with continuation toward the next resistance zone. This price action demonstrates classic market behavior following a key breakout, where a retest of former resistance as new support often provides an optimal entry point for traders aligned with the prevailing trend direction. My goal is resistance zone around 1.86510
Traders, if you liked this idea or if you have your own opinion about it, write in the comments. I will be glad 👩💻

Lingrid | SOLUSDT Consolidation After KEY Resistance BreakThe price perfectly fulfilled my previous idea . BINANCE:SOLUSDT market has effectively bounced off the support level and continues moving higher. The price has established a significant swap zone around the 135.00 level, where it has repeatedly found resistance or support in previous tests.
Recently, the market broke and closed above the 140.00 resistance zone, and following this breakout, the market has entered a consolidation phase, suggesting it may continue moving sideways in the near term. However, if the price pulls back toward the established swap zone, we can anticipate continuation of the current bullish trend. This consolidation pattern following a resistance break often signals strengthening market conviction before the next meaningful advance. My goal is resistance zone around 165.00
Traders, if you liked this idea or if you have your own opinion about it, write in the comments. I will be glad 👩💻

Lingrid | GOLD Weekly Analysis: CORRECTIVE Phase after the SurgeOANDA:XAUUSD market initially rallied during the week, reaching the key 3500 level. However, we have a corrective move, showing a bit of profit taking as traders are looking to the tariff noise for direction. The market made a sharp decline resulting in a long-tailed bearish bar on the weekly timeframe, suggesting the price may continue pushing lower toward the 3150 support levels. The price shows similar price action to what we saw at the beginning of this month when a market decline was followed by a week of sideways movement, which then led to continuation of the bullish trend.
I think we might see 2 scenarios to identify the potential endpoint of this corrective move. On the daily timeframe, the price is near the 50% retracement of the bullish swing move, which may be a potential level for continuation. The second scenario is an ABCD pullback where price dips below the 3200 level to find support. In any case, we should react to the price action and how it develops. If the Monday candle gaps up, this potentially indicates that price may move higher. And if we get a gap down, then we can expect a deeper pullback in the market.
Traders, if you liked this idea or if you have your own opinion about it, write in the comments. I will be glad 👩💻

Lingrid | EURUSD possible REVERSAL from Critical RESISTANCE FX:EURUSD is currently testing a significant upward trendline while consolidating in a narrow sideways range just above this crucial support. Notable bearish signals have emerged, including a clear divergence pattern and a false breakout attempt above the previous higher high level – a classic trap for bullish traders. Adding weight to the bearish case, price action has formed a long-tailed rejection bar on the daily timeframe precisely at the key resistance zone that corresponds with the 2022 high level. This powerful rejection at historical resistance shouldn't be overlooked. I anticipate a meaningful pullback once price decisively breaks below the upward trendline support. This corrective move appears increasingly probable given that price has now completed a textbook ABC pattern on the daily timeframe. The completion of this pattern, combined with the other technical signals, suggests we're likely at an inflection point where momentum could shift significantly to the downside. My goal is supprot zone around 1.11550
Traders, if you liked this idea or if you have your own opinion about it, write in the comments. I will be glad 👩💻

Lingrid | BTCUSD weekly BULLISH Closure Above KEY LevelsThe price perfectly fulfilled my last idea . It reached the target level. Last weekly candle closed bullish showing bulls stepped in, and previous week BINANCE:BTCUSDT closed above the last 6 week highs. The market completed the ABC movement, therefore the market is moving sideways around the 95,000 level. At this point we can see the pullback in the market since it's testing the previous week high and ABC completion. This pullback would give us the opportunity to go long from the support zone in expectation of continuation. Looking left on the daily chart, we can see the price kept rebounding from the support level around 90,000 from November and February, which shows the importance of this zone. If the price pulls back toward this key level, the chance of bouncing off is pretty high. This historical support combined with the recent bullish momentum creates a compelling case for potential upside continuation after the current retracement completes. My mid-term goal is resistance zone around 99600
Traders, if you liked this idea or if you have your own opinion about it, write in the comments. I will be glad 👩💻

Bitcoin: Short-Term Bullish, but Herd Mentality ReturnsAfter reaching my 75K target, Bitcoin started to recover nicely. In its comeback, it delivered two important bullish confirmations:
➔ First, it broke above the descending trendline around 84K.
➔ Then, it made a small consolidation, followed by a new leg up that pushed the price above the critical 92K technical zone — also reclaiming the psychological 90K mark.
At the time of writing, the price holds well above horizontal support. From a technical perspective, as long as the 90-91K area remains intact, we can expect higher prices. The next big resistance is around 100K, and if support holds, we might see Bitcoin testing that zone again in the coming days.
Speculators could look to buy dips as long as the structure stays healthy.
My take:
Even though the setup looks technically decent, I'm personally staying out for now. Once again, the crowd is shouting that "the correction is over" and "it's time to buy" — a classic red flag in market psychology.

Lingrid | TONUSDT support REBOUND Confirms POSSIBLE Reversal The price has perfectly fulfilled my previous forecast . OKX:TONUSDT market bounced off the support level and is now showing clear signs of reversal. Additionally, price action broke and closed above the psychological level at 3.00, confirming bullish momentum. The price action is creating an ABC pattern, suggesting the market may reach the upper border of the channel. Currently, the price is testing the weekly high level, and from this zone, a short-term pullback may form. If the price retraces toward the swap zone, we can expect it to rebound and continue pushing higher. We should look at the current test of the weekly high for signs of temporary resistance before the anticipated pullback. My goal is resistance zone around 3.40
Traders, if you liked this idea or if you have your own opinion about it, write in the comments. I will be glad 👩💻

Lingrid | TRXUSDT broke CONSOLIDATION zone. Potential LongThe price perfectly fulfilled my last idea . It hit the target level. BINANCE:TRXUSDT market has decisively broken through the 0.2500 psychological level and consolidation zone with an impulse leg. Additionally, it has broken through the downward trendline, confirming the strength of this move. On the higher timeframe, the market is forming an ABC pattern, suggesting that price may reach the resistance zone around 0.2780. I expect a pullback in the near term, which would likely present a buying opportunity, followed by continuation of the bullish trend. My goal is resistance zone around 0.2595
Traders, if you liked this idea or if you have your own opinion about it, write in the comments. I will be glad 👩💻

Lingrid | GOLD Wednesday's HIGH-LOW to Determine Next DirectionOANDA:XAUUSD continues its consolidation after falling from the resistance zone. It consistently respects the downward trendline, repeatedly bouncing lower from this barrier. The market recently formed a triangle pattern and broke through it, though notably without triggering major sell-offs. Currently, price action is testing the previous day's low. However, I believe the price may retest Wednesday's low since price is trading within Wednesday's range. This has formed an inside bar candlestick pattern on the daily timeframe, suggesting the next decisive move will occur following a breakout beyond Wednesday's low or high boundaries. Overall, I expect the sideways movement to continue until next week, with closely watching these key levels for potential signals. My goal is resistance zone around 3355
Traders, if you liked this idea or if you have your own opinion about it, write in the comments. I will be glad 👩💻

Lingrid | NZDUSD Consolidation PHASE Following Bullish RunPYTH:NZDUSD market is consolidating following the recent bullish run. Price action appears to be creating a triangle pattern, typically considered a continuation formation. The market consistently bounces off the support zone around the 0.59500 level, suggesting this area holds significant buying interest. After the triangle pattern completes, price will likely move to higher levels, following the pattern's characteristics as a trend continuation formation. If the market respects the support zone and channel border with a clear rejection, we can expect price to rebound and retest the trendline before potentially moving higher. My goal is resistance zone around 0.59900
Traders, if you liked this idea or if you have your own opinion about it, write in the comments. I will be glad 👩💻

EurJpy- Ready to rise at 166?Since mid-March, EURJPY has been in a consolidation phase. Except for the early April spike down, the pair has respected a pretty clear range between the 161.00 support and the 163.30 resistance.
Now, however, EURJPY looks ready to break to the upside. A sustained price above 163.30 would confirm this breakout and open the door for bullish momentum.
🔍 My strategy:
I’m looking to buy dips, ideally around the 162.50 area.
If the price drops and breaks below 161, that would invalidate the setup.
On the upside, the first major target is the 166.00 resistance zone.
Disclosure: I am part of Trade Nation's Influencer program and receive a monthly fee for using their TradingView charts in my analyses and educational articles.

Lingrid | GOLD correction Phase Following RESISTANCE RejectionOANDA:XAUUSD market bounced off the resistance and dropped, creating approximately a -6% correction after the previous bullish momentum. Price action formed a gap which was subsequently filled. Notably, this corrective move mirrors a similar pattern observed at the beginning of this month when the market also corrected by -6.6%. Currently, the price is testing the previous week's high area, which may establish itself as a support zone. Following such a rapid decline, price typically enters a consolidation phase - we might see sideways movement around the 3300 level for some time. However, if we get a rejection candles forming at current levels, I expect the price to move higher and retest the recent resistance zone. My goal is resistance zone around 3500
Traders, if you liked this idea or if you have your own opinion about it, write in the comments. I will be glad 👩💻

Lingrid | EURUSD short-term BEARISH move after RESISTANCE bounceFX:EURUSD hit the resistance at 1.15000 with significant force before bouncing off it. On the 1H timeframe, the market is forming an ABC pullback pattern, suggesting price may decline further toward the 1.12000 support level. Taking a broader view, we can observe the potential a head and shoulders pattern, which remains valid as long as price stays below the upward trendline. I think the market will retest the area below the previous week's low if price breaks through the upward channel. Given that the price entered a consolidation zone, I expect possible continued downward movement in the near term. My goal is support zone around 1.12500
Traders, if you liked this idea or if you have your own opinion about it, write in the comments. I will be glad 👩💻

Lingrid | AVAXUSDT Bullish TREND with KEY Support ZoneBINANCE:AVAXUSDT market is making higher highs, demonstrating a clear bullish trend on the current timeframe. The price has reached the previous resistance zone where it formed a pullback. This time, the price may pull back again toward the psychological level at 20.00. I expect the price to find support and bounce at the confluence of three technical factors: the support level, the previous week's high, and the upward trendline. This triple support zone could provide a solid foundation for continuation of the bullish move. My goal is resistance zone around 23.50
Traders, if you liked this idea or if you have your own opinion about it, write in the comments. I will be glad 👩💻

Lingrid | BTCUSD shifting SENTIMENT. End of CORRECTION Phase?BINANCE:BTCUSDT market initially made a false breakout below the March low before bouncing off this support level. Recently, prices broke through the downward trendline that showed the correction phase, suggesting sentiment is gradually shifting toward bullish. However, we should remain cautious as this could still develop into a false breakout. If that scenario unfolds, we anticipate the inverse head and shoulders pattern.
Notable resistance has emerged around the 84,000 level, with price action struggling to breach this threshold, highlighting its significance as a key zone. Going forward, the market will likely oscillate between 84,000 and 89,000 before potentially retesting the March high levels. Overall, we might have positive momentum and bullishness in the market towards end of this month, though this outlook remains vulnerable to any unexpected negative news that could impact price action. My mid-term goal is resistance zone around 94,800
Traders, if you liked this idea or if you have your own opinion about it, write in the comments. I will be glad 👩💻

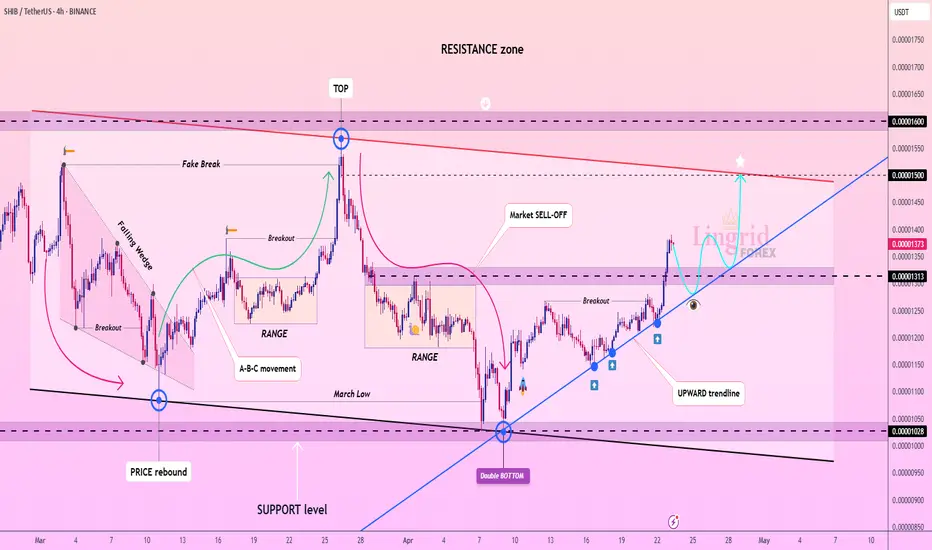
Lingrid | SHIBUSDT price REBOUND after DOUBLE Bottom FormationBINANCE:SHIBUSDT market has bounced off the support level following a double bottom formation. Price action essentially created a false breakout below the previous month's low before reversing higher. Recently, it completed an ABC move, which typically precedes a pullback phase. The 0.00001250 support level has demonstrated significant importance to the market, having been tested multiple times with price rebounding from this zone on numerous occasions. Since the price has successfully broken and closed above this critical level, I expect the market to retrace toward the support zone and upward trendline before continuing its upward movement, provided it maintains position above these key zone. My goal is resistance zone around 0.00001500
Traders, if you liked this idea or if you have your own opinion about it, write in the comments. I will be glad 👩💻
Lingrid | SUIUSDT key Support LEVELS Holding after RetestBINANCE:SUIUSDT market retraced to the support level before rebounding, having taken liquidity from below the psychological level of 2.00. This move was also accompanied by a fake breakout of the previous month's low, indicating a potential reversal in sentiment. On the daily timeframe, price is testing the November levels where we saw a surge. Looking left, we can see that the price has bounced off this support level twice before, highlighting it as an area of interest. I anticipate that the price will continue to rise from this area if sudden news doesn't drag it down. My goal is resistance zone around 2.40
Traders, if you liked this idea or if you have your own opinion about it, write in the comments. I will be glad 👩💻
