COWUSDT (CoWProtocol) Updated till 20-01-25COWUSDT (CoWProtocol) Daily timeframe range. another alt with fairly new PA and close to price discovery. these kind of alt do offers lots of opportunity as its fresh. it will try for 0.8832 resistance but price action needs to stay above 0.5933 for that.
Signalsprovider

JUPUSDT (jupiter) Updated till 19-01-25JUPUSDT (jupiter) Daily timeframe range. PA is fairly new and very close to price discovery. staying above 0.7658 can offer nice amount of opportunity here. we can already see a clean pump from 0.7658. new point to look at is 1.3722.

Lingrid | ADAUSDT closed ABOVE the Pscyhological LEVELBINANCE:ADAUSDT market broke through the psychological level of 1.000, closing above it. Although it retested the previous resistance zone, it encountered a pullback that formed a false breakout. This could signal a potential retest of the area just below the even handle number at 1.000 before the price moves higher. When we zoom out, we can observe that accumulation is taking place around the 1.000 level, which suggests that we may see further bullish movement in the near future. My goal is resistance zone around 1.2000
Traders, if you liked this idea or if you have your own opinion about it, write in the comments. I will be glad 👩💻

Lingrid | DOGEUSDT Potential Channel BREAKOUT. Long BINANCE:DOGEUSDT broke and closed above the key level at 0.3500, showing strength. Currently, the price action is testing the channel border and resistance within the 0.3700-0.3800 range. It appears the market took liquidity below the previous week's low, potentially creating a false breakout. As such, the market is now testing the previous week's high. We had a consolidation phase since the beginning of January, therefore I anticipate the market to break out of the downward channel and retest the trendline. My goal is resistance zone around 0.4300
Traders, if you liked this idea or if you have your own opinion about it, write in the comments. I will be glad 👩💻

SPELLUSDT (SpellToken) Updated till 18-01-25SPELLUSDT (SpellToken) Daily timeframe range. PA tried at 0.0011704 but seller overcome that resistance. depend on cool down if buyers hold on to it in mid level than we can see another push. local support 0.0006925 if holds, there will be always another chance.

GBPJPY Sell/Short Signal 2In continuation of GBPJPY downtrend we have officially smashed through the first TP without any issues and a smooth come down on what we have seen in previous days highs that could not sustain. I still see this going down to the second TP then go all the way down to the third TP completing the entire targets range we have analyzed to make. Please be sure to use proper risk management and as well proper caution on how much you leverage for all your trades. Thanks for stopping by to see our charts!

Lingrid | GOLD approaches December High. Short-Term PullbackThe price perfectly fulfilled my last idea. It hit the target. OANDA:XAUUSD is currently trading above the 2700 key level, and as the market approaches the channel border and the upward trendline, there are signs of potential resistance. The price previously dropped from the resistance area before and it is likey that a short-term retracement could occur if we receive sell confirmation. Additionally, the market is nearing the December high, which presents a significant level where a bounce could take place. If the market shows rejection at this resistance zone, I expect a short-term pullback. My goal is support zone around 2677
Traders, if you liked this idea or if you have your own opinion about it, write in the comments. I will be glad 👩💻

Lingrid | EURCAD shorting OPPORTUNITY at the KEY zoneThe price perfectly fulfilled my last idea. It hit the target. FX:EURCAD is forming ABCD move on the 4H timeframe. The price dropped from this area and it might act as key resistance. If the market manages to push higher toward the 1.48500 level or even above, it could be a opportunity to short alongside the bearish trend by a liquidity grab, where the market takes out stops and attracts sellers before reversing. If price shows signs of rejection at these higher levels—especially if we see bearish pinbar or other confirmation signals—there is a strong possibility of a significant bearish move following that rejection. My goal is support zone around 1.47910
Traders, if you liked this idea or if you have your own opinion about it, write in the comments. I will be glad 👩💻

AMPUSDT (Amp) Updated till 17-01-25AMPUSDT (Amp) Daily timeframe range. another alt trying for a retrace back. market still needs fuel. a valid close above 0.009294 can push it to 0.013073. as long PA can stay above 0.006399 it got chances. local support at 0.006399.

Lingrid | TONUSDT anticipating a BREAKOUT to the UpsideOKX:TONUSDT market made a false breakout of the previous week's low. Currently, the price is testing the downward channel border, suggesting a potential breakout in the market. On the daily timeframe, the multiple downside spikes indicates buying pressure from support levels, which could be sign of a potential shift in market sentiment. I think the market may consolidate around this level and potentially break upwards from here, starting from next week. Looking left, there was a bullish move before from the support zone at 5.38-5.40. This area may serve as a foundation for a renewed bullish movement, potentially leading to a bull run. My goal is resistance zone around 5.730
Traders, if you liked this idea or if you have your own opinion about it, write in the comments. I will be glad 👩💻

Lingrid | SHIBUSDT fake BREAKOUT of the WEEHKY LowsBINANCE:SHIBUSDT moved lower, forming an ABCD pullback. It created a false breakout of the last three weeks' lows, resulting in a long-tailed bar on the weekly timeframe. The market has respected the downward trendline and recently bounced off it. With the price rolling back above the PWLs, there is a possibility that it may retest that level again. When zooming out, the strongest support level appears to be around 0.000019. The price could potentially move toward this level again. However, in the midterm, I expect that the market to at least retest the LH and potentially the zone above it. My goal is resistance zone around 0.000023
Traders, if you liked this idea or if you have your own opinion about it, write in the comments. I will be glad 👩💻

Lingrid | EURUSD fake BREAKOUT. Short from RESISTANCEFX:EURUSD market recently made a false breakout above the resistance zone at 1.03200-1.03300. On the daily timeframe, the bearish trend remains intact. In response to the news release, the price dropped, and I think this downward momentum will persist, driving the price to lower levels. Furthermore, the market broke and closed below the upward trendline, which had been supporting a pullback against the major downtrend. This breakout suggests a potential continuation. I expect the price to continue to move lower, pending confirmation such as a rejection candle. My goal is support zone around 1.02475
Traders, if you liked this idea or if you have your own opinion about it, write in the comments. I will be glad 👩💻

PHAUSDT (PhalaNetwork) Updated till 16-01-25PHAUSDT (PhalaNetwork) Daily timeframe range. Finally its trying for a retrace back a clean close above 0.4353 can run it back. not a fake close keep in mind. failed close will lead it back to 0.2884 or lower. 0.2884 needs to hold for the push.

Lingrid | GOLD potential for TREND ContinuationThe price perfectly fulfilled my last idea. It hit the target. OANDA:XAUUSD market moved lower, forming a false break of the downward trendline, as I mentioned yesterday. The price is now rolling back toward the support level around 2650. I think the price may dip below the previous day's low and then bounce back if the upcoming news does not push the market lower levels. Consequently, the market may retest 60% of the previous weekly range. Given that the market is making higher highs and higher lows, I expect the price to retest the recent resistance zone again, especially if the price rejects the support level and the upward trendline. My goal is resistance zone around 2696
Traders, if you liked this idea or if you have your own opinion about it, write in the comments. I will be glad 👩💻

Lingrid | EURGBP shorting OPPORTUNITY from November HIGHThe price perfectly fulfilled my last idea. It hit the target. FX:EURGBP recently tested the November high, resulting in a false breakout on the 4H timeframe after taking liquidity above the 0.84500 level. The market printed five consecutive bullish days, but at this point, we may see some retracement. Although the price has continued to make higher highs, there's a bearish divergence forming, indicating potential weakness in the upward momentum. Given that the market is testing the monthly high with this bearish divergence, I expect a downward move from resistance and channel border. My goal is support zone around 0.83710
Traders, if you liked this idea or if you have your own opinion about it, write in the comments. I will be glad 👩💻

Lingrid | AUDCHF continues to Moving Sideways. Potential ShortFX:AUDCHF is currently trading within a downward channel and has recently formed a new lower low. The price is now approaching the resistance zone and the upper channel boundary after bouncing off the support level. I expect a pullback and a retest of the support level, followed by additional downward momentum. This expectation is supported by the 4H timeframe, where the market has encountered a strong resistance zone, indicating that it is likely to continue its bearish trajectory. Therefore, I anticipate the market to retest the support level before moving further bearish toward the lower channel boundary. My goal is the support zone around 0.56470
Traders, if you liked this idea or if you have your own opinion about it, write in the comments. I will be glad 👩💻

STPTUSDT (STP) Updated till 15-01-25STPTUSDT (STP) Daily timeframe range. we can see 2 wicks toward 0.08291 thats buyers trying to clear out sellers on resistance. if retail interest keeps up its not hard to get over 0.08291. its holding well even through market dump till now. recent support at 0.06287.

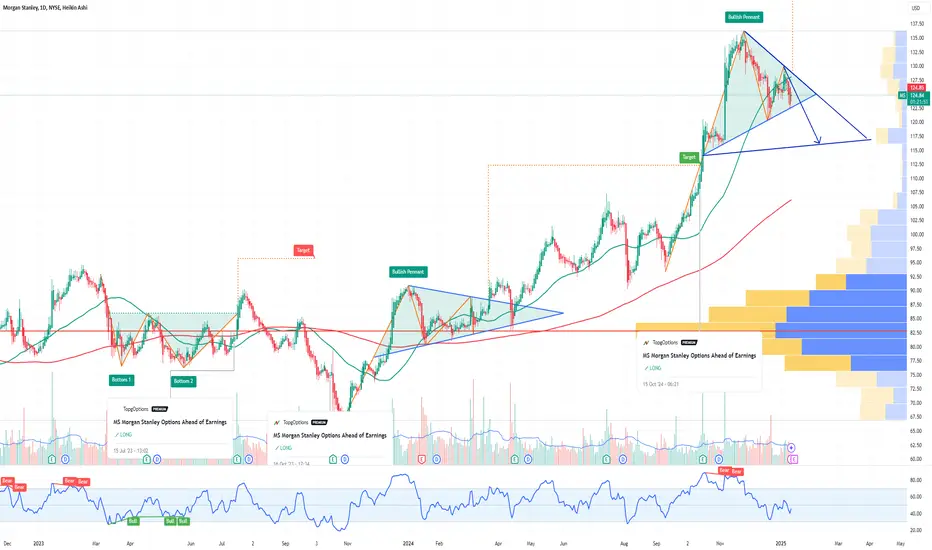
MS Morgan Stanley Options Ahead of EarningsIf you haven`t bought MS before the previous earnings:
Now analyzing the options chain and the chart patterns of MS Morgan Stanley prior to the earnings report this week,
I would consider purchasing the 125usd strike price Puts with
an expiration date of 2025-2-21,
for a premium of approximately $4.85.
If these options prove to be profitable prior to the earnings release, I would sell at least half of them.
Lingrid | BITCOIN quick SELL-OFF from the RESISTANCE zoneBINANCE:BTCUSDT market is currently moving sideways, and I think it may continue this trend until the presidential inauguration. Additionally, the price has formed an ABCD pullback from the all-time high, with the D point completing around the support level of 86,000. The market has tested the 91,000 support level three times; however, there’s a possibility that the price may break through towards 90,000 on fourth approch, given that it is consolidating just above this level. I expect the market to dip below the psychological level of 90,000 in order to seek liquidity for a more bullish move in the near future. My goal is support zone around 87,000
Traders, if you liked this idea or if you have your own opinion about it, write in the comments. I will be glad 👩💻

EURCAD: Bearish Setup at Key ResistanceEURCAD is consolidating after a sharp rebound from lower levels, but the overall structure still hints at a bearish setup. The price is now approaching a key resistance zone around 1.5000–1.5120, a level where sellers have historically shown strong activity. Will the resistance hold, or will buyers push further? The reaction here will be critical.
The current setup suggests that the price may retest the resistance zone before being rejected and starting a move toward the support at 1.4862. A break and consolidation below this level could open the way toward deeper support around 1.4700 and potentially lower.
However, a breakout and consolidation above 1.5120 would invalidate the bearish scenario and signal a potential continuation of the bullish trend.

Lingrid | ETHUSDT expecting Short-Term CORRECTION BINANCE:ETHUSDT market recently dropped and tested the psychological level of 3000. It briefly broke through the previous support level but then pulled back. However, we’re not seeing any bullish momentum from this area, indicating there may be fewer buyers. As a result, the market could establish a range zone for accumulation. I think the market is likely consolidate around this support level. Since the range zone acts as both support and resistance, I expect the price to reverse and retest the 3000 level. On the daily timeframe, the price is forming an ABCD pullback, suggesting that the market may dip below the 2900 level. Looking back to the beginning of 2024, we can observe a similar pattern. My goal is support zone around 3000
Traders, if you liked this idea or if you have your own opinion about it, write in the comments. I will be glad 👩💻

PnutBINANCE:PNUTUSDT
📊 **Pnut Current Price: 0.6058**
- We're currently facing a **resistance** level at this price 🔴.
💥 If we break this resistance, the next levels to watch are:
- **0.6534** 🚀 (First target)
- **0.7433** 📈 (Next level)
- **0.8000** 🌕 (Major resistance)
🔻 **If the price doesn't hold above 0.6058**, we might see a dip to **support levels**:
- **0.5500** ⚖️ (First support level)
- **0.4500** ⬇️ (Stronger support)
---
So, if the price breaks through resistance, we could see a bullish move. But if it falls below 0.6058, keep an eye on those support levels for possible rebounds! 💡
**Note:** This is not financial advice! Always do your own research. 📉📈

PROMUSDT (Prom) Updated till 14-01-25PROMUSDT (Prom) Daily timeframe range. its holding pretty well compare to many other alts. despite recent market dump it had pump thats good performance there. now PA trying to stay over 7.804 if it can next resistance to look at is 10.513.
