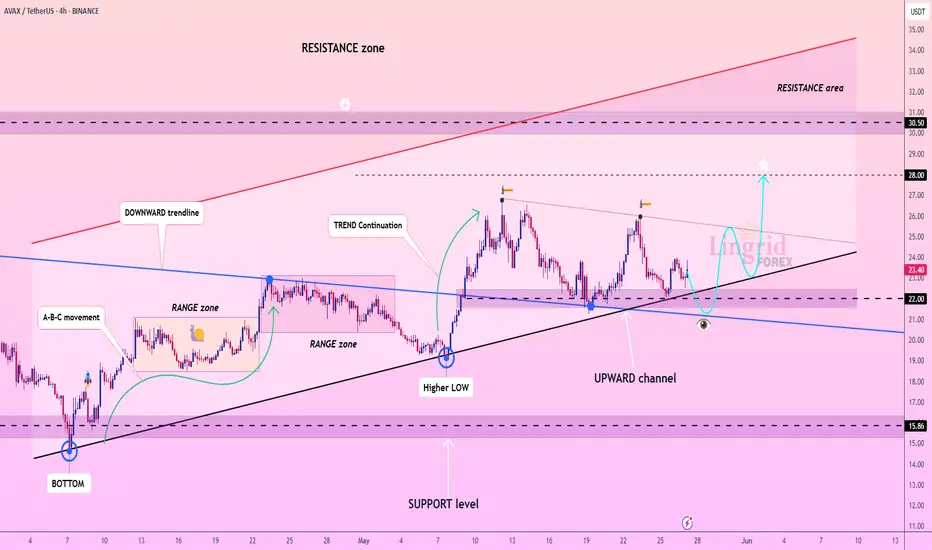
Lingrid | AVAXUSDT Compression Phase Before Upside BreakoutBINANCE:AVAXUSDT is retracing from local highs but remains inside the broader upward channel. Price is nearing the $22.00 support zone, which aligns with the uptrend line and a potential higher low area. If bulls defend this zone and trigger a bounce, we could see a continuation toward $28.00 and possibly higher into the resistance area. However, a breakdown below $22 would shift near-term structure bearish.
📈 Key Levels
Buy zone: $21.50 – $22.00
Buy trigger: bullish rejection from $22.00 with volume
Target: $28.00
Sell trigger: clean break below $21.50
💡 Risks
Crypto market sentiment remains fragile amid macro uncertainties
Failed bounce from $22 could initiate deeper correction
Loss of trendline support would invalidate bullish setup
Traders, if you liked this idea or if you have your own opinion about it, write in the comments. I will be glad 👩💻
Signalsprovider
Lingrid | GOLD Weekly Outlook: Flag BREAKOUT Eyes April HighOANDA:XAUUSD is currently forming a textbook flag pattern at 3,358, following the sharp rally from March lows. This consolidation represents a pause in bullish momentum rather than a reversal, with price oscillating between well-defined boundaries in a rectangular formation. The 4H chart shows a completed corrective wedge pattern after April's 3,500 high, while the daily timeframe clearly displays the flag structure - a classic trend continuation pattern. The downward trendline containing recent price action appears increasingly vulnerable as gold approaches the flag's upper boundary.
Key technical levels include immediate resistance at 3,400, with the more significant battle at 3,500 where April highs converge with the flag's upper boundary. A decisive break above this zone could trigger rapid acceleration toward measured move targets around 3,680 - 3,720. The major support at 3000 has held firm throughout consolidation, providing a solid foundation for renewed buying. The primary uptrend remains intact with consistent higher lows despite periodic weakness.
The broader macro environment continues supporting gold's fundamental case through geopolitical uncertainties, currency concerns, and diversification needs. Combined with this compelling technical setup, the current consolidation likely represents accumulation rather than distribution. Next week we should monitor the flag's upper trendline closely, as any breakout above 3,380 - 3,400 could trigger rapid acceleration toward new all-time highs.
Traders, if you liked this idea or if you have your own opinion about it, write in the comments. I will be glad 👩💻

Lingrid | EURUSD long Entry Opportunity from Support ZoneThe price perfectly fulfilled my previous idea . FX:EURUSD is pushing higher after breaking through the downward trendline and forming a higher low. Price is currently hovering above the key 1.1320 swap zone and could use this level as support for a bullish continuation. A bounce from this region would open the path toward the 1.1500 resistance inside the upper part of the bullish channel. However, failure to hold 1.1320 may trigger a deeper pullback into the rising trendline.
📈 Key Levels
Buy zone: 1.1300 – 1.1320
Buy trigger: bullish bounce from 1.1320
Target: 1.1500
Sell trigger: break below 1.1300
💡 Risks
Weak Eurozone data could derail bullish setup
USD strength on Fed hawkishness may stall recovery
Trendline break would signal bearish reversal structure
Traders, if you liked this idea or if you have your own opinion about it, write in the comments. I will be glad 👩💻

Lingrid | BTCUSDT potential Bullish CONTINUATION from SupportThe price perfectly fulfilled my last idea . BINANCE:BTCUSDT has rebounded from a higher low along the upward trendline after a triangle pattern breakout. Price is now testing the $108,450 resistance, and holding above this level could trigger a continuation toward the $114,000 target area. The bullish channel structure remains intact, and buyers are in control while price stays above the rising support. Failure to hold above $108K may invite a retest of the $104,400 zone.
📈 Key Levels
Buy zone: 107,000 – 108,450
Buy trigger: breakout and hold above 108,450
Target: 114,000
Sell trigger: break below 107,000
💡 Risks
Sudden BTC ETF outflows could hurt sentiment
Failure to reclaim $108K could trap late buyers
Breaking below the ascending trendline would weaken bullish momentum
Traders, if you liked this idea or if you have your own opinion about it, write in the comments. I will be glad 👩💻

Lingrid | SHIBUSDT Potential Rally to Key Resistance ZoneBINANCE:SHIBUSDT is consolidating above the key support at 0.00001373, sitting right at the intersection of the upward trendline and a major structure retest. A wedge pattern suggests cooling pressure, with the setup favoring a bullish breakout if buyers step in near this confluence. The key target lies in the 0.00001727 zone, aligning with prior highs inside the resistance channel. A breakdown below trendline support would invalidate this bullish outlook.
📈 Key Levels
Buy zone: 0.00001350 – 0.00001373
Buy trigger: breakout above wedge and upward trendline defense
Target: 0.00001727
Sell trigger: close below 0.00001350
💡 Risks
Weak volume on breakout may signal a fake move.
Sudden volatility from BTC could derail recovery.
Failure to hold the trendline flips structure bearish.
Traders, if you liked this idea or if you have your own opinion about it, write in the comments. I will be glad 👩💻

Lingrid | GOLD bullish BREAKOUT from Downward ChannelOANDA:XAUUSD is retesting the broken trendline from above while consolidating just above the key $3,300 level. A successful bounce from this zone could ignite a rally toward the next resistance at $3,382, breaking the recent lower high structure. However, the market remains sensitive to any fake breaks, as seen multiple times in the current structure. Bulls need to defend the trendline to keep the upward momentum alive.
📈 Key Levels
Buy zone: $3,300 – $3,310
Buy trigger: bounce from upward trendline
Target: $3,382
Sell trigger: close below $3,300
💡 Risks
Another fake breakout could trap late buyers.
Bearish rejection from the red resistance trendline may stall upside.
U.S. macro data surprises could inject volatility.
Traders, if you liked this idea or if you have your own opinion about it, write in the comments. I will be glad 👩💻

Lingrid | EURUSD potential Trend MOMENTUM ContinuationThe price perfectly fulfilled my previous idea . FX:EURUSD continues its recovery within the upward channel, having rebounded strongly from the 1.1316 support, aligned with the rising trendline. The pair is forming a higher low, and the structure hints at another bullish leg, potentially pushing into the 1.14 resistance near the channel's top. As long as price holds the 1.1316 zone, the bullish scenario remains valid. A break below would shift the bias back toward the 1.1217 support area.
📈 Key Levels
Buy zone: 1.1316 – 1.1330
Buy trigger: bounce continuation from trendline
Target: 1.1400
Sell trigger: breakdown below 1.1316
💡 Risks
A hawkish tone from the ECB could cause volatility.
False breakout patterns near resistance might trap buyers.
Loss of the trendline would weaken bullish conviction.
Traders, if you liked this idea or if you have your own opinion about it, write in the comments. I will be glad 👩💻

Lingrid | TONUSDT Buying OPPORTUNITY in the ACCUMULATION Zone OKX:TONUSDT saw a sharp sell-off from the double top near 3.59, but the price rebounded from the 2.88 support zone, forming a potential accumulation structure. The current setup suggests a consolidation just below the key resistance at 3.25, aligning with the descending trendline. A breakout above this level would confirm bullish momentum and open room for further upside. Until then, the 3.03–3.05 area remains a tactical range for accumulation.
📈 Key Levels
Buy zone: 3.00 – 3.05
Buy trigger: breakout above 3.25 resistance
Target: 3.25
Sell trigger: failure to hold above 3.00
💡 Risks
Continued rejection at the descending trendline caps upside.
A clean break below 2.88 would invalidate the bullish scenario.
Market-wide volatility may distort breakout signals.
Traders, if you liked this idea or if you have your own opinion about it, write in the comments. I will be glad 👩💻

Lingrid | GOLD Range RESISTANCE Short SetupThe price perfectly fulfilled my previous idea . OANDA:XAUUSD bounced from the higher low and is now testing the key resistance around 3330, where the downward trendline intersects the prior weekly high (PWH). Price remains within the broader upward channel, but signs of rejection could lead to a retest of the 3215 support area. Bulls must reclaim and hold above the descending trendline to regain control. A failure here would confirm another lower high and open downside risk.
📈 Key Levels
Buy zone: 3215 – 3230
Buy trigger: breakout above 3330 and trendline retest
Target: 3494
Sell trigger: rejection from 3330 resistance
💡 Risks
Macro catalysts (FOMC, CPI) could trigger volatility.
Repeated failure to reclaim trendline may deepen bearish pressure.
Higher low remains valid unless 3215 breaks decisively.
Traders, if you liked this idea or if you have your own opinion about it, write in the comments. I will be glad 👩💻

Lingrid | AUDUSD sideways Market POTENTIAL Short EntryThe price perfectly fulfilled my previous idea . FX:AUDUSD facing resistance near the 0.6450–0.6460 area, marked by a lower high under the descending red trendline. After a breakout from the triangle pattern, price showed strength but failed to sustain above the swap zone. Now it's forming a potential lower high setup, suggesting weakening momentum. If price fails to clear resistance, it could rotate back toward 0.6412 support and below.
📉 Key Levels
Sell trigger: rejection near 0.6450
Buy zone: 0.6412
Target: 0.6368
Buy trigger: reclaim of 0.6460 with strong bullish candles
💡 Risks
A break above the descending trendline would shift structure bullish.
U.S. dollar weakness could invalidate the bearish thesis.
Data surprises may cause sharp volatility spikes.
Traders, if you liked this idea or if you have your own opinion about it, write in the comments. I will be glad 👩💻

Lingrid | SUIUSDT Pattern Building For BULLISH ExtensionBINANCE:SUIUSDT is building strength along the upward trendline after breaking out of a flag pattern. Price is holding above the key support at 3.89, preparing for another potential push toward the upper resistance channel around 4.70. The structure remains bullish with successive higher highs and solid trendline defense. A clean bounce here could confirm continuation toward the top of the resistance zone.
📈 Key Levels
Buy zone: 3.85 – 3.90
Buy trigger: bounce from trendline support
Target: 4.70
Sell trigger: loss of 3.85 and breakdown below trendline
💡 Risks
Market-wide corrections may invalidate the local bullish setup.
Multiple failed breakouts near 4.20 may create short-term overhead pressure.
Rejection from the red channel top again would signal exhaustion.
Traders, if you liked this idea or if you have your own opinion about it, write in the comments. I will be glad 👩💻

Potential Selling Opportunity on Gold from 3374 level!Hello traders, 👋
I’m closely watching Gold (XAU/USD) for a possible short setup around the 3374 zone, and here’s my breakdown:
📉 Trend Structure:
Gold continues to respect its bearish market structure, consistently forming Lower Highs (LHs) and Lower Lows (LLs) — a clear sign of sellers maintaining control.
📐 Key Confluence at 3374:
Price is currently retracing toward a descending trendline that perfectly aligns with the 78.6% Fibonacci retracement level, drawn from the previous swing highs. This confluence zone strengthens the case for a potential reversal.
📍 Sell Zone:
I’m watching the 3360–3380 region, with 3374 being my preferred level to look for entries.
Entry Confirmation:
Before executing a trade, I’ll be waiting for:
A bearish engulfing candle
A bearish breaker block
Or a strong rejection pin bar on the lower timeframes
🎯 Targets:
TP1: 3321
TP2: 3253
TP3: 3210
🔒 Risk management is key – always wait for confirmation before entering!
Let me know what you think in the comments — agree or disagree? 👇
Trade safe and stay sharp!

Lingrid | USDCHF channel Breakout: SELLING OpportunityThe price perfectly fulfills my previous idea . FX:USDCHF recently broke below both its upward channel and triangle support, confirming a bearish shift in momentum. The price is now retesting the $0.8299 zone, which aligns with the underside of the broken structure and a key confluence point near the descending trendline. If rejected here, the pair could extend losses toward the next major support around $0.8140. Sellers remain in control unless price reclaims the $0.8300 region decisively.
📈 Key Levels
Sell trigger: rejection from $0.8299 – $0.8300
Target: 0.8140
Buy zone: none while under trendline
Buy trigger: strong recovery above $0.8300
💡 Risks
False breakdown could lead to quick recovery rally.
Broader USD strength may invalidate the bearish setup.
Consolidation near $0.8300 may delay directional clarity.
Traders, if you liked this idea or if you have your own opinion about it, write in the comments. I will be glad 👩💻

Lingrid | TRXUSDT Trend Continuation FormationBINANCE:TRXUSDT remains in a clear uptrend, bouncing within its upward channel and forming higher lows. After a strong rally, price is consolidating around the $0.2680 support near the trendline, with signs of a bullish continuation pattern. A break above $0.2750 could fuel momentum toward the $0.2865 resistance zone. As long as price respects the rising trendline, the structure favors buyers.
📈 Key Levels
Buy zone: 0.2680 – 0.2710
Buy trigger: rebound from trendline support
Target: 0.2865
Sell trigger: break below 0.2680
💡 Risks
Loss of trendline support could shift bias short-term.
Broader market pullbacks may suppress TRX upside.
Weak breakout could lead to fakeout and reversal.
Traders, if you liked this idea or if you have your own opinion about it, write in the comments. I will be glad 👩💻

Lingrid | GOLD Potential Near-Term BULLISH MomentumOANDA:XAUUSD is attempting to stabilize just above the $3,208 zone after forming a lower low inside the downward channel. Price is compressing between the support base and descending trendline, signaling potential for breakout if buyers reclaim $3,225. A successful retest and push above this level could trigger a rally toward $3,285. Bulls will likely remain in charge if the structure holds above $3,208.
📈 Key Levels
Buy zone: 3,208 – 3,225
Buy trigger: breakout and hold above descending trendline
Target: 3,285
Sell trigger: drop below 3,208
💡 Risks
Fed comments or rate surprises may jolt gold direction.
Sharp rebound in USD could undermine gold recovery.
Rejection from trendline may resume the bearish structure.
Traders, if you liked this idea or if you have your own opinion about it, write in the comments. I will be glad 👩💻

Lingrid | GBPJPY possible Channel BREAK Bearish MoveThe price perfectly fulfilled my last idea . FX:GBPJPY is consolidating after a strong rally toward the March high. Price is now testing support near 193.8, where the ascending trendline and prior breakout zone converge. A failure to hold this level may open the door for a drop toward 191.000. However, bulls remain in control while price stays above trend support.
📈 Key Levels
Buy zone: 193.0 – 193.8
Buy trigger: bounce from trendline with bullish momentum
Target: 196.3
Sell trigger: break below 193.0
💡 Risks
Weak UK data may trigger bearish sentiment.
Yen strength due to safe-haven flows could pressure GBPJPY.
Break of trendline may lead to deeper correction below 191.
Traders, if you liked this idea or if you have your own opinion about it, write in the comments. I will be glad 👩💻

Lingrid | ADAUSDT Bullish Pattern Continuation from SUPPORTBINANCE:ADAUSDT is pulling back after forming a local top near the $0.81 resistance. Price is now drifting toward a confluence support zone around $0.70–0.71, where the upward trendline meets previous breakout levels. If buyers step in here, a rebound could propel price back toward the upper range at $0.81. Holding above this support keeps the bullish channel structure intact.
📈 Key Levels
Buy zone: 0.7000 – 0.7088
Buy trigger: bullish reaction from channel support
Target: 0.8100
Sell trigger: break below 0.7000
💡 Risks
BTC volatility could drag alts lower.
Break below the trendline may signal broader weakness.
Low trading volume near support could cause false breakouts.
Traders, if you liked this idea or if you have your own opinion about it, write in the comments. I will be glad 👩💻

GBPAUD sell Setup nice potentialGBPAUD sell Setup nice potential.
of course this is my view, not recommendation

Gold Sell Setup: Bearish Price Action Points to 3092!Hello traders,
I'm currently keeping a close eye on Gold (XAU/USD) for potential short setups. Recent price action shows clear bearish pressure, with Lower Highs (LHs) and Lower Lows (LLs) forming consistently — a strong indication that bulls are losing control and sellers are still in charge.
I'm particularly watching the internal highs around the 3265 zone. I’m anticipating a possible liquidity sweep above that level — a fake breakout that could tap into the daily imbalance zone (highlighted on the chart below). If price reacts bearishly from that area, I’ll be looking for confirmation to go short.
GOLD Daily
My short-term target for this sell idea is around 3092, just below last week's low.
That’s my current perspective on Gold — what are your thoughts?
Feel free to drop your analysis or any alternative views in the comment section below. Let’s learn and grow together!

Lingrid | GOLD Weekly MARKET Outlook: From ATH to Range-BoundOANDA:XAUUSD market is currently in a critical consolidation phase following its all-time high level. The recent price action shows a significant pullback with a close below both the last 4 weeks' low and the previous higher low. This isn't necessarily a reversal but rather a structural shift toward a range-bound market dynamic. The chart clearly illustrates a completed impulse leg that reached the resistance zone, followed by what appears to be developing into a corrective move.
The upward trendline that has supported the entire rally from the bottom around 2843 remains intact despite recent weakness. This suggests the longer-term bullish structure hasn't been invalidated yet, though it's currently being tested. The recent break below 3260 is particularly significant as it represents a break of support that had previously acted as a foundation for bullish price action. This suggests a deeper correction may unfold before the next structural move can develop.
Fundamentally, this pullback may be attributed to several factors including stabilizing geopolitical tensions, pausing the tariff war, or profit-taking after the substantial run-up. While the gold market has clearly shifted from its parabolic advance to a consolidation phase, the overall structure remains constructive for eventual continuation higher once this correction completes.
Traders, if you liked this idea or if you have your own opinion about it, write in the comments. I will be glad 👩💻

Lingrid | EURUSD possible REVERSAL Zone After CorrectionFX:EURUSD respected the support at the higher low and rebounded, holding the upward trendline. Price is currently compressing near the 1.114 zone after a sharp pullback from the resistance. If buyers maintain strength above the trendline, a continuation toward 1.1350 is likely in the coming sessions.
📌 Key Levels
Support: 1.11429
Intermediate resistance: 1.12384
Target: 1.13500
⚠️ Risks
Failure to hold above the trendline may retest 1.114
Breakdown could expose the pair to 1.07389
Prolonged consolidation might weaken bullish momentum
Traders, if you liked this idea or if you have your own opinion about it, write in the comments. I will be glad 👩💻

Lingrid | BTCUSDT Consolidation DIP Buying OpportunityBINANCE:BTCUSDT completed an expanding triangle breakout and reached a higher high within the resistance zone. After the bullish run, price pulled back toward the $100,250 level and may enter a brief consolidation phase above the upward channel’s midline. If support holds, bulls may aim for $106,850 to test the upper boundary of the channel.
📌 Key Levels
Support: $100,250
Midline Guide: $102,000–$103,000
Target: $106,850
⚠️ Risks
Rejection from the resistance band may trap buyers
Falling below $100K could shift bias short-term
Low volatility may delay breakout attempts
Traders, if you liked this idea or if you have your own opinion about it, write in the comments. I will be glad 👩💻

Lingrid | SHIBUSDT long OPPORTUNITY after PULLBACKThe price has perfectly fulfilled my previous forecast . BINANCE:SHIBUSDT saw a strong rally with an A-B-C structure and triangle breakout, leading to a fake breakout above the resistance zone. After the rejection at the red resistance line, the price pulled back to retest the ascending black trendline, which now aligns with the 0.00001382 level. A bounce here could push price back toward the 0.00001600 target if support holds.
📌 Key Levels
Support: 0.00001382
Intermediate Target: 0.00001600
Resistance: 0.00001727
⚠️ Risks
Breakdown below the trendline could retest 0.00001230
The blue downward trendline may act as short-term resistance
Weak volume could invalidate the breakout attempt
Traders, if you liked this idea or if you have your own opinion about it, write in the comments. I will be glad 👩💻
