SIGN buy/long setup (4H)A tight consolidation range has been broken to the upside, and price has not yet pulled back to it.
On the chart, we have a trigger line breakout and the formation of a bullish change of character (CH).
When the price reaches the green zone, we can look for buy/long positions.
Targets are marked on the chart.
For risk management, please don't forget stop loss and capital management
Comment if you have any questions
Thank You
SIGNUSDT

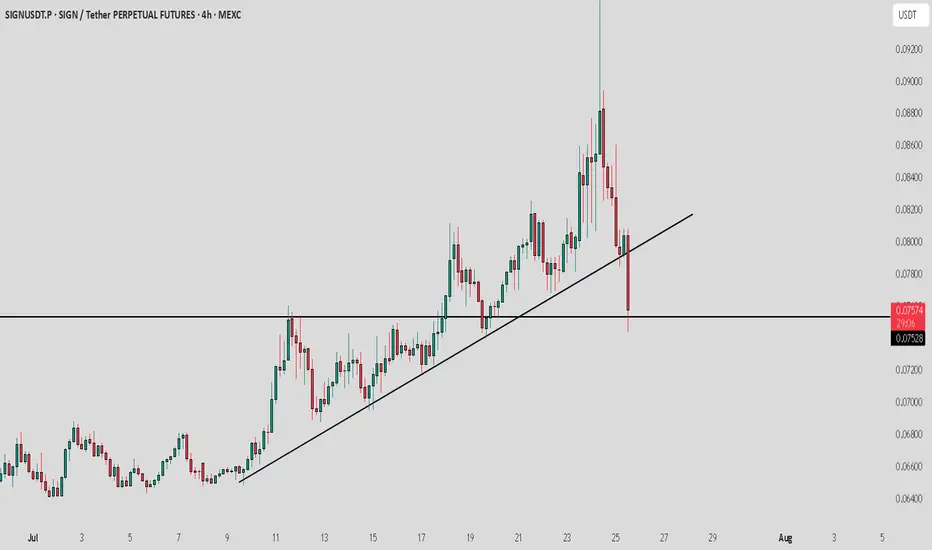
Sign / USDT : Huge breakdown and currently sitting on supportSIGN/USDT Analysis:
SIGN is testing a crucial support level. The price has pulled back from its recent highs and is now sitting on a key Horizontal line. How the market reacts here will determine the next move.
Bullish Scenario:
Horizontal line Support: If the price holds above the Horizontal line and shows signs of buying pressure, a bounce could happen, and we may see the price move back up towards the previous highs.
Confirmation: Look for strong bullish candles or an increase in volume to confirm the bounce.
Bearish Scenario:
Horizontal line Breakdown: If the price breaks below the Horizontal line and fails to recover, further downside could be expected.
Target: Watch for the next support level to gauge the downside potential.
Note:
The market is volatile, and a shakeout could happen at any moment. Manage your risk carefully and only invest what you can afford to lose. Stay cautious and watch for confirmation before entering any positions.
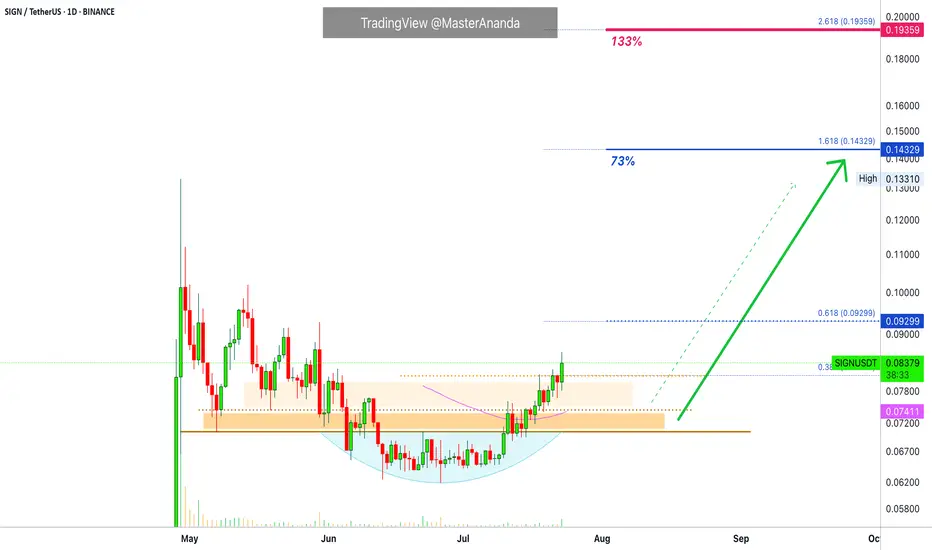
Sign · Same Chart, Same Pattern, Easy Profits · 133% PotentialThe same chart, the same dynamics and the same highly profitable easy to win trading opportunity.
The main low happens 7-May. There are lower prices after this but this is the stop-loss hunt event. We know this based on the rounded bottom pattern.
SIGNUSDT is back above its 7-May low and also trading above EMA55 on a daily basis. Above EMA55 after hitting a major low is as bullish as it gets. On top of that, we can see slow and steady growth; remember, the build-up process that leads to a strong bullish wave.
Notice how each candle, each day, prices are climbing higher and higher. The strongest signal of all is price action. When prices are rising, that is all you need. Supported by a volume breakout and we have another chart setup that will produce profits short-term.
The exchange I am looking at allows up to 5X, but you can do spot; less risk and no stress. If something goes wrong, the worst case scenario is a long wait or a small loss. On the other hand, a mistake with leverage can mean losing your entire position. Which one do you prefer?
There is no right or wrong answer. Higher risk will translate into a higher potential for reward. A lower reward potential translates into less stress and less risk. Whatever you choose is up to you. It all depends on your personality, your capital, your trading style, the available tools and your goals.
I say, start small. If you can secure many small wins, eventually you will be able to handle the big ones. Only go big when you have experience securing the small trades.
If you are in a hurry to win big, then you might end up losing everything; over and over, again and again.
Avoid repeating the same mistakes. Learn from the Master.
Thanks a lot for your continued support.
Namaste.
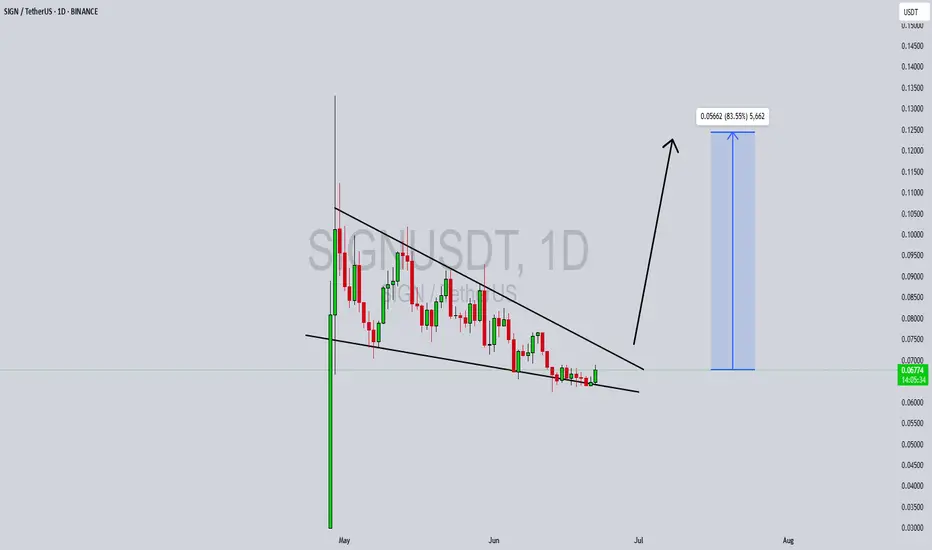
SIGNUSDT Forming Falling Wedge SIGNUSDT is currently forming a textbook Falling Wedge Pattern, a bullish chart formation that often signals the end of a downtrend and the start of a breakout rally. This pattern is becoming increasingly visible on the daily chart, with price action narrowing and volatility decreasing—setting the stage for a potential breakout. With consistent volume holding up during this consolidation phase, the conditions are aligning well for a strong move upward.
Technical traders will recognize that falling wedge breakouts are often accompanied by high-percentage gains, and in the case of SIGNUSDT, projections are targeting a 70% to 80% move to the upside. This bullish outlook is supported not only by the structure of the chart but also by the growing interest from retail and institutional investors who are gradually accumulating this asset at current levels. The breakout zone appears imminent, and traders are beginning to position accordingly.
Investor sentiment around SIGNUSDT is shifting, particularly as the broader altcoin market shows signs of recovery. The wedge formation suggests that bears are losing momentum while bulls are preparing for a push. This is often a precursor to aggressive price expansion once resistance is broken—potentially drawing in volume and market interest quickly. The risk-to-reward ratio here is favorable, especially for swing and breakout traders watching for emerging opportunities.
As more crypto assets begin to form bullish reversal setups, SIGNUSDT stands out as one of the most technically sound charts at the moment. Traders looking for well-defined entries based on proven patterns will find SIGNUSDT’s setup particularly appealing.
✅ Show your support by hitting the like button and
✅ Leaving a comment below! (What is You opinion about this Coin)
Your feedback and engagement keep me inspired to share more insightful market analysis with you!
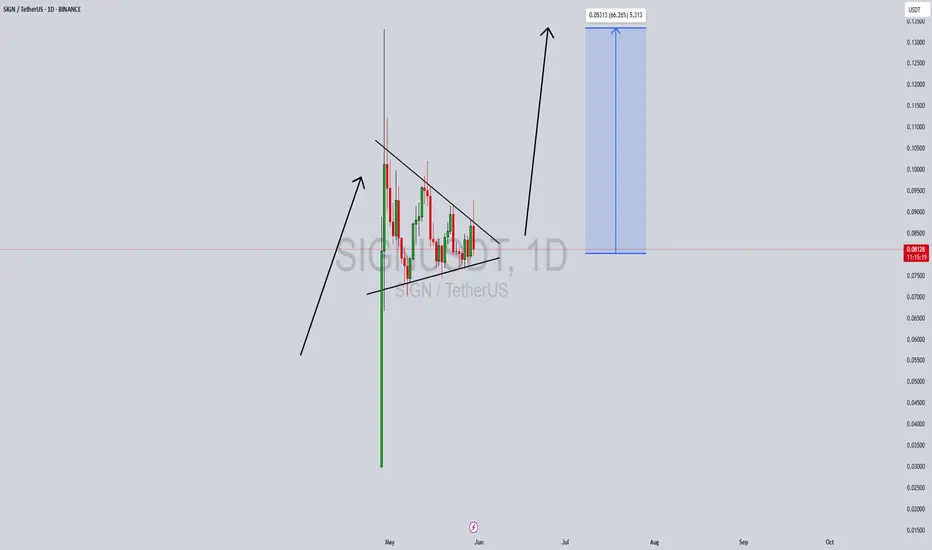
SIGNUSDT Forming Bullish Pennant SIGNUSDT is currently exhibiting a strong bullish pennant pattern on the daily timeframe—a continuation setup that often precedes substantial upward movement. Following an aggressive price surge, the pair has entered a brief consolidation phase within converging trendlines, suggesting that bulls are simply regrouping for the next leg higher. This is typically a bullish signal, especially when paired with increasing volume and positive sentiment surrounding the project.
The volume has remained healthy during the pennant formation, indicating sustained interest and participation from investors. With a clean technical structure and no major overhead resistance in the immediate zone, SIGN has positioned itself for a breakout move. Based on the height of the flagpole and the pattern formation, a price surge of 40% to 50% is anticipated, with targets aligning near the $0.13 zone. Such a move would mirror the breakout potential we’ve seen in similar setups across the altcoin market.
From a sentiment perspective, market participants have shown growing confidence in the SIGN project. Social mentions, trading volume, and overall engagement metrics are on the rise. This kind of grassroots enthusiasm often precedes strong rallies, and with Bitcoin and Ethereum holding steady, the stage may be set for altcoins like SIGN to shine. Technically and fundamentally, the alignment for an upward push appears to be falling into place.
Traders should watch for a clean breakout with volume confirmation above the resistance trendline. A decisive candle close above the pennant could act as a strong bullish catalyst. Risk management is key, but the risk-reward profile currently leans heavily in favor of the bulls.
✅ Show your support by hitting the like button and
✅ Leaving a comment below! (What is You opinion about this Coin)
Your feedback and engagement keep me inspired to share more insightful market analysis with you!
$SIGN - Long Trade IdeaBINANCE:SIGNUSDT | 4H
Entry: .085 to .084
DCA level/conservative entry: .082 to .080
Stoploss: just below .077
TPs:
.088 to .094
.102 to .106

SIGN/USDT – Bullish Breakout Alert!🚀 SIGN Breakout Alert – 80% Potential Incoming?! 👀🔥
Hey Traders! If you're all about high-conviction plays and real alpha, smash that 👍 and tap Follow for more setups that actually deliver! 💹💯
SIGN has just broken out from a symmetrical triangle after consolidating tightly for weeks. The breakout is supported by strong volume and a solid bounce from the base of the structure.
Entry: $0.082 - $0.085 (post-breakout zone)
Targets:
• $0.095
• $0.112
• $0.134
• $0.159
Stop-loss: Below $0.076
Risk-Reward: Over 6:1 — Excellent setup for trend traders.
This move could mark the beginning of a strong upside wave. Keep it on your radar and manage your risk accordingly!
Let me know your thoughts or if you're riding this one too!

$SIGN Waking Up — Breakout Looks CleanSIX:SIGN is waking up 👀
It broke out of the downtrend clean move above $0.09
That old resistance? Now acting as support. That’s a good sign.
Price is holding above the MA, buyers are in control.
Next stop? $0.105 to $0.12 range.
This could be just the beginning.
Keep it on your radar.
#ALTSEASON #GEM

Phemex Analysis #77: Pro Tips to Trade SIGN! SIGN token ( PHEMEX:SIGNUSDT.P ) has experienced a remarkable surge this week, gaining 60% in a short period as seen on the 1-hour chart. This surge has attracted significant investor attention, driven by SIGN's unique approach to cross-chain verification. Cross-chain verification addresses a critical challenge in the blockchain space: the secure and efficient transfer of data and assets between different blockchain networks. SIGN aims to streamline this process, enhancing interoperability and reducing the risks associated with cross-chain transactions. This innovative solution has positioned SIGN as a potentially valuable asset in the expanding multi-chain ecosystem, contributing to the recent price appreciation.
Possible Scenarios (1-hour Chart)
Given the recent surge and the volatility inherent in the cryptocurrency market, here are potential scenarios for SIGN token, focusing on the 15-minute timeframe:
1. Continuation of the Uptrend
If SIGN maintains strong buying pressure and volume, the uptrend observed could continue. This scenario suggests that the market is highly optimistic about SIGN's cross-chain verification technology.
Pro Tips:
Identify key resistance level, such as $0.10. If the price breaks out of this level, it would suggest the continuation of this uptrend.
Consider entering long positions on the breakout, with stop-loss orders below a recent low like $0.092.
Short-term profit targets include $0.109 & $0.125.
2. Short-Term Consolidation
Following the rapid price increase, SIGN may enter a period of consolidation on the 1-hour chart. This consolidation could be characterized by sideways price action within a defined range.
Pro Tips:
$0.105 might act as the upper boundary, and $0.09 might act as the lower boundary of the consolidation range.
Be patient and watch for a breakout from the consolidation range, which could signal the resumption of the uptrend or a trend reversal.
Use volume and breakout confirmation techniques to validate any breakout trades.
3. Rapid Price Correction
Given the sharp price increase, SIGN is vulnerable to a rapid price correction, especially if profit-taking occurs or negative news emerges.
Pro Tips:
Monitor for signs of weakening momentum, such as lower highs with lower lows, and RSI divergence.
Be prepared to exit long positions quickly if a correction begins.
Consider shorting opportunities if the price breaks below key support levels (such as $0.09) with strong volume, but manage risk carefully.
Conclusion
SIGN token's recent 60% surge, driven by its innovative cross-chain verification technology, has created short-term trading opportunities. Analyzing the 1-hour chart reveals potential scenarios, including a continued uptrend, short-term consolidation, and rapid price correction. Traders should employ appropriate risk management strategies, closely monitor price action and volume, and stay informed about any developments related to SIGN token and the broader cross-chain ecosystem.
Pro Tips:
Trade Smarter, Not Harder with Phemex. Benefit from cutting-edge features like multiple watchlists, basket orders, and real-time strategy adjustments. Our unique scaled order system and iceberg order functionality give you a competitive edge.
Disclaimer: This is NOT financial or investment advice. Please conduct your own research (DYOR). Phemex is not responsible, directly or indirectly, for any damage or loss incurred or claimed to be caused by or in association with the use of or reliance on any content, goods, or services mentioned in this article.

Breaking: $SIGN Coin Surge Nearly 40% Amidst Binance Listing The price of SIX:SIGN coin saw a 40% uptick today amidst Binance and numerous CEX listings.
Sign Protocol ( SIX:SIGN ) is an omni-chain attestation protocol that powers digital public infrastructure for governments and functions as a foundational layer for decentralized apps. 2) TokenTable: A smart contract-based platform for token distribution, including airdrops, vesting, and unlocks.
As of the time of writing, SIX:SIGN is up 24% according to the 15 minutes price chart SIX:SIGN has formed a bullish pennant pattern and a breakout above the ceiling of the wedge could resort to another legged-up for SIX:SIGN coin.
Further attesting to the bullish thesis is the RSI at 46, hinting at a build up momentum below the falling wedge that could spark the bullish breakout.
Sign Price Data
The Sign price today is $0.103050 USD with a 24-hour trading volume of $963,726,950 USD. Sign is up 37.58% in the last 24 hours. The current CoinMarketCap ranking is #307, with a market cap of $123,659,605 USD. It has a circulating supply of 1,200,000,000 SIGN coins and a max. supply of 10,000,000,000 SIGN coins.
