SILVER SENDS CLEAR BEARISH SIGNALS|SHORT
SILVER SIGNAL
Trade Direction: short
Entry Level: 3,640.9
Target Level: 3,428.8
Stop Loss: 3,781.9
RISK PROFILE
Risk level: medium
Suggested risk: 1%
Timeframe: 12h
Disclosure: I am part of Trade Nation's Influencer program and receive a monthly fee for using their TradingView charts in my analysis.
✅LIKE AND COMMENT MY IDEAS✅
Silver

Dollar on the move now after the news - as expectedQuick follow up on other videos
Dollar is heading strong towards our target as outlined for the last few weeks. If you followed all my videos you would see where markey technicals came into play the last few weeks
Beautiful read on this

SILVER Will Go Down! Short!
Take a look at our analysis for SILVER.
Time Frame: 9h
Current Trend: Bearish
Sentiment: Overbought (based on 7-period RSI)
Forecast: Bearish
The market is on a crucial zone of supply 3,622.4.
The oversold market condition in a combination with key structure gives us a relatively strong bullish signal with goal 3,483.8 level.
P.S
Please, note that an oversold/overbought condition can last for a long time, and therefore being oversold/overbought doesn't mean a price rally will come soon, or at all.
Disclosure: I am part of Trade Nation's Influencer program and receive a monthly fee for using their TradingView charts in my analysis.
Like and subscribe and comment my ideas if you enjoy them!

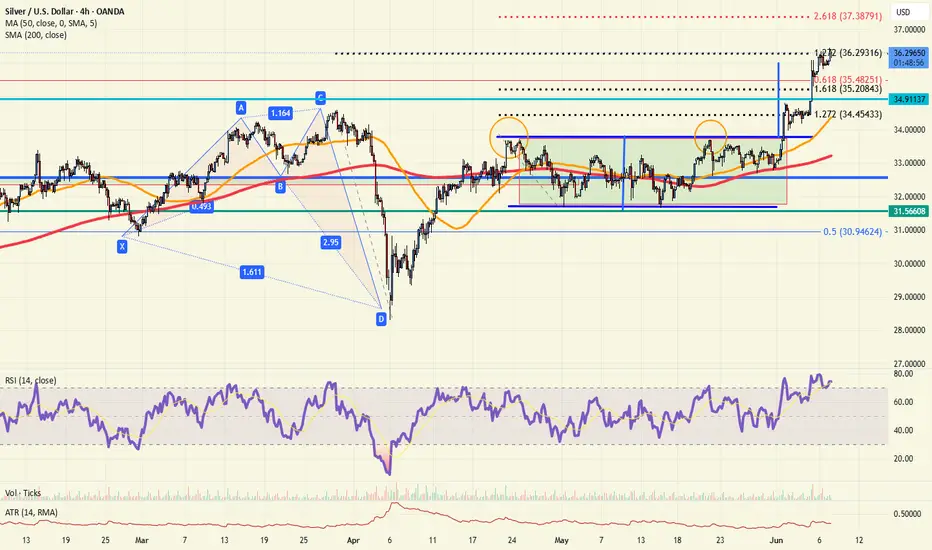
Silver Holds Near 13-Year HighsSilver has surged past the $36.40 per ounce mark, reaching its highest level in 13 years after a clean breakout from a one-month consolidation phase spanning April and May 2025. The breakout targets the $37 level and aligns with a rising channel defined by higher lows since February 2024.
If silver retraces below $36, potential support levels include $35.70, $35.30, and $34.70, which may offer a base for consolidation or a recharge before continuation of the broader uptrend. A sustained hold above $37.30 could open the path toward the $40 level, further validating a larger inverted head and shoulders pattern on the monthly chart.
Are we on track to revisit 2011 highs in 2025?
- Razan Hilal, CMT

Possible Bearish Idea on SilverSilver seems overbought on the daily timeframe and on the 15 mins we can see a bearish breakout forming, if trendline get broken sell Silver to the target zone around 34.800

SILVER: Strong Bullish Sentiment! Long!
My dear friends,
Today we will analyse SILVER together☺️
The price is near a wide key level
and the pair is approaching a significant decision level of 36.496 Therefore, a strong bullish reaction here could determine the next move up.We will watch for a confirmation candle, and then target the next key level of 36.646.Recommend Stop-loss is beyond the current level.
❤️Sending you lots of Love and Hugs❤️

Silver Bulls Breach Key Resistance – Momentum BuildsSilver (XAG/USD) has punched through a major horizontal resistance level around the psychological $35.00 mark, marking a significant technical breakout with bullish continuation potential.
🔍 Technical Highlights
Breakout Above Multi-Month Resistance: Price has cleanly broken above the key $35.00 zone, which had capped upside since late 2023. The breakout follows a tight consolidation range, suggesting a measured accumulation phase has ended.
Moving Averages Aligned Bullishly:
The 50-day SMA is rising sharply and sits well above the 200-day SMA.
Price is comfortably trading above both averages, confirming a strong uptrend structure.
MACD in Strong Positive Territory: MACD has surged above its signal line, reinforcing bullish momentum. No signs of a bearish crossover in sight.
RSI Enters Overbought Zone: RSI is currently near 70. While this signals strong momentum, it also raises the potential for short-term cooling or consolidation before any continued leg higher.
⚙️ Outlook
The breakout above $35.00 represents a major bullish development, potentially opening the door to further upside exploration. The impulsive nature of recent gains, combined with rising momentum indicators and trend-confirming moving averages, all favor the bulls. However, the overbought RSI suggests the possibility of a short-term pullback or sideways consolidation before the next move higher.
Traders may want to monitor for a potential retest of the $35.00 area as support, which could offer a higher-probability continuation setup within the broader uptrend.
-MW

Platinum 10 years accumulation 2 000 USD Overview of Catalysts
Here’s a detailed look at the top 10 key catalysts influencing platinum prices—and how they stack up on a 0–10 impact scale 🎯.
1. Supply Deficits (Mining Shortfalls) ⛏️
Trend: Persistent structural deficits—the largest since 2013—with a projected deficit of \~598 koz in 2024.
Drivers: Declining output in South Africa and Russia, underinvestment, and aging mines.
Impact Score: 10/10 – Direct upward pressure on price.
2. Industrial Demand & Green-Energy Growth 🏭
Trend: Industrial consumption is booming, with strong growth in sectors like wind turbines, glass, and electronics.
Support: This broad demand fuels a large part of the supply deficit, and goes well beyond automotive use.
Impact Score: 9/10 – Strong structural support.
3. Auto Catalyst Substitution (Pd → Pt) 🔄
Trend: Cost-effective substitution as platinum approaches price parity with palladium; significant volume was substituted in 2023, with more projected for 2024.
Significance: Boosts automotive demand in an area previously dominated by palladium.
Impact Score: 8/10.
4. Electric Vehicle Adoption (EVs) ⚡
Trend: EVs don’t use platinum in catalytic converters, which is a structural hit to demand as EV growth continues.
Significance: Long-term downside pressure.
Impact Score: 7/10.
5. Hydrogen Fuel Cell Demand 💧
Trend: Hydrogen vehicles use platinum, with projected demand growth toward 2030.
Limitations: Growth remains slower than battery EVs.
Impact Score: 6/10.
6. Recycling Constraints 🔄
Trend: Recycling, which provides about a quarter of supply, is falling due to fewer end-of-life vehicles and glass, reducing the supply buffer.
Market Effect: This amplifies supply tightness.
Impact Score: 6/10.
7. Chinese Emission Policies 🏭
Trend: China’s tightening emissions regulations are supporting demand, with end uses well protected against a slowdown.
Importance: China is the largest platinum user; policy gives stability.
Impact Score: 7/10.
8. Jewellery & Investment Trends 💍
Trend: Jewellery demand remains steady, and investment demand is rising.
Note: This is a smaller demand segment, but it is supportive.
Impact Score: 5/10.
9. Macroeconomic & Auto Production Outlook 📉
Trend: Weak global auto production is lowering platinum use, but recovery in auto could lift demand.
Aftermath: Economic rebound could support prices.
Impact Score:** 5/10.
10. Speculative Sentiment & Positioning 📈
Trend: Inventories are depleted; investors are waiting for a breakout.
Tipping Point: A price surge could spark momentum-driven demand.
Impact Score:** 4/10.
| Rank | Catalyst | Score (/10) |
| ---- | ---------------------------------- | ----------- |
| 1 | Supply Deficit | 10 |
| 2 | Industrial / Green-Energy Demand | 9 |
| 3 | Auto Catalyst Pd → Pt Substitution | 8 |
| 4 | EV Adoption (Negative Impact) | 7 |
| 5 | Chinese Emission Policies | 7 |
| 6 | Hydrogen Fuel Cell Growth | 6 |
| 7 | Recycling Constraints | 6 |
| 8 | Jewellery & Investment Demand | 5 |
| 9 | Macro Slowdowns / Auto Production | 5 |
| 10 | Speculative Positioning | 4 |
📌 Key Insights & Outlook
* Tight supply and diversified demand—especially from green energy and industrial sectors—are the strongest bullish forces for platinum.
* Auto-driven substitution offers further upside, while EV growth and recycling limitations act as constraints.
* Chinese regulations add resilience; hydrogen offers potential if growth accelerates.
* Jewellery and investment flows remain minor but supportive.
* Much depends on auto sector recovery and investor psychology—momentum effects could amplify gains if technical levels break.
🔮 Final Take
Platinum remains positioned for medium-term strength, thanks to severe supply tightness and robust non-auto demand drivers. For investors, key areas to watch are further deficits, industrial trends, and catalytic substitution. Be mindful of potential headwinds from EV adoption and macroeconomic softness, but the structural case remains compelling.

SPY/QQQ Plan Your Trade For 6-10 : POP PatternToday's POP pattern suggests a potential big price move will take place. Given the overnight activity on the ES (rallying higher then rolling over), I suggest today's price move may attempt to retest these overnight highs, then repeat the breakdown phase into the close.
The markets continue to try to melt upward. This trend will continue until the markets decide to break downward.
After the deep low created by the tariff news, the markets continue to try to rally to new highs. It is very likely that Q2 earnings data may push the SPY to new ATH levels before we see any big rotation in price.
The markets have a tendency to move just above recent highs, then stall and revert downward as a pullback. This move may be no different.
The continued stalling of price trying to move higher recently suggests the markets are running into moderate resistance and I believe traders are actively pulling capital away from this rally.
The trend is still BULLISH. Stay cautious of this upward move as a breakdown could happen at any time.
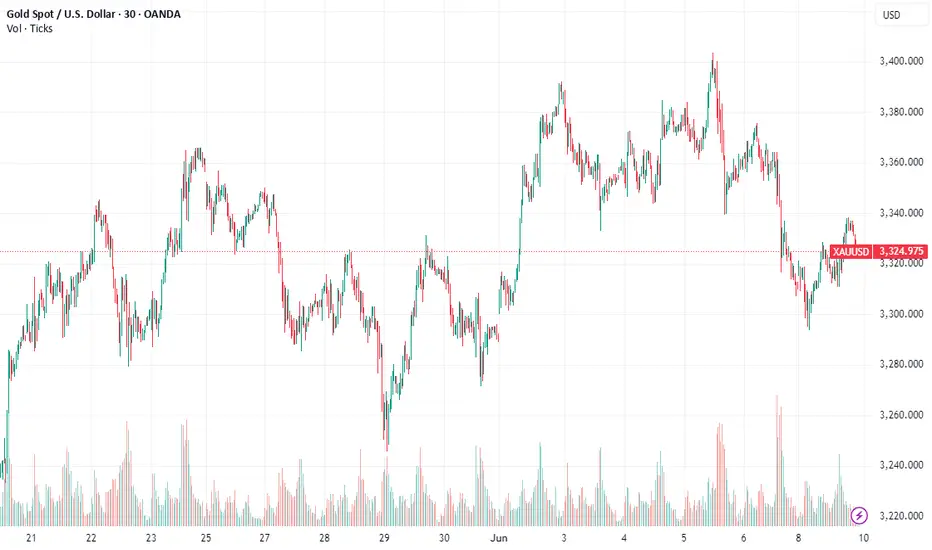
Gold and Silver are moving into an impressive rally phase. Silver and Platinum have moved considerably higher over the past 10+ days. I believe Gold is lagging and will make a big move higher over the next 5 to 10+ days.
Silver is targeting $41-44+. Gold should target $3400 to $3500+ near the same time.
Bitcoin made a huge rally yesterday - reaching my 110,500 upper resistance level. Now, we see if Bitcoin has the momentum to carry higher or if it will fail and rollover into a downtrend.
It seems we are right as a MAKE or BREAK level in the markets. I'm still a believer of MELT UP until it fails.
I continue to watch for technical failure - but I've not seen it happen yet.
Get some.
#trading #research #investing #tradingalgos #tradingsignals #cycles #fibonacci #elliotwave #modelingsystems #stocks #bitcoin #btcusd #cryptos #spy #gold #nq #investing #trading #spytrading #spymarket #tradingmarket #stockmarket #silver

Dollar Still on TargetWe have come back to the NFP high and last weeks high again. Stabbed through them but still below the order block as higlited last week before NFP.
Looking for a run lower now on USD.

XAGUSD H1 I Bearish Reversal off the 61.8% FibBased on the H1 chart, the price is approaching our sell entry level at 36.87, a pullback resistance that aligns with the 61.8% Fib retracement.
Our take profit is set at 36.37, an overlap support.
The stop loss is set at 36.87, a swing high resistance.
High Risk Investment Warning
Trading Forex/CFDs on margin carries a high level of risk and may not be suitable for all investors. Leverage can work against you.
Stratos Markets Limited (tradu.com ):
CFDs are complex instruments and come with a high risk of losing money rapidly due to leverage. 63% of retail investor accounts lose money when trading CFDs with this provider. You should consider whether you understand how CFDs work and whether you can afford to take the high risk of losing your money.
Stratos Europe Ltd (tradu.com ):
CFDs are complex instruments and come with a high risk of losing money rapidly due to leverage. 63% of retail investor accounts lose money when trading CFDs with this provider. You should consider whether you understand how CFDs work and whether you can afford to take the high risk of losing your money.
Stratos Global LLC (tradu.com ):
Losses can exceed deposits.
Please be advised that the information presented on TradingView is provided to Tradu (‘Company’, ‘we’) by a third-party provider (‘TFA Global Pte Ltd’). Please be reminded that you are solely responsible for the trading decisions on your account. There is a very high degree of risk involved in trading. Any information and/or content is intended entirely for research, educational and informational purposes only and does not constitute investment or consultation advice or investment strategy. The information is not tailored to the investment needs of any specific person and therefore does not involve a consideration of any of the investment objectives, financial situation or needs of any viewer that may receive it. Kindly also note that past performance is not a reliable indicator of future results. Actual results may differ materially from those anticipated in forward-looking or past performance statements. We assume no liability as to the accuracy or completeness of any of the information and/or content provided herein and the Company cannot be held responsible for any omission, mistake nor for any loss or damage including without limitation to any loss of profit which may arise from reliance on any information supplied by TFA Global Pte Ltd.
The speaker(s) is neither an employee, agent nor representative of Tradu and is therefore acting independently. The opinions given are their own, constitute general market commentary, and do not constitute the opinion or advice of Tradu or any form of personal or investment advice. Tradu neither endorses nor guarantees offerings of third-party speakers, nor is Tradu responsible for the content, veracity or opinions of third-party speakers, presenters or participants.

Silver surge has more bullish upsideSilver is breaking out. Its strength is no accident. The US is running a structural deficit north of 6% of GDP in a full-employment economy. The bond market has absorbed the pain so far, but pressure is building. Investors are starting to look for insurance. Silver is one of the cleanest ways to play the dollar’s long-term debasement.
The metal is trading well above its 200-day moving average. The US$31.50-32.00 zone now acts as solid support. Any pullback into that range is likely to be short-lived.
Silver doesn’t move in straight lines. It runs, consolidates, then runs again, usually in 50–90 day cycles. The current setup fits that rhythm.
The gold-to-silver ratio is still near 100x. Historically, the average is closer to 60-70x. That gives silver more room to catch up. Traders can short gold and go long silver to play that mean reversion. Or simply buy silver outright and short the dollar. ETF inflows into silver have picked up, showing broader market interest.
The main risk? A sudden shift in Fed tone or falling inflation expectations. But that seems unlikely near term.
Silver isn’t just a trade. It’s a message. A hedge against fiscal irresponsibility and the cost of kicking the can too far.


Silver & Gold Surge: SLV Inflows & GLD TargetsThe precious metals market is currently experiencing a significant surge, with both silver and gold capturing the attention of investors worldwide. This rally is underpinned by a confluence of factors, ranging from robust investment inflows into exchange-traded funds (ETFs) to evolving macroeconomic landscapes and persistent geopolitical uncertainties. The iShares Silver Trust (SLV) ETF has witnessed an unprecedented influx of capital, signaling a strong bullish sentiment for the white metal, while gold, represented by the GLD, is poised for a potential rebound, with analysts eyeing key price levels. Understanding the intricate dynamics driving these movements is crucial for anyone looking to navigate the contemporary financial markets.
SLV ETF Inflows Surge: Silver's Accelerated Rally
The iShares Silver Trust (SLV), the world's largest silver-backed exchange-traded fund, has recently recorded its most substantial inflows in years, marking a pivotal moment for the silver market. Last week alone, the SLV ETF saw weekly inflows surge by $451 million, a dramatic increase from previous weeks, pushing its year-to-date inflows to over $458 million and its total assets under management to more than $17 billion. This remarkable accumulation of capital into SLV signifies a profound shift in investor sentiment, reflecting a strong conviction that silver prices are set for continued appreciation. When investors pour money into an ETF like SLV, it directly translates into the fund acquiring more physical silver, thereby tightening supply and exerting upward pressure on prices. This massive inflow is not merely speculative; it indicates a broad-based belief among both institutional and retail investors in silver's potential.
Several key factors are fueling this accelerated rally in silver prices. One significant driver is the record-breaking surge in gold prices. Historically, silver has often been referred to as "poor man's gold" due to its similar safe-haven properties but lower price point. When gold experiences a substantial rally, silver often follows suit, as investors look for a more affordable alternative within the precious metals complex. Gold's recent ascent to nearly $3,500 per ounce has undoubtedly created a halo effect for silver, drawing in capital from those seeking exposure to precious metals without the higher entry cost of gold.
Another compelling reason for silver's outperformance is its perceived undervaluation relative to gold. The gold/silver ratio, which measures how many ounces of silver are needed to buy one ounce of gold, had peaked at around 106 when gold was surging. However, this ratio has since dropped significantly to around 92, indicating that silver has begun to catch up, suggesting it was previously undervalued. This rebalancing of the ratio has encouraged investors to shift their focus towards silver, anticipating further narrowing of the gap.
Beyond its role as a monetary metal and safe haven, industrial demand plays a uniquely critical role in silver's price dynamics, distinguishing it from gold. Silver is an indispensable component in numerous high-tech and green energy applications due to its exceptional electrical conductivity, thermal properties, and reflectivity. The renewable energy sector, particularly photovoltaic (PV) solar panels, consumes substantial amounts of silver, with each panel containing approximately 20 grams of the metal. The global push towards decarbonization and the increasing adoption of solar energy are creating an insatiable demand for silver. Additionally, its use in electric vehicles (EVs), electronics manufacturing, 5G technology, and medical devices further bolsters its industrial consumption. Reports indicate that global silver demand reached 1.2 billion ounces in 2024, driven by these industrial applications, with a significant supply deficit projected to continue. This robust and growing industrial demand provides a strong fundamental floor for silver prices, making it less susceptible to purely speculative swings.
Geopolitical tensions and economic uncertainties also contribute to silver's appeal as a safe-haven asset. In times of global instability, investors tend to flock to tangible assets like precious metals to preserve wealth. While gold typically garners more attention in such scenarios, silver also benefits from this flight to safety. The ongoing geopolitical developments and concerns about inflation continue to reinforce the attractiveness of both gold and silver as hedges against economic volatility and currency depreciation.
From a technical analysis perspective, silver's rally appears robust. The iShares Silver Trust (SLV) has broken above significant resistance levels, such as $31.75, which had previously acted as a ceiling. The ETF is trading well above its 50-day and 100-day Exponential Moving Averages (EMA), indicating a strong bullish trend. While the Relative Strength Index (RSI) has moved closer to overbought levels, the overall trend remains bullish, and the MACD indicator continues to signal upward momentum. Analysts suggest that if these technical indicators hold, silver could target the $40 mark in the near future. The breadth of participation from both institutional and retail investors, coupled with increasing trading volumes, suggests that this rally has stronger foundations than typical short-term spikes.
Furthermore, expectations of potential interest rate cuts by the US Federal Reserve are also providing tailwinds for precious metals. Lower interest rates reduce the opportunity cost of holding non-yielding assets like silver and gold, making them more attractive to investors. The anticipation of such policy shifts often prompts investors to front-run these decisions, leading to increased demand for precious metals.
GLD ETF Weekly Forecast: Gold's Rebound Potential
While silver commands attention with its recent surge, gold, represented by the GLD remains the cornerstone of the precious metals market. Gold recently hit record highs, touching nearly $3,500 per ounce, before experiencing a slight retreat due to profit-taking and some strengthening of the US Dollar. However, analysts are now forecasting a potential rebound, with a target of $3430 on the cards for the current week, indicating that the bullish sentiment for gold remains largely intact.
GLD is influenced by a diverse array of factors, making its price movements complex yet predictable to those who understand its drivers. One of the primary factors is gold's status as a safe-haven asset. During periods of economic uncertainty, political instability, or market volatility, investors traditionally turn to gold to preserve capital. Recent geopolitical tensions, such as the ongoing conflict in Eastern Europe, have consistently driven inflows into gold, as it acts as a hedge against global crises.
The strength or weakness of the US Dollar plays a crucial role in gold's price. Gold is primarily priced in US Dollars, meaning that a weaker dollar makes gold comparatively cheaper for buyers holding other currencies, thereby increasing demand and pushing prices up. Conversely, a stronger dollar can make gold more expensive, potentially dampening demand. While there has been some recent dollar strength, the overall sentiment regarding the dollar's long-term trajectory and its inverse relationship with gold remains a key determinant.
Interest rates and monetary policy, particularly from the US Federal Reserve, significantly impact gold prices. As a non-yielding asset, gold becomes less attractive when interest rates are high, as investors can earn better returns from interest-bearing assets. Conversely, lower interest rates reduce the opportunity cost of holding gold, making it more appealing. The anticipation of future rate cuts by central banks often provides a strong impetus for gold rallies.
Inflation and deflationary pressures also influence gold's appeal. Gold is widely regarded as a hedge against inflation. When the purchasing power of fiat currencies erodes due to rising inflation, investors often turn to gold to protect their wealth. Conversely, in deflationary environments, gold's appeal as a store of value can also increase. Recent inflation data, such as the Consumer Price Index (CPI) and Producer Price Index (PPI), are closely watched for their potential impact on gold's trajectory.
Central bank reserves and their purchasing trends are another significant, albeit often overlooked, factor. Central banks globally hold gold as a reserve asset to diversify their portfolios and safeguard against financial turmoil. Increased gold purchases by central banks signal a broader institutional confidence in gold and can significantly impact its demand and price.
Supply and demand dynamics in the physical gold market, including mining production, recycling, and demand from jewelry and industrial sectors, also play a role. While new supply from mining is relatively small compared to the total existing stock, changes in production levels can still influence prices. Investment demand through ETFs and other financial products further contributes to the overall demand picture.
From a technical standpoint, gold's recent retreat from its $3,500 peak has led to some profit-taking. However, key support levels are being tested, and analysts are looking for a rebound. The immediate resistance levels are around $3340-$3345, with a more significant hurdle at $3400. A decisive break above these levels, particularly $3400, could pave the way for a retest of the $3430 mark and potentially higher, towards $3500 and even $3600. The current bias for gold remains bullish, with buying opportunities identified at key pivot levels. The market is closely watching economic reports, such as the upcoming CPI data, as well as geopolitical developments, which could act as catalysts for gold's next major move.
The Interplay Between Gold and Silver
The intertwined fortunes of gold and silver are a recurring theme in the precious metals market. While both are considered safe-haven assets, their individual characteristics lead to nuanced differences in their price drivers. Gold is predominantly viewed as a monetary asset and a store of value, making it highly sensitive to macroeconomic indicators, interest rates, and geopolitical stability. Silver, while sharing these attributes, also benefits significantly from its extensive industrial applications. This dual nature often makes silver more volatile than gold, as it reacts to both investment demand and industrial cycles.
The recent outperformance of silver, as evidenced by the massive SLV ETF inflows, suggests a market correction where silver is catching up to gold's earlier gains. The narrowing gold-silver ratio indicates that investors believe silver was undervalued and is now reasserting its true worth. This dynamic creates a powerful feedback loop: as gold rallies, it draws attention to the precious metals sector, prompting investors to look for relative value, which often leads them to silver. As silver then accelerates, it further validates the strength of the broader precious metals market.
The current environment, characterized by persistent inflation concerns, ongoing geopolitical tensions, and the global push towards green energy technologies, provides a fertile ground for both gold and silver. Gold offers a traditional hedge against uncertainty, while silver provides exposure to both safe-haven demand and the booming industrial sector. The significant institutional inflows into SLV underscore a growing recognition of silver's unique position at the intersection of finance and industry.
In conclusion, the precious metals market is currently in a robust uptrend, driven by a powerful combination of investment demand, safe-haven appeal, and fundamental industrial growth. The unprecedented inflows into the SLV ETF signal a strong bullish outlook for silver, fueled by its undervaluation relative to gold and its critical role in emerging green technologies. Concurrently, gold, despite recent fluctuations, maintains a strong bullish bias, with analysts forecasting a rebound to key price levels, supported by its enduring safe-haven status and macroeconomic tailwinds. For investors, understanding these intertwined dynamics and monitoring key economic and geopolitical developments will be paramount in capitalizing on the ongoing rally in both gold and silver. The message is clear: the precious metals are shining bright, and their current momentum suggests further upside potential.
SILVER: Absolute Price Collapse Ahead! Short!
My dear friends,
Today we will analyse SILVER together☺️
The in-trend continuation seems likely as the current long-term trend appears to be strong, and price is holding below a key level of 36.640 So a bearish continuation seems plausible, targeting the next low. We should enter on confirmation, and place a stop-loss beyond the recent swing level.
❤️Sending you lots of Love and Hugs❤️

SPY/QQQ Plan Your Trade For 6-9: Inside BreakawayToday's pattern suggests the SPY/QQQ will attempt to make a breakaway type of price move - away from Friday's open-close range.
Given the fairly tight opening price level this morning, I would stay cautious in early trading today and try to let the first 60 minutes play out - looking for that breakaway trend/momentum.
Overall, the markets are still in a Bullish price phase - trying to push higher.
But, as I continue to warn, I believe the markets could rollover and break downward at any time.
BTCUSD moved substantially higher overnight. This could be the beginning of a bigger advance higher. But, it could also be an exhaustion move higher.
Gold and Silver are still melting upward. This move in metals recently certainly shows the markets are still fearful of any potential downside price activity.
Again, I urge traders to stay cautious as we continue to struggle within the sideways price range.
Price will show us what it wants to do and I believe this move higher in BTCUSD could be a false type of breakout move to the upside.
Get some.
#trading #research #investing #tradingalgos #tradingsignals #cycles #fibonacci #elliotwave #modelingsystems #stocks #bitcoin #btcusd #cryptos #spy #gold #nq #investing #trading #spytrading #spymarket #tradingmarket #stockmarket #silver

Silver breakout: Bullish, but divergentIntraday Update: Silver is at the 127% extension of the March 28th highs to April 7th lows, RSI is divergent which may stall the rally, but dips back to the 35.50 level should find buyers now.
Keep in mind we trade well above the long term 61.8% retracement still at 35.48
Dollar - Still going for TargetAs mentioned in the video on Friday 2 min before NFP. We could run higher on the dollar and i didnt want it to take out the 4 hour candle as shown here.
Go back and see the video for reference. Link below
We should head towards the Target now and im still bearish dollar. Very Bearish

Natural Gas | Oil | Dollar | Silver | Gold Price Forecast.Natural Gas | Oil | Dollar | Silver | Gold Price Forecast.
OANDA:XAGUSD COMEX:SI1! NYMEX:NG1! COMEX:GC1!

SILVER: Short Signal with Entry/SL/TP
SILVER
- Classic bearish formation
- Our team expects pullback
SUGGESTED TRADE:
Swing Trade
Short SILVER
Entry - 35.980
Sl - 36.467
Tp - 34.940
Our Risk - 1%
Start protection of your profits from lower levels
Disclosure: I am part of Trade Nation's Influencer program and receive a monthly fee for using their TradingView charts in my analysis.
❤️ Please, support our work with like & comment! ❤️

SILVER Set To Fall! SELL!
My dear friends,
Please, find my technical outlook for SILVER below:
The price is coiling around a solid key level - 35.598
Bias - Bearish
Technical Indicators: Pivot Points Low anticipates a potential price reversal.
Super trend shows a clear sell, giving a perfect indicators' convergence.
Goal - 34.911
Safe Stop Loss - 36.515
About Used Indicators:
The pivot point itself is simply the average of the high, low and closing prices from the previous trading day.
Disclosure: I am part of Trade Nation's Influencer program and receive a monthly fee for using their TradingView charts in my analysis.
———————————
WISH YOU ALL LUCK

Silver Rising on Weak Dollar, Soft NFP, and Gold StrengthSilver continues to push higher, driven by a combination of macro and technical tailwinds. The latest US Nonfarm Payrolls (NFP) report showed weaker-than-expected job growth, reinforcing expectations that the Federal Reserve may stay on hold or even tilt dovish. As a result, the Dollar extended its slide, providing a strong tailwind for precious metals.
Gold remains firm near record highs, and Silver is starting to catch up, gaining momentum both as a safe-haven asset and an industrial metal. The weaker Dollar environment boosts Silver’s appeal, while softer labor data raises hopes for looser financial conditions ahead.
Equity markets are also rising, reflecting a positive outlook on economic growth and demand. This supports the industrial side of silver, especially with rising consumption in solar, electronics, and EV-related industries.
Technically, silver is testing resistance near USD 37.50. A clean break above this level could open the path toward USD 39.00 and beyond. While RSI suggests short-term overbought conditions based on the daily chart, dips toward USD 35.00 – 36.00 would likely attract buyers.
The combination of soft US data, weaker Dollar, strong Gold performance, and firm equity markets points to sustained upside potential. Watch for follow-through above USD 37.50 to confirm the next bullish leg.

SILVER (XAGUSD): Where is the Next Resistance?!
What a rally on Silver this week.
The market easily violated a resistance cluster
based on the last year high.
Analyzing a historic price action, the next strong resistance
that I found is around 37.4
It is based on an important high of 2012.
That can be the next mid-term goal for the buyers.
❤️Please, support my work with like, thank you!❤️
