SILVER: Move Down Expected! Short!
My dear friends,
Today we will analyse SILVER together☺️
The recent price action suggests a shift in mid-term momentum. A break below the current local range around 36.190 will confirm the new direction downwards with the target being the next key level of 35.901.and a reconvened placement of a stop-loss beyond the range.
❤️Sending you lots of Love and Hugs❤️
Silver

SILVER BUY BUY BUY...TARGET 40Silver price rose to multiyear high today morning at $36.35/oz as the price finally closed above its key resistance of 35.05-35.45. Price is in a strong bullish trend to target the upper trendline of yellow ascending channel at 36.75 which will act as temporary resistance and may trigger a pull back towards 35.50 region before bouncing back.
Stability above 35.05-35.45 will send price soaring towards 37.50 followed by 40.00-41.00 region.
Break below 35.05 will trigger correction towards 33.60-34.20 area.
On medium term basis Silver's bullish trend will remain valid till the price is stable above 33.60. Break and stability below 33.60 will send the price towards 32.70, 31.80 and 29.20 levels.

Bitcoin Breaks below $102,500 Support : Watch For RejectionIf you have been following my research on Bitcoin, you already know I published a prediction of a Double-Top pattern and a potential breakdown in Bitcoin on May 20, 2025.
TradingView selected this video as an Editor's Pick and it received thousands of views.
Thank you for all the great comments and questions from everyone.
Now, after about 3+ Weeks, we are starting to see BTCUSD move below my $102,500 support level (my breakdown level) and this could be the start of a broad downward price phase for BTCUSD and US/Global assets.
If you have followed any of my longer-term research, you'll quickly understand why I believe the US markets will struggle through most of 2025 as the world attempts to adjust to Trump leadership. This uncertainty will likely result in a sideways-consolidation phase in many global markets and a disruption of hard and soft assets.
In this regard, you can read the content of my original post (May 20).
Right now, I want to warn you that an immediate price rejection of the breakdown move is likely - possibly targeting $105k or higher.
This type of rejection is very common before price makes a much bigger move. So, be prepared for BTCUSD to attempt to reject and move back above $105k, then stall and break downward very hard - trying to move below $80k in an initial downward price phase.
It's going to be very interesting to see how this plays out with my broad cycle research. I'm still expecting a July 2025 and October 2025 MAJOR LOW cycle phase to play out.
Buckle up.
Get some
#trading #research #investing #tradingalgos #tradingsignals #cycles #fibonacci #elliotwave #modelingsystems #stocks #bitcoin #btcusd #cryptos #spy #gold #nq #investing #trading #spytrading #spymarket #tradingmarket #stockmarket #silver

SILVER MASSIVE BULLISH BREAKOUT|LONG|
✅SILVER is trading in an uptrend
And the price made a massive
Bullish breakout of the key horizontal
Level of 34.80$ and the breakout
Is confirmed which reinforces
Our bullish bias and we will
Be expecting a further
Bullish move up
LONG🚀
✅Like and subscribe to never miss a new idea!✅
Disclosure: I am part of Trade Nation's Influencer program and receive a monthly fee for using their TradingView charts in my analysis.

SILVER: The Market Is Looking Up! Long!
My dear friends,
Today we will analyse SILVER together☺️
The in-trend continuation seems likely as the current long-term trend appears to be strong, and price is holding above a key level of 35.467 So a bullish continuation seems plausible, targeting the next high. We should enter on confirmation, and place a stop-loss beyond the recent swing level.
❤️Sending you lots of Love and Hugs❤️

Gold turns lower despite big silver breakoutGold has turned lower on the day, slipping after it failed to hold above the key $3400 resistance level. Despite a major breakout in silver, gold couldn't ride the wave, turning negative as risk sentiment improved on news of a "very positive" Trump-Xi call and renewed US-China trade talks.
The move also came alongside firmer commodity currencies and a rebound in USD/JPY, adding further pressure on the yellow metal.
Technically, yesterday’s inside bar low at $3343 is now the immediate bearish target, with further downside potential toward the $3320–$3330 support zone. If the recent swing low near $3250 breaks, bulls could be in real trouble.
By Fawad Razaqzada, market analyst with FOREX.com

SPY/QQQ Plan Your Trade For 6-5 : Inside BreakawayToday's SPY Cycle Pattern is an Inside Breakaway pattern - which indicates the markets want to try to break away from the sideways range I've been sharing with you.
Gold and Silver are making a very big move higher this morning - which may be indicative of some crisis or military conflict move throughout the world.
I see this move in Metals as a bit of a warning to the global markets. Metals hedge global risk levels. A rise in metals suggests traders fear some crisis event and are banking on Silver/Gold as an efficient hedge.
BTCUSD is still trading within the sideways channel as well. I see BTCUSD less as a hedge and more as a technology/Block-chain asset. No matter how you slice it, BTCUSD is not really an alternate currency, it is a Technology asset.
We could see some big moves over the next 2-5+ days because of how the markets are setting up and how Gold/Silver are reacting.
Buckle Up.
Get Some.
#trading #research #investing #tradingalgos #tradingsignals #cycles #fibonacci #elliotwave #modelingsystems #stocks #bitcoin #btcusd #cryptos #spy #gold #nq #investing #trading #spytrading #spymarket #tradingmarket #stockmarket #silver

SILVER – The Technicals Are Clear, The Fundamentals Are LoudEntry: $32.978
Current Price: $34.52
Target: Still in play, short-term and long-term upside remain
Technical Outlook:
Silver has maintained bullish structure after a clean breakout from the $32.9 zone.
- Higher lows continue
- Bullish momentum intact
- Watching $35 as next key psychological level
- Break & retest = next leg up
Short-term resistance at $35.20, if price holds above this zone, I expect continuation toward $38–40.
Long-Term Price Forecasts:
- Investing Heaven: $48–50 by 2025, up to $75 by 2027
- JPMorgan / Citi: $38–40
- Fixed supply vs. growing demand = long-term bullish imbalance
Why Silver Could Outperform (Fundamentals):
AI Boom → High silver usage in electronics
Green Energy → Critical in solar panels & EVs
Industrial Demand ⬆ while supply remains capped
This is more than a chart pattern, it’s a macro thesis with technical validation.
Trading Psychology Insight:
Most traders get shaken out before the move completes.
The real challenge isn’t spotting the setup, it’s holding through the noise.
Patience is a position.
Discipline is your edge.
I’m still holding not from hope, but from trust in my process.
Levels I’m Watching:
Break of $35 with volume = bullish confirmation
Failure to hold = possible retest near $33.8–34 zone
Long-term: Gradual climb with dips to accumulate
Agree? Disagree? Let’s talk in the comments.
If you want me to post the next phase of this trade with updates + psychology notes, drop a "Comment"

XAGUSD H4 I Bullish Bounce Off Based on the H4 chart analysis, the price is falling toward our buy entry level at 33.61, a pullback support.
Our take profit is set at 34.71, a pullback resistance.
The stop loss is placed at 32.60, a swing low support.
High Risk Investment Warning
Trading Forex/CFDs on margin carries a high level of risk and may not be suitable for all investors. Leverage can work against you.
Stratos Markets Limited (tradu.com ):
CFDs are complex instruments and come with a high risk of losing money rapidly due to leverage. 63% of retail investor accounts lose money when trading CFDs with this provider. You should consider whether you understand how CFDs work and whether you can afford to take the high risk of losing your money.
Stratos Europe Ltd (tradu.com ):
CFDs are complex instruments and come with a high risk of losing money rapidly due to leverage. 63% of retail investor accounts lose money when trading CFDs with this provider. You should consider whether you understand how CFDs work and whether you can afford to take the high risk of losing your money.
Stratos Global LLC (tradu.com ):
Losses can exceed deposits.
Please be advised that the information presented on TradingView is provided to Tradu (‘Company’, ‘we’) by a third-party provider (‘TFA Global Pte Ltd’). Please be reminded that you are solely responsible for the trading decisions on your account. There is a very high degree of risk involved in trading. Any information and/or content is intended entirely for research, educational and informational purposes only and does not constitute investment or consultation advice or investment strategy. The information is not tailored to the investment needs of any specific person and therefore does not involve a consideration of any of the investment objectives, financial situation or needs of any viewer that may receive it. Kindly also note that past performance is not a reliable indicator of future results. Actual results may differ materially from those anticipated in forward-looking or past performance statements. We assume no liability as to the accuracy or completeness of any of the information and/or content provided herein and the Company cannot be held responsible for any omission, mistake nor for any loss or damage including without limitation to any loss of profit which may arise from reliance on any information supplied by TFA Global Pte Ltd.
The speaker(s) is neither an employee, agent nor representative of Tradu and is therefore acting independently. The opinions given are their own, constitute general market commentary, and do not constitute the opinion or advice of Tradu or any form of personal or investment advice. Tradu neither endorses nor guarantees offerings of third-party speakers, nor is Tradu responsible for the content, veracity or opinions of third-party speakers, presenters or participants.

SILVER: Bears Are Winning! Short!
My dear friends,
Today we will analyse SILVER together☺️
The price is near a wide key level
and the pair is approaching a significant decision level of 34.443 Therefore, a strong bearish reaction here could determine the next move down.We will watch for a confirmation candle, and then target the next key level of 34.354..Recommend Stop-loss is beyond the current level.
❤️Sending you lots of Love and Hugs❤️

SPY/QQQ Plan Your Trade For 6-3 : Carryover in Carryover modeToday's pattern suggests we may see more upward price consolidation/trending.
As many of you already know, I've been tracking the Excess Phase Peak pattern all the way up this incredible rally from the $480 lows on the SPY. In my opinion, we have moved into the "island" topping phase where price is struggling to break either upward or downward right now.
Currently, price seems to be attempting to break to the upside after yesterday's meltup. Today should be interesting because we could see solid REJECTION of yesterday's move with a big breakdown move. We'll see how things play out.
The SPY trend is still BULLISH based on my research. Thus, until and IF we get a breakdown, traders should continue to expect a MELT UP type of trend in the SPY/QQQ.
Hedging trades is a good idea right now.
Gold and Silver had a big move early this week and have not stalled into a sideways FLAGGING trend. By my estimates, the APEX of the flag will come near 1900-2100 today (Wednesday 6-3). That is when I think Gold/Silver will attempt to move into extreme volatility and attempt to make another big move.
I hope it is to continue the upside price trend, as this breakout move needs to push higher (breaking recent highs) for metals to move into a new dominant upward price trend.
BTCUSD is trading sideways - possibly setting up that DOUBLE-TOP pattern I suggested was going to take place on 5-20-25. Now, with Bitcoin leading the US markets by about 3-5 days (on average), we'll see if BTCUSD can attempt to move into another rally phase or if BTCUSD breaks below the $103k level and moves into a new downward price phase.
In my opinion, look out below.
Get some.
#trading #research #investing #tradingalgos #tradingsignals #cycles #fibonacci #elliotwave #modelingsystems #stocks #bitcoin #btcusd #cryptos #spy #gold #nq #investing #trading #spytrading #spymarket #tradingmarket #stockmarket #silver

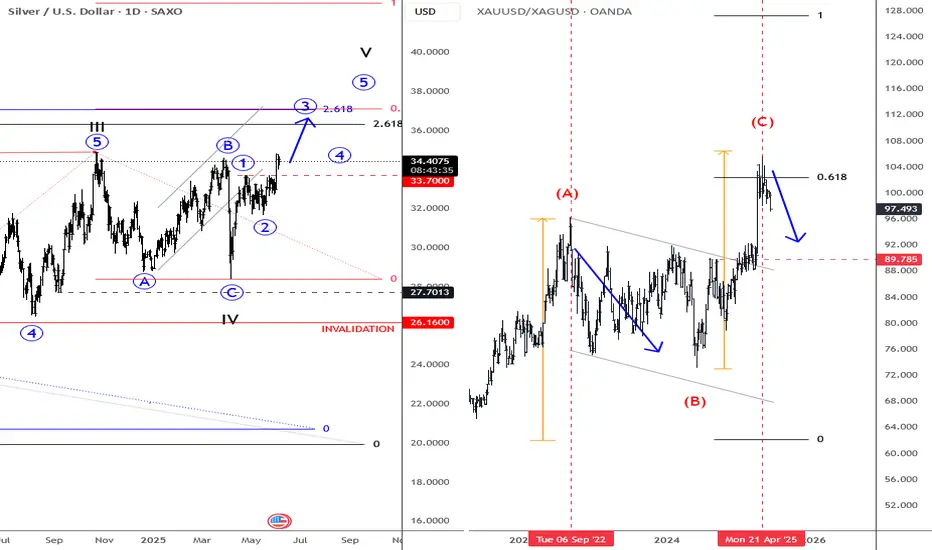
Silver ready to outperform Gold? Finally, silver is breaking to the upside out of the April–May consolidation, and so far there’s been a strong push above the 33.70 resistance, and with the market closing well above that level, it confirms that bulls remain in control and could stay in charge after any near-term dips. Ideally, we are now in the third leg of recovery, which could extend beyond the October 2024 highs around 34.87. Once that level is cleared, the third leg may continue higher within a higher degree wave five, possibly targeting the 36–37 zone.
At the same time, we also see the gold-silver ratio coming down from the 61.8% area, which is another signal suggesting the metals are in a broader bull run, with silver now likely to outperform gold until those 36–37 targets are reached.
Grega
SILVER Will Go Up! Buy!
Take a look at our analysis for SILVER.
Time Frame: 10h
Current Trend: Bullish
Sentiment: Oversold (based on 7-period RSI)
Forecast: Bullish
The market is testing a major horizontal structure 3,324.9.
Taking into consideration the structure & trend analysis, I believe that the market will reach 3,432.4 level soon.
P.S
The term oversold refers to a condition where an asset has traded lower in price and has the potential for a price bounce.
Overbought refers to market scenarios where the instrument is traded considerably higher than its fair value. Overvaluation is caused by market sentiments when there is positive news.
Disclosure: I am part of Trade Nation's Influencer program and receive a monthly fee for using their TradingView charts in my analysis.
Like and subscribe and comment my ideas if you enjoy them!

Dollar BearishAs per yesterdays video. We are still below the block highlited before the fact.
We still hunting the Target on Dollar as shown in the chart.

SILVER: Local Bullish Bias! Long!
My dear friends,
Today we will analyse SILVER together☺️
The price is near a wide key level
and the pair is approaching a significant decision level of 34.443 Therefore, a strong bullish reaction here could determine the next move up.We will watch for a confirmation candle, and then target the next key level of 34.575.Recommend Stop-loss is beyond the current level.
❤️Sending you lots of Love and Hugs❤️

SPY/QQQ Plan Your Trade For 6-3 : BreakAway In Trend ModeToday's pattern suggests the SPY/QQQ will attempt to move into a Breakaway type of pattern. I believe that Breakaway may be to the downside, but I could be wrong.
Price has been struggling in a sideways consolidated range over the past 2+ weeks. I believe this range sets up an "Island" type of price formation that is indicative of a topping type of pattern.
Currently, I'm tracking layers of different TA techniques to try to see how price may react in the future. Right now, price appears to be trapped within a range, has recently broken below the STDDEV channel, and may be moving into a very volatile FAILURE/REJECTION phase.
This is where price may attempt to resume trending (up or down) and I believe the move logical move is to the downside at this point.
Gold/Silver had a HUGE MOVE yesterday and are not contracting a bit. I still believe Metals will rally higher and attempt to break to new ATH levels.
BTCUSD is trapped in a sideways price range after reaching new ATH levels recently. Many of you are aware I'm expecting a rollover-top pattern to setup in BTCUSD (and the US markets) and I believe it is just a matter of time to see how the markets react to policies, news, and economic function/data.
Should be an interesting (possibly sideways) day today.
Get some.
#trading #research #investing #tradingalgos #tradingsignals #cycles #fibonacci #elliotwave #modelingsystems #stocks #bitcoin #btcusd #cryptos #spy #gold #nq #investing #trading #spytrading #spymarket #tradingmarket #stockmarket #silver

Silver on it's way to pass $40 Examining the technicals of the silver chart, the outlook for 2025 suggests that the silver price will likely surpass $40 within a few weeks and remain between $40 and $42 at the end of the year.

Silver - Short Term Buy IdeaM15 - Strong bullish move.
No opposite signs.
Currently it looks like a pullback is happening.
Expecting further continuation higher until the two Fibonacci support zones hold.
If you enjoy this idea, don’t forget to LIKE 👍, FOLLOW ✅, SHARE 🙌, and COMMENT ✍! Drop your thoughts and charts below to keep the discussion going. Your support helps keep this content free and reach more people! 🚀
--------------------------------------------------------------------------------------------------------------------
Disclosure: I am part of Trade Nation's Influencer program and receive a monthly fee for using their TradingView charts in my analysis.

SILVER BEARS ARE STRONG HERE|SHORT
SILVER SIGNAL
Trade Direction: short
Entry Level: 3,425.8
Target Level: 3,337.2
Stop Loss: 3,484.9
RISK PROFILE
Risk level: medium
Suggested risk: 1%
Timeframe: 3h
Disclosure: I am part of Trade Nation's Influencer program and receive a monthly fee for using their TradingView charts in my analysis.
✅LIKE AND COMMENT MY IDEAS✅

XAGUSD Analysis – Market Mapping Concept (MMC) + Target🧭 Overview:
Today's Silver price action presents a textbook example of how MMC can guide traders through:
Identifying the smart money accumulation phase.
Anticipating breakout momentum .
Locating key reversal areas based on previous liquidity maps and structural shifts.
We are currently observing Silver in the early stages of a structural retest after a breakout from consolidation. This gives rise to two powerful scenarios: either a bullish continuation after structure confirmation or a deeper retracement if the structure fails.
🔍 Detailed Chart Explanation:
🔷 1. Volume Contraction Phase
The market spent multiple sessions forming a symmetrical wedge, visible by narrowing price movement and consistent lower highs and higher lows.
This was accompanied by declining volume, signaling accumulation/distribution by institutional players.
The wedge served as a liquidity trap, drawing in both early shorts and longs before the true direction was revealed.
✅ MMC Principle: Volume contraction often precedes major breakouts as market makers build positions quietly.
🔷 2. SR Interchange – Breakout Confirmation
Price finally broke above the upper trendline, triggering a bullish impulse and confirming SR interchange (resistance turned support).
This move was backed by a strong bullish candle, showing aggressive participation and institutional involvement.
📌 This breakout candle set the tone for a structural shift—transforming from sideways to upward momentum.
🔷 3. Rapid Expansion Toward Previous Target Zone
After the breakout, price accelerated directly into a previous high (target) zone marked in blue.
According to MMC, this zone often acts as a liquidity magnet, where late buyers enter and professional traders take profits.
A rejection wick formed right after touching this zone—classic smart money behavior, catching retail traders chasing the move.
✅ MMC Principle: Prior highs/lows are not just resistance—they're engineered targets for liquidity collection.
🔷 4. Target + Reversal Area
After the rejection, price declined back into the Target + Reversal Zone. This area aligns with MMC’s ideal structure for potential buy-side re-accumulation.
This zone is where previous volume imbalances occurred, meaning it is likely to act as support if the bullish trend is to continue.
📊 Current price is consolidating within this zone, suggesting a possible bullish continuation if structure holds.
🔷 5. Structure Mapping – The Key to MMC
The most recent price reaction highlights the importance of structure mapping: identifying areas where market logic aligns with trader behavior.
The bearish pullback into the structure zone may complete a retest, and traders are watching closely for bullish confirmation.
⚙️ Technical Summary:
Key Zone Description
Volume Contraction Signals accumulation before breakout.
SR Interchange Breakout level where resistance turned to support.
Previous Target Zone Liquidity pool, ideal for institutional exits or reversal.
Target + Reversal Zone Demand zone where the trend may resume if confirmed.
Structure Mapping Current phase; price is aligning into new bullish structure or preparing for drop.
🧭 What to Watch Next:
🔹 Scenario A – Bullish Case:
Price holds within the Target + Reversal Zone.
Confirmation via bullish engulfing candle or breakout of lower high.
Target: retest of 34.80+, then potential extension to 35.20.
🔹 Scenario B – Bearish Case:
Breakdown below structure base at 33.85–34.00.
Could lead to a deeper correction toward 33.40 or 32.80 (previous volume node).
📌 Volume + Structure = Decision Point. Next few candles are crucial for validating direction.
🛠 Strategy & Execution:
Approach: Wait for confirmation candles before entering. Avoid reacting impulsively within the structure zone.
Entry Idea:
Buy on bullish confirmation in the reversal zone.
Place stop below structure invalidation.
Target the top of the previous target zone or higher.
Risk Management: Use tight SLs below 33.85 and scale in only on confirmation.
📅 Timeframe: 1H
🔭 Sentiment: Cautiously Bullish
🎯 Technique: MMC Structure Mapping + Volume-Based Targeting
🧠 Final Thoughts:
This XAGUSD chart showcases the predictive power of MMC when applied correctly. By understanding where smart money operates, traders can improve accuracy, timing, and risk control.
📌 If you found this analysis helpful, like and follow for daily insights. Drop your thoughts in the comments—do you trade MMC-style setups?

SPY/QQQ Plan Your Trade For 6-2 : Post Market UpdateHuge move for metals today. Absolutely incredible.
Hope you GOT SOME.
BTCUSD and the SPY/QQQ stalled somewhat flat today. SPY was up 0.50% - nothing huge.
Going to be interesting to see how things play out in the Asian/European markets tonight.
Buckle up. Could be some very big moves hitting this week.
GET SOME.
#trading #research #investing #tradingalgos #tradingsignals #cycles #fibonacci #elliotwave #modelingsystems #stocks #bitcoin #btcusd #cryptos #spy #gold #nq #investing #trading #spytrading #spymarket #tradingmarket #stockmarket #silver

SILVER: The Market Is Looking Down! Short!
My dear friends,
Today we will analyse SILVER together☺️
The market is at an inflection zone and price has now reached an area around 34.374 where previous reversals or breakouts have occurred.And a price reaction that we are seeing on multiple timeframes here could signal the next move down so we can enter on confirmation, and target the next key level of 33.902..Stop-loss is recommended beyond the inflection zone.
❤️Sending you lots of Love and Hugs❤️

Wheaton precious Metals can push on to $90It could be a HOT summer for the gold and silver bugs
And the speculators in the mining sector!
WPM ( formerly Silver Wheaton #SLW)
Has a broken out of a inverse head and shoulders
Two targets provided
Also important to note this inv head and shoulders is a continuation pattern not a bottom pattern.
