Beyond The Plan Your Trade Videos - Trading Algos/ConfirmationMany of you follow my morning Plan Your Trade videos - and I thank you for your loyalty and dedication.
The Plan Your Trade videos are specifically deigned to highlight my SPY/GOLD Cycle Patterns and, over the course of the past 9+ months, I've started trying to teach all of you Fibonacci Price Theory and the concept of the Excess Phase Peak pattern (and Cradle Pattern).
My goal is to teach you to learn to understand price structures, setups, and actions as a way to try to advance your technical analysis/trading skills.
There are so many others out there trying to teach you to use indicators and other types of analysis to try to identify trading opportunities/setups. Some work, some don't.
Technical analysis using Indicators, Elliot Wave, or other forms of predictive analysis/AI are only about 50-75% accurate at best (IMO). Nothing is 100% perfect.
After 35+ years of trying to unlock the secrets of price action to devise a 100% accurate trading system, the closest I have come is a system that generates about 65-75% accuracy - but still manages to take some losses.
I do believe I can find that 100% accurate system (hopefully before I die). But the reality is it is almost impossible to accurately predict price movement 10-20+ days in advance with any degree of accuracy.
Over the past few weeks/months, we've seen the SPY/QQQ move through various stages/phases.
Over the past 4+ weeks I've been warning of the broad-consolidation phase that is currently setup on the SPY/QQQ. I believe this huge consolidation range is very dangerous for traders and that extreme volatility will create lots of risk/opportunities for those capable of trading within this range.
But, at the same time, failing to take advantage of tools to help traders hedge, daytrade, or otherwise balance allocation/risk levels is something I really don't talk about much.
I like to say "I do the research - you make all the trading decisions".
This video highlights some of my advanced algos and how I use them, in conjunction with the EPP and other patterns, to try to gauge market opportunities vs. risks.
Trust me. I've learned not to GO BIG on trades over the past 20+ years because I've blown up a few accounts trying to get greedy.
Right now, I focus on trying to be on the right side of trends (if possible) and to balance my portfolio in 10-20% increments.
For example, if I believe GOLD is going to move higher, I may start out with a 5-10% allocation into GLD or UGL (start small). If that trade works and Gold starts to make a move higher, I may try to add a bit more to that initial trade. If it doesn't work out, I may try to add a little bit more at a better entry price level - but I focus on not letting that trade occupy more than 15-20% of my total portfolio.
That way, if I take a loss on the trade, it is a small loss compared to the overall account capital.
If I take a 50% loss on a 20% allocation - that is only a 10% loss on the TOTAL ACCOUNT SIZE.
Get it?
So, the reason for this video is to show you how you can still use technical strategies/indicators to try to confirm you intraday trading and swing trading opportunities. I like to use the SuperTrend strategy on charts to identify general trending.
I'm urging you to consider my Plan Your Trade videos as "one component" of your skillset. You need to use your own skills/techniques/analysis to try to manage risks vs. opportunities as you continue to trade.
I highlight some of my algos because they become another "component" of my analysis when I'm trading. If I don't see broad market capitulation related to Daily trending - then I try to stay VERY CAUTIOUS. If I do see some capitulation within my algos suggesting the markets are starting to trend upward or downward, then I may try to take advantage of that opportunity.
Ideally, the process of trading is to use everything you like and can rely on to help confirm you decision-making. Then, fall back to a efficient trade allocation process that attempts to limit your risk level.
The biggest mistake I see people make is to go ALL IN or TOO HEAVY into a trade thinking they can't lose. Yes, you can lose. So can I.
That's why it is important to contain risks and protect capital at all times.
I'll try to create another video showing you how I use the SuperTrend indicator to help confirm some of my intraday analysis for trades.
Get Some.
#trading #research #investing #tradingalgos #tradingsignals #cycles #fibonacci #elliotwave #modelingsystems #stocks #bitcoin #btcusd #cryptos #spy #gold #nq #investing #trading #spytrading #spymarket #tradingmarket #stockmarket #silver
Silver

Silver is Again in the Bullish directionHello Traders
In This Chart XAGUSD HOURLY Forex Forecast By FOREX PLANET
today XAGUSD analysis 👆
🟢This Chart includes_ (XAGUSD market update)
🟢What is The Next Opportunity on XAGUSD Market
🟢how to Enter to the Valid Entry With Assurance Profit
This CHART is For Trader's that Want to Improve Their Technical Analysis Skills and Their Trading By Understanding How To Analyze The Market Using Multiple Timeframes and Understanding The Bigger Picture on the Charts

SPY/QQQ Plan Your Trade For 5-8 : EPP & Cradle Pattern UpdateThis video highlights why I continue to stay very cautious of this upward price move in the US markets.
It also highlights that the current trend is BULLISH - not BEARISH. When I post the videos in the morning, I've been selecting BEARISH as the general trend because I believe the markets are going to roll over into a breakdown phase. Until that happens, though, the markets are in a BULLISH price trend - attempting to possibly break above the current Ultimate High.
This is more of an instructional video - trying to show you why I continue to urge caution related to trends and why I belive we may have many months to go before the US markets really start to make a bigger "exit trend" type of move (exiting this broad consolidation range).
The other thing this video should teach you is how to identify EPP and Cradle patterns more efficiently and how to use them.
Ultimately, everything I share with all of you is designed to help you understand price as the ultimate indicator.
If you can grasp these concepts and understand how each phase of price structure presents opportunities, then you should be able to time and execute your trades very efficiently.
As I've stated in the videos, because of family medical issues over the past 60+ days, I've moved away from daytrading and gone back to a 2-5+ week swing trading style.
Simply put, I'm driving all over the place taking care of my family, seeing doctors, and other stuff - so I can't stare at my PC/Phone while the markets are open.
I'm also taking very low risk trades. If I decide to get into a trade, I'm usually avoiding the SPY/QQQ and selecting some SPDR sector (or other ETF) that allows me to play the move I expect without risking a fortune doing it.
Anyway, I hope you enjoy this video. I'll probably create one more after this video posts.
Get some.
#trading #research #investing #tradingalgos #tradingsignals #cycles #fibonacci #elliotwave #modelingsystems #stocks #bitcoin #btcusd #cryptos #spy #gold #nq #investing #trading #spytrading #spymarket #tradingmarket #stockmarket #silver

SPY/QQQ Plan Your Trade For 5-8 : Carryover PatternToday's Pattern is a Carryover pattern in Carryover mode.
After yesterday's FOMC news (unchanged), the markets are seeking a bit of direction. Bitcoin rallied and INVALIDATED a EPP Flagging pattern. In my opinion this suggests the SPY/QQQ may attempt to move a bit higher after the Fed decision.
Although, I still believe the global markets are reacting to uncertainty and tariff news within a very broad consolidation range. So, I'm cautious of trying to go ALL-IN on any long trades at the moment.
Until we break clear of the consolidation range, price could break strongly to the downside on news or geopolitical content. In reality, any type of big news could prompt a downward price move within an uptrend or a consolidation range.
It just seems as though the current global market environment is fraught with uncertainty - so I continue to stay cautious.
Gold and Silver pulled downward overnight. But I still believe metals will continue to rally - attempting to hedge against global risks.
With Bitcoin rallying a bit higher (still in consolidation) - let's see how the next few days play out.
I would be surprised if BTCUSD and the SPY rallied to new highs before the end of May. VERY SURPRISED given the status of the global markets.
But, the markets can stay completely irrational much longer than I can try to fight them. So we have to move WITH the markets - not against them.
Get some.
#trading #research #investing #tradingalgos #tradingsignals #cycles #fibonacci #elliotwave #modelingsystems #stocks #bitcoin #btcusd #cryptos #spy #gold #nq #investing #trading #spytrading #spymarket #tradingmarket #stockmarket #silver

XAGUSD Multi-year Channel Up targeting $40 at least.Silver (XAGUSD) had a strong rebound on its April 07 2025 Low and that maintains the long-term bullish trend as not only did it kept clear of the 1W MA100 (green trend-line) but also rebounded on the long-term 1W RSI Support Zone.
This kept the 2.5-year Channel Up intact and the current structure looks very similar to late 2023 - early 2024 before the Resistance break-out. The Bullish Leg of this Channel Up have so far been identical (+48.93%) so if we repeat that, we can expect Silver to reach $42. We have a more modest Target at $40, which falls exactly at the top of the Channel Up.
-------------------------------------------------------------------------------
** Please LIKE 👍, FOLLOW ✅, SHARE 🙌 and COMMENT ✍ if you enjoy this idea! Also share your ideas and charts in the comments section below! This is best way to keep it relevant, support us, keep the content here free and allow the idea to reach as many people as possible. **
-------------------------------------------------------------------------------
💸💸💸💸💸💸
👇 👇 👇 👇 👇 👇

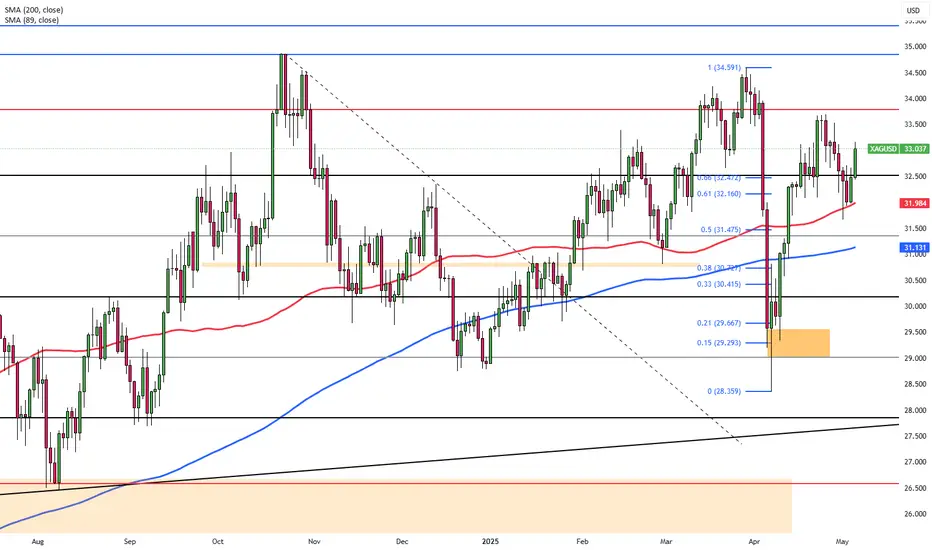
Silver Slips as Fed Holds RatesSilver rose more than 1% to approach the $33 mark on Thursday, supported by renewed interest on precious metals with ongoing trade and economic uncertainty. The Federal Reserve left interest rates unchanged, with Chair Powell citing heightened risks while dismissing the need for early rate cuts. Sentiment was also influenced by President Trump’s announcement of an imminent trade deal, reportedly with the UK, and his firm stance on maintaining tariffs against China ahead of upcoming negotiations.
Technically, resistance is seen at $33.80, followed by $34.20 and $34.85, while support levels are noted at $32.00, $31.40, and $30.20.

SPY/QQQ Plan Your Trade For 5-7 : Post FOMC UpdateThis video highlights a number of factors why I believe the markets are stalling and are likely to REVERT back to the 515-525 area on the SPY.
Without any real economic driving component, while tariffs and other concerns continue to play out, I believe the SPY will continue to search for Ultimate Support over the next 5-7+ months, then move into an upward reversion phase.
Part of what I'm trying to teach my followers is to try to understand how price operates in structures and phases.
Price only does two things: TRENDS or FLAGS
Within those phases, price structures (EPP, Cradle, and others) take over to determine how and why price may or may not attempt to make certain price moves.
Additionally, without any bias, or economic impetus (driver), price tends to REVERT.
In this video, I show you how to use the STDDEV channels to identify possible target areas for the different phases of market trend.
Ultimately, IMO, trading is about being able to see the price structure, phases, and path of least resistance (in terms of bias/expectations). This helps us position for the highest probability outcome (and hopefully for successful trades).
Remember, all of these techniques can be applied to intra-day charts the same way I'm applying them to Daily and Weekly charts.
Remember, price only does two things: TREND or FLAG.
Once you understand that, applying price structures/phases to price while it TRENDS or FLAGS helps you to gain a keen understanding of where price may target/move in the immediate future.
Hope this helps.
Get Some.
#trading #research #investing #tradingalgos #tradingsignals #cycles #fibonacci #elliotwave #modelingsystems #stocks #bitcoin #btcusd #cryptos #spy #gold #nq #investing #trading #spytrading #spymarket #tradingmarket #stockmarket #silver

When the SPX/Silver ratio breaks down, Silver goes on a bull runThis is due to money moving out of the stock market, with investors taking profits and looking towards making money in undervalued assets. Silver is incredibly undervalued when compared to stocks and even gold.

SPY/QQQ Plan Your Trade Video For 5-7 : Breakaway In CounterToday's Breakaway In Counter Trend mode suggests the markets will likely attempt to break downward before the end of trading, today. Why do I state the downward trend direction?
Because the LT/ST trends are BULLISH and the general upward price trend in the SPY over the past 5-10+ days.
Counter-trend patterns are typically inverted compared to the general 5-8 day price trend. If we can't clearly identify a 5-8 day price trend, then the counter-trend patterns should be determined based on the ST/LT and BIAS trend information on the SPY Cycle Patterns data window.
Today, being a FOMC comment day, should stay rather muted/sideways in early trading. Normally, on FOMC days, the markets tend to stay paused ahead of the FOMC comments.
I believe the FED will not raise or lower rates - meaning NO CHANGE. I don't believe the US Fed has any reason to be concerned with US economic performance right now.
Gold and Silver should move into a rally phase today - but that will likely come near the end of the day as the FED comments drive the markets.
BTCUSD has moved into an early FLAGGING formation. This could be very interesting as BTCUSD has been leading the SPY/QQQ by about 4-6 trading days over the past few weeks.
If BTCUSD continues to lead the SPY/QQQ - that means the SPY/QQQ would be in the early breakdown phase right now - moving into a FLAGGING formation possibly next week.
Get some.
#trading #research #investing #tradingalgos #tradingsignals #cycles #fibonacci #elliotwave #modelingsystems #stocks #bitcoin #btcusd #cryptos #spy #gold #nq #investing #trading #spytrading #spymarket #tradingmarket #stockmarket #silver

SILVER Is Going Up! Buy!
Here is our detailed technical review for SILVER.
Time Frame: 9h
Current Trend: Bullish
Sentiment: Oversold (based on 7-period RSI)
Forecast: Bullish
The market is approaching a significant support area 3,288.3.
The underlined horizontal cluster clearly indicates a highly probable bullish movement with target 3,391.4 level.
P.S
The term oversold refers to a condition where an asset has traded lower in price and has the potential for a price bounce.
Overbought refers to market scenarios where the instrument is traded considerably higher than its fair value. Overvaluation is caused by market sentiments when there is positive news.
Disclosure: I am part of Trade Nation's Influencer program and receive a monthly fee for using their TradingView charts in my analysis.
Like and subscribe and comment my ideas if you enjoy them!

SPY/QQQ Plan Your Trade For 5-6 : GAP Breakaway patternToday's pattern suggests a morning GAP will take place and price will continue to break away from yesterday's body range.
Given the fact that the markets are already almost 0.8-0.9% lower than yesterday's closing price level, this suggests the markets will continue to trend downward today.
Is this it? Is this the breakdown for May 2-5, seeking the Major Bottom I've talked about for the past 3+ weeks?
We'll find out over the next 5-10+ days.
Ultimately, the EPP patterns have aligned across multiple instruments/symbols to present a very clear opportunity to the downside. Now, we need to watch and wait as the markets should be moving into the early FLAGGING stage of the downward EPP pattern.
After the FLAGGING pattern, we should get the breakdown into consolidation, which is where I believe big profits can be made. That breakdown into the consolidation phase is usually very aggressive and can often be after the FLAGGING range.
Gold and Silver are making a move higher. I suggested this would be the case over the past 5-10+ days - but, boy, was it frustrating to watch Gold and Silver consolidate over the past few weeks.
At this point, I'm looking for Gold to rally above $3500 and for Silver to attempt to rally above $34.00.
Bitcoin seems to be leading the SPY/QQQ (again) and appears to be about 2-3 days ahead of the major US indexes, attempting to move into a downward FLAGGING formation.
This could be very interesting if BTCUSD continues to lead the SPY/QQQ. Meaning, we may be able to rely on the structures/setups in BTCUSD as a 2-3 day early window of that the SPY/QQQ may be doing (for a while). I'm sure it won't continue to align at some point in the future.
Again, I'm getting great comments from followers and subscribers. Thank you.
I'm doing my best to deliver the best research I can within these 15 to 20-min videos.
Get some.
#trading #research #investing #tradingalgos #tradingsignals #cycles #fibonacci #elliotwave #modelingsystems #stocks #bitcoin #btcusd #cryptos #spy #gold #nq #investing #trading #spytrading #spymarket #tradingmarket #stockmarket #silver

Silver - Short Term Sell Trade Update!!!Hi Traders, on April 30th I shared this idea "Silver - Expecting Retraces Before Prior Continuation Lower"
I expected retraces and further continuation lower until the two Fibonacci resistance zones hold. You can read the full post using the link above.
The bearish move delivered, as expected!!!
If you enjoy this idea, don’t forget to LIKE 👍, FOLLOW ✅, SHARE 🙌, and COMMENT ✍! Drop your thoughts and charts below to keep the discussion going. Your support helps keep this content free and reach more people! 🚀
-------------------------------------------------------------------------------------------------------------------
Disclosure: I am part of Trade Nation's Influencer program and receive a monthly fee for using their TradingView charts in my analysis.

SILVER BEST PLACE TO SELL FROM|SHORT
SILVER SIGNAL
Trade Direction: short
Entry Level: 3,305.2
Target Level: 3,164.4
Stop Loss: 3,398.5
RISK PROFILE
Risk level: medium
Suggested risk: 1%
Timeframe: 12h
Disclosure: I am part of Trade Nation's Influencer program and receive a monthly fee for using their TradingView charts in my analysis.
✅LIKE AND COMMENT MY IDEAS✅

XAG/USD Stable Ahead of Fed DecisionSilver (XAG/USD) held steady on Tuesday, underpinned by safe-haven demand as U.S. tariff tensions and global growth concerns persisted. Although the U.S. dollar saw a slight recovery, silver maintained its ground with markets focused on the upcoming Federal Reserve policy decision. Expectations for unchanged rates and possible future easing could continue to lend support to silver in the near term.
The first resistance is seen at $33.80, with higher levels at $34.20 and $34.85 if momentum builds. Support begins at $32.00, followed by $31.40 and $30.20.
Silver Analysis: Bearish Continuation Toward $31 Support ?🧠 Chart Context & Setup
Chart Type: Candlestick
Timeframe: Likely 4H or Daily
Indicators Used:
EMA 50 (Red) — 32.814
EMA 200 (Blue) — 32.559
🔍 Key Technical Levels
Resistance Zone: 33.600 – 33.950
Price faced repeated rejection in this zone, confirming it as a valid supply/resistance area.
Support Zone: 30.600 – 31.100
Marked as the next potential demand zone, aligning with previous accumulation and reaction levels.
Current Price: ~32.618
Just below the 50 EMA and slightly above the 200 EMA.
🔄 Market Structure
The market experienced a strong bearish impulse in early April, followed by a bullish correction that reclaimed the 200 EMA.
Multiple internal liquidity (INT.LQ) sweeps were taken before forming a potential lower high (LH) at the resistance zone.
The recent bearish move broke below the EMAs and previous structure, indicating a possible shift back to bearish momentum.
📉 Bearish Scenario Outlook (Most Probable as of Now)
The chart shows a projected lower high formation, likely leading into a continuation of the bearish move.
If price fails to break back above 32.800–32.900, we could expect a sell-off toward the support zone (30.600–31.100).
This move aligns with:
Breakdown below EMAs
Failed bullish continuation
Rejection from a strong resistance zone
🧭 EMA Analysis
EMA 50 > EMA 200, but the price is now sandwiched and showing signs of weakness.
If price sustains below both EMAs, momentum is likely to favor bears in the short to medium term.
⚠️ Risk Factors to Watch
Any strong bullish engulfing candle reclaiming the 33.000 zone could invalidate the bearish thesis.
Fundamentals like USD volatility, inflation data, or geopolitical tension could impact Silver drastically.
✅ Conclusion
The chart currently suggests a bearish continuation setup, with the potential for price to revisit the $31.00–$30.60 support zone after rejecting resistance. A retest of broken structure around 32.700–32.800 might provide an ideal entry for sellers.

Silver – Bearish Move Toward Support🧠 Market Overview:
Instrument: Likely Silver (based on file name).
Chart Context: The price is currently trading below both the 50 EMA (red) and 200 EMA (blue), indicating bearish momentum and a possible shift in market structure.
📊 Key Technical Components:
🔹 Exponential Moving Averages (EMA):
50 EMA (32.614) is above the 200 EMA (32.526) but both are above the current price.
This crossover is recent and could indicate the beginning of a larger downtrend if confirmed by continued price action below both EMAs.
🔹 Market Structure:
POI (Point of Interest) marks a previous swing high where selling pressure emerged.
The chart shows internal liquidity (INT.LQ) sweeps both above and below consolidation areas, hinting at smart money manipulation to grab liquidity before making a move.
🔹 Resistance Zone:
Clearly defined between approx. 33.4–34.0, where price was rejected after a failed attempt to break higher.
Multiple rejections from this zone show strong selling pressure.
🔹 Support Zone:
Sitting between approx. 30.8–31.2.
Price previously consolidated here before a bullish move, making it a likely target for a return test or a potential bounce.
📉 Bearish Scenario & Projection:
The price broke below a short-term structure and failed to hold above EMAs.
The current price action shows a bearish pullback likely to form a Lower High (LH).
The projected path shows a pullback to previous support-turned-resistance, followed by a breakdown targeting the support zone.
✅ Bias:
Short-term bias: Bearish
Medium-term bias: Bearish, unless price reclaims the 200 EMA and consolidates above the resistance zone.
🔍 Confluences Supporting Bearish Outlook:
Price below EMAs (dynamic resistance).
Failed higher highs with liquidity sweeps (indicating smart money selling).
Clear market structure shift to the downside.
Anticipated retest of support zone around 30.8–31.2.

SPY/QQQ Plan Your Trade For 5-5-25 : GAP Reversal PatternToday's pattern suggests the SPY will open with a GAP range from yesterday's candle Body and attempt to reverse the trend we saw last week.
I believe this move will resolve to the downside, as I've been warning of the May 2-5 Major Bottom for many weeks.
I believe the extended uptrend over the last few weeks was pure speculation related to Q1 US earnings. It is hard to argue that traders playing into the Q1 earnings boost didn't play the right side of the trend after watching the markets rally over the past 2+ weeks. But, I still believe the markets will consolidate and attempt to move downward over the next 10- 20+ days.
The one thing that we have to understand is Q1 was almost on auto-pilot from Biden's economy/spending until Trump threw a curveball at the global markets with tariffs.
I don't believe the US & global markets have truly priced in a global -25% to -45% economic contraction because of the ongoing tariff negotiations. It has been reported that shipping rates are down 60% in China. I believe we still need another 30-60+ days to work out the tariff issues and to allow the markets to settle into proper expectations for future economic output/growth.
Because of this, I continue to urge traders to stay cautious.
Sitting on CASH right now (only trading 20% of your total capital) is probably the smartest thing you can do at the moment.
I still expect the July and October 2025 lows to be the base/bottom of the markets, leading to a stronger upward price trend.
Right now, I've very cautious we've just seen a "dead-cat bounce" off recent lows because of Q1 earnings expectations.
Now that we've passed most of the Q1 data - we are staring at Q2 & Q3. What comes next.
I believe Gold/Silver will continue to price in extreme risk factors - resulting in a strong rally through May and into June.
I believe Bitcoin will stall and move back down to the lower consolidation range.
Let's see how things play out this week.
Get some.
#trading #research #investing #tradingalgos #tradingsignals #cycles #fibonacci #elliotwave #modelingsystems #stocks #bitcoin #btcusd #cryptos #spy #gold #nq #investing #trading #spytrading #spymarket #tradingmarket #stockmarket #silver

Silver H4 I Bearish Reversal Based on the H4 chart, the price is rising toward our sell entry level at 32.46, a pullback resistance.
Our take profit is set at 31.50, a pullback support that aligns with the 50% Fibo retracement.
The stop loss is set at 33.15, an overlap resistance.
High Risk Investment Warning
Trading Forex/CFDs on margin carries a high level of risk and may not be suitable for all investors. Leverage can work against you.
Stratos Markets Limited (tradu.com):
CFDs are complex instruments and come with a high risk of losing money rapidly due to leverage. 63% of retail investor accounts lose money when trading CFDs with this provider. You should consider whether you understand how CFDs work and whether you can afford to take the high risk of losing your money.
Stratos Europe Ltd (tradu.com):
CFDs are complex instruments and come with a high risk of losing money rapidly due to leverage. 63% of retail investor accounts lose money when trading CFDs with this provider. You should consider whether you understand how CFDs work and whether you can afford to take the high risk of losing your money.
Stratos Global LLC (tradu.com):
Losses can exceed deposits.
Please be advised that the information presented on TradingView is provided to Tradu (‘Company’, ‘we’) by a third-party provider (‘TFA Global Pte Ltd’). Please be reminded that you are solely responsible for the trading decisions on your account. There is a very high degree of risk involved in trading. Any information and/or content is intended entirely for research, educational and informational purposes only and does not constitute investment or consultation advice or investment strategy. The information is not tailored to the investment needs of any specific person and therefore does not involve a consideration of any of the investment objectives, financial situation or needs of any viewer that may receive it. Kindly also note that past performance is not a reliable indicator of future results. Actual results may differ materially from those anticipated in forward-looking or past performance statements. We assume no liability as to the accuracy or completeness of any of the information and/or content provided herein and the Company cannot be held responsible for any omission, mistake nor for any loss or damage including without limitation to any loss of profit which may arise from reliance on any information supplied by TFA Global Pte Ltd.
The speaker(s) is neither an employee, agent nor representative of Tradu and is therefore acting independently. The opinions given are their own, constitute general market commentary, and do not constitute the opinion or advice of Tradu or any form of personal or investment advice. Tradu neither endorses nor guarantees offerings of third-party speakers, nor is Tradu responsible for the content, veracity or opinions of third-party speakers, presenters or participants.

BUYS For the Markets. Wait for BUYS in Gold and Silver.In this video, we will analyze the S&P 500, NASDAQ, DOW JONES, Gold and Silver futures, for the week of May 5 - 9th.
The Indices are moving higher, and it's buys until they are not. Simple.
Gold is near potential support at 3201. This may present a great buying opportunity once the lows are swept. A weakened USD will help this cause.
Silver has made a bearish market structure shift (MSS), so buys are not yet on the table. If it disrespects a Daily -FVG, then sells are warranted. It is considerably weaker than Gold.
Enjoy!
May profits be upon you.
Leave any questions or comments in the comment section.
I appreciate any feedback from my viewers!
Like and/or subscribe if you want more accurate analysis.
Thank you so much!
Disclaimer:
I do not provide personal investment advice and I am not a qualified licensed investment advisor.
All information found here, including any ideas, opinions, views, predictions, forecasts, commentaries, suggestions, expressed or implied herein, are for informational, entertainment or educational purposes only and should not be construed as personal investment advice. While the information provided is believed to be accurate, it may include errors or inaccuracies.
I will not and cannot be held liable for any actions you take as a result of anything you read here.
Conduct your own due diligence, or consult a licensed financial advisor or broker before making any and all investment decisions. Any investments, trades, speculations, or decisions made on the basis of any information found on this channel, expressed or implied herein, are committed at your own risk, financial or otherwise.

Silver pleasurable ATMMany people are happy with their silver positions... What will make them sell it??
A loss of 50% into 2027 with a fake capitulation bottom.. Pump and dump??
They would be able to stock up on all the silver needed for smart cities and military weapons.
I like silver and we need it. BUT they need it manipulated to a cheap price and the military industry gets what it wants.
BE SAFE, NOT FINANCIAL ADVICE!!!

Natural Gas | Oil | Dollar | Silver | Gold Price ForecastPrice action, multi time frame, trend analysis on
NYMEX:NG1! PEPPERSTONE:NATGAS AMEX:UNG | Oil | Dollar | Silver | Gold Price Forecast

Why Palladium Is the Smart Play Right NowGold is hitting record highs, and silver is riding the wave—but smart investors know that diversification is key. While everyone is chasing gold, Palladium and Platinum are quietly setting up for a massive opportunity.
🔹 Palladium’s Market Position
✅ Palladium is rarer than gold—annual production is significantly lower.
✅ Industrial demand is surging, especially in automotive catalytic converters.
✅ Supply constraints due to geopolitical factors and mining limitations.
🔹 Palladium’s Role in the Green Revolution
🌍 Palladium is critical for reducing vehicle emissions—used in catalytic converters to meet stricter environmental regulations.
⚡ Hydrogen fuel cells and clean energy tech are increasing demand for Palladium.
🔋 Electronics & semiconductor industries rely on Palladium for conductivity and durability.
🔹 Gold Is at the Top—Time to Rotate?
📈 Gold is at all-time highs, making it expensive for new investors.
📉 Palladium has corrected from its highs, creating a buying opportunity.
💡 Diversifying into Palladium & Platinum now could be a strategic hedge against gold’s potential pullback.
🔹 Palladium’s Supply Crunch
⛏️ Russia & South Africa control most of the world’s Palladium supply—geopolitical risks could tighten availability.
📉 Mining output is declining, while demand remains strong.
💰 Lower supply + rising demand = price surge potential.
🔹 Platinum: The Underrated Hedge
💎 Platinum is historically undervalued compared to gold & Palladium.
🚗 EV & hydrogen fuel cell adoption could drive Platinum demand higher.
📊 Platinum-to-Gold ratio suggests Platinum is deeply discounted.
🔹 Final Thoughts
Gold is great, but smart investors look ahead. Palladium and Platinum are positioned for growth, with strong industrial demand, supply constraints, and undervaluation compared to gold.
📢 Now is the time to accumulate Palladium & Platinum before the market catches on.
TVC:PALLADIUM TVC:PLATINUM TVC:GOLD TVC:SILVER

SILVER Set To Grow! BUY!
My dear subscribers,
My technical analysis for SILVER is below:
The price is coiling around a solid key level - 32.014
Bias - Bullish
Technical Indicators: Pivot Points Low anticipates a potential price reversal.
Super trend shows a clear buy, giving a perfect indicators' convergence.
Goal - 32.660
My Stop Loss - 31.682
About Used Indicators:
By the very nature of the supertrend indicator, it offers firm support and resistance levels for traders to enter and exit trades. Additionally, it also provides signals for setting stop losses
Disclosure: I am part of Trade Nation's Influencer program and receive a monthly fee for using their TradingView charts in my analysis.
———————————
WISH YOU ALL LUCK
