SILVER WILL GROW|LONG|
✅SILVER made a retest of
The horizontal support area
Around 32.75$ while trading
In an uptrend and we are now
Seeing a bullish rebound
Which reinforces our bullish
Biased and we will be expecting
A further bullish move up
LONG🚀
✅Like and subscribe to never miss a new idea!✅
Disclosure: I am part of Trade Nation's Influencer program and receive a monthly fee for using their TradingView charts in my analysis.
Silver

SPY/QQQ Plan Your Trade Update : Playing Into The Major BottomThis update highlights what I believe will be the last level of defense for price (support) on the SPY and why it is so important to HEDGE the markets right now.
The upward price move has reached the ULTIMATE HIGH (I believe) and is now moving into a Bullish EPP pattern (shifting into the downward pullback, then it will move into the flagging phase).
This flagging phase will be the deciding move (IMO) related to IF the markets attempt to break upward or downward near the current Fib 50% level.
This is why it is so important to HEDGE all open positions right now.
This battle zone in the markets (near the Fib 50% level) is not a guaranteed move higher or lower. Basically, we are watching the battle take place in live trading.
What we can do is try to rely on the EPP patterns and other formations to help guide us to the highest probable outcome, but we have to stay liquid and fluid as the markets trend.
Right now, I would suggest the breakdown (Major Low) outcome is about 70-80% likely. Thus, the breakaway (upside) outcome may be 20-30% likely based on my analysis.
But that could change if the SPY moves above $555.
Thank you again for all the great comments. I'm trying to help as many traders as I can. But this move to the 50% level is very "indecisive". So, I'm having to rely on Fibonacci Price Theory and other techniques (money management/HEDGING) as a way to protect my capital while I trade.
This is a great example of how you can learn techniques (beyond technical analysis) related to what to do when you really don't know what the markets may do in the near future.
The answer is HEDGE ACTIVE POSITIONS - or pull trades off (even if they are at a loss) and then HEDGE whatever you want to keep active.
No one is going to laugh when you tell them, "I protected my capital by hedging last week" when they are looking at severe losses and you are NOT looking as severe losses.
It is SMART TRADING.
Get some.
#trading #research #investing #tradingalgos #tradingsignals #cycles #fibonacci #elliotwave #modelingsystems #stocks #bitcoin #btcusd #cryptos #spy #gold #nq #investing #trading #spytrading #spymarket #tradingmarket #stockmarket #silver

SILVER: Move Down Expected! Short!
My dear friends,
Today we will analyse GOLD together☺️
The recent price action suggests a shift in mid-term momentum. A break below the current local range around 33.0203 will confirm the new direction downwards with the target being the next key level of 32.8151.and a reconvened placement of a stop-loss beyond the range.
❤️Sending you lots of Love and Hugs❤️

Gold-Silver Ratio: Silver’s Lag and Historical DivergencesThe gold-silver ratio - the number of silver ounces equals in value to one ounce of gold – has surged recently as gold prices rally while silver underperforms. Gold, a traditional safe-haven, has climbed to record highs amid economic uncertainty, whereas silver, which is partly an industrial commodity, has struggled to break past $35/oz. As a result, the ratio is around 100 – meaning gold is ~100 times the price of silver despite the correction in the ratio from its peak around 125.
For context, the ratio averaged 57 from 1975-2000, and between 2000-2025 the ratio has ranged from 32 and 125 (with the max level reached this month with an average of 68. The ratio has observed extreme spikes in unusual crises).
Today’s elevated ratio highlights the divergence between gold’s sharp rally and silver’s lagging performance. The 25-year mean of the ratio is at 68, suggesting the present levels (100) represent an extreme deviation in favour of gold.
Historical Parallels in Gold-Silver Divergences
Similar wide divergences between gold and silver have occurred in the past. Key historical episodes illustrate how silver eventually played “catch-up” after lagging gold – albeit with varying lag times:
1970s – Silver’s Late Surge: After the U.S. abandoned the gold standard, gold prices soared while silver lagged. However, silver eventually staged a sharp rally later in the decade, quickly closing the gap and driving the gold-silver ratio sharply lower.
1980s – Prolonged Underperformance: Following the 1980 peak, precious metals collapsed, with silver suffering far more than gold. The gold-silver ratio surged and remained elevated through the 1980s and 1990s, as silver failed to catch up and largely moved sideways until the 2000s.
Early 2000s – Post-Recession Catch-Up: After the 2001 recession, gold began a
new bull market while silver initially lagged. Eventually, silver outpaced gold’s gains over the next several years, significantly narrowing the gold-silver ratio.
2008 Financial Crisis – Sharp Divergence and Recovery: The 2008 crisis caused gold to outperform sharply as silver collapsed. However, as the economy recovered, silver staged a dramatic rebound, quickly closing the gap and normalizing the ratio by 2011.
Why Is Silver Lagging Now? Industrial Demand Uncertainty
Roughly half of silver demand is industrial (electronics, photovoltaics, chemicals). Persistent worries about a global manufacturing slowdown and elevated inventories have capped silver’s upside just as investors have chased gold for geopolitical protection.
Source: Silver Institute
Worries about industrial demand have been exacerbated by the recent trade uncertainties which impact industrial sectors in an outsized manner.
By contrast, gold’s appeal as a safe haven has been boosted by geopolitical and inflation fears, driving it to record highs in 2025.
Despite cyclical swings, the underlying secular trend has crept higher for decades. Gold’s monetisation (central-bank reserves, ETF holdings surge) versus silver’s demonetisation, higher real production costs for gold, and silver’s growing industrial elasticity are all factors that represent a risk to normalization of the GSR.
Even a forceful mean-reversion might therefore stall nearer 60–70 than the sub-40 extremes of earlier cycles.
Hypothetical Trade Setups
History shows that once macroeconomic uncertainty clears, silver often recovers lost ground quickly. In previous periods of extreme gold-silver divergence, from the 1970s through 2008, silver staged strong rallies that pushed the gold-silver ratio (GSR) back toward normal levels.
Today, however, silver’s outlook remains clouded by uncertainty, particularly amid the ongoing trade war. Prices risk stalling below resistance around $35/oz. Consequently, the normalization in the GSR may instead result from a correction in gold prices. Gold has consistently broken record highs, and its long-term outlook remains firmly bullish. Nevertheless, concerns about the sustainability of the recent rally are valid - last week, gold fell sharply after setting a new high above $3,500/oz.
In summary, a normalization in the GSR could result from either a silver rally or a gold correction. While each path remains uncertain, a position focused on the ratio itself is relatively insulated from further divergence.
Given this environment, we could express our view in GSR through a long position in silver and a short position in gold. Investors can implement this using CME Micro Silver and Micro Gold futures. This setup benefits from 72% margin offsets. The Micro contracts balance the notional value between both legs by using one contract each.
A hypothetical trade setup consisting of a short position in CME Micro Gold futures expiring in June (MGCM2025) and a short position in CME Micro Silver futures expiring in June (SILM2025), offering a reward to risk ratio of 1.6x, is described below.
MARKET DATA
CME Real-time Market Data helps identify trading set-ups and express market views better. If you have futures in your trading portfolio, you can check out on CME Group data plans available that suit your trading needs tradingview.com/cme .
DISCLAIMER
This case study is for educational purposes only and does not constitute investment recommendations or advice. Nor are they used to promote any specific products, or services.
Trading or investment ideas cited here are for illustration only, as an integral part of a case study to demonstrate the fundamental concepts in risk management or trading under the market scenarios being discussed. Please read the FULL DISCLAIMER the link to which is provided in our profile description.

SPY/QQQ Plan Your Trade For 4-28 : Inside Breakaway In TRENDToday's Inside Breakaway pattern in Trend mode suggests the SPY will attempt to break away from Friday's body range. The Weekly Bias turned to BULLISH last week.
I believe today's price move will be indicative of the rest of the week. We are moving into a very strong Major CRUSH pattern on Friday and I believe that pattern will be a big breakdown move in price.
Thus, I believe the early trading this week (today and tomorrow) will set the tone for the rest of the week.
If we see a rotation in price near the 550 level (to the downside) then my May Low pattern will likely transition into a price breakdown this week.
If we see more upside price action on Monday/Tuesday, then I would be very cautious of the end of this week as a sudden price breakdown may happen.
Gold and Silver will likely stay very muted for the next two trading days. The Canadian Elections will likely cause the US to briefly pause as one of our closest neighbors and trading partners moves through this pivotal election.
Bitcoin will also likely pause a bit in early trading this week and BTCUSD moves up to the $95-96k upper resistance area.
I suggest traders take advantage of this pause in price action to HEDGE their open positions. I believe the bigger move is still to the downside, but I also believe the markets could continue to push a bit higher before ROLLING into that May 2-5 Major Bottom.
At this point, near the 50% Fib retracement level, the markets could break in either direction. But I still believe the May 2-5 Major Bottom will play out as a unique lower low price level - below $525-530 on the SPY.
Get some.
#trading #research #investing #tradingalgos #tradingsignals #cycles #fibonacci #elliotwave #modelingsystems #stocks #bitcoin #btcusd #cryptos #spy #gold #nq #investing #trading #spytrading #spymarket #tradingmarket #stockmarket #silver

SILVER Local Long! Buy!
Hello,Traders!
SILVER is trading in a local
Uptrend and the price made
A retest of the horizontal
Support level around 32.83$
From where we will be
Expecting a rebound and
A move up on Monday
Buy!
Comment and subscribe to help us grow!
Check out other forecasts below too!
Disclosure: I am part of Trade Nation's Influencer program and receive a monthly fee for using their TradingView charts in my analysis.

SILVER: Short Trading Opportunity
SILVER
- Classic bearish formation
- Our team expects fall
SUGGESTED TRADE:
Swing Trade
Sell SILVER
Entry Level - 33.096
Sl - 33.729
Tp - 31.949
Our Risk - 1%
Start protection of your profits from lower levels
Disclosure: I am part of Trade Nation's Influencer program and receive a monthly fee for using their TradingView charts in my analysis.
❤️ Please, support our work with like & comment! ❤️

GOLD weekly outlook Part 2Explaining the scenarios. DO's and DONT's. Time windows. Back testing with Proper explanation and Timeframe Alignment

BRIEFING Week #17 : AAPL's fate is the SP'sHere's your weekly update ! Brought to you each weekend with years of track-record history..
Don't forget to hit the like/follow button if you feel like this post deserves it ;)
That's the best way to support me and help pushing this content to other users.
Kindly,
Phil

GOLD REMAINS BULLISH ON LOWER TIMEFRAME - H4Despite posting the weekly indecision on gold, the metal remains bullish on the lower timeframe like H4 which is yet to break it's bullish structure. And with the rejection followed by the bullish candle before the close last trading week, XAUUSD likely will continue to rally up when market opens for trade next week.
N.B!
- XAUUSD price might not follow the drawn lines . Actual price movements may likely differ from the forecast.
- Let emotions and sentiments work for you
- ALWAYS Use Proper Risk Management In Your Trades
#gold
#xauusd

With Last Trading Week Indecision Next Week Will be BIG for GoldGold shows indecision after the close of trading hours for last week, and with the long sellers' wick exhibited on the candlestick, XAUUSD will require a huge geopolitical uncertainty news for price to continue to rise. A further rejection will drag gold's price to its mean.
N.B!
- XAUUSD price might not follow the drawn lines . Actual price movements may likely differ from the forecast.
- Let emotions and sentiments work for you
- ALWAYS Use Proper Risk Management In Your Trades
#gold
#xauusd

SILVER My Opinion! BUY!
My dear friends,
Please, find my technical outlook for NATGAS below:
The price is coiling around a solid key level - 33.100
Bias - Bullish
Technical Indicators: Pivot Points Low anticipates a potential price reversal.
Super trend shows a clear buy, giving a perfect indicators' convergence.
Goal - 33.330
About Used Indicators:
The pivot point itself is simply the average of the high, low and closing prices from the previous trading day.
Disclosure: I am part of Trade Nation's Influencer program and receive a monthly fee for using their TradingView charts in my analysis.
———————————
WISH YOU ALL LUCK

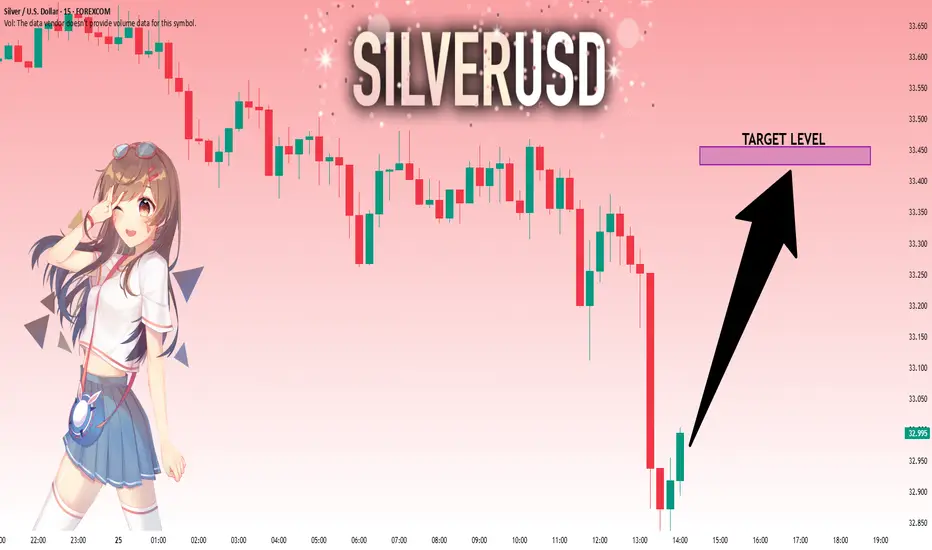
SILVER Will Go Up! Long!
Here is our detailed technical review for SILVER.
Time Frame: 9h
Current Trend: Bullish
Sentiment: Oversold (based on 7-period RSI)
Forecast: Bullish
The market is trading around a solid horizontal structure 3,308.7.
The above observations make me that the market will inevitably achieve 3,462.2 level.
P.S
Please, note that an oversold/overbought condition can last for a long time, and therefore being oversold/overbought doesn't mean a price rally will come soon, or at all.
Disclosure: I am part of Trade Nation's Influencer program and receive a monthly fee for using their TradingView charts in my analysis.
Like and subscribe and comment my ideas if you enjoy them!

XAGUSD long tradebullish back above the level
higher supports
clear ICC, just waiting for the volume on monday to kick in

SILVER: Move Up Expected! Long!
My dear friends,
Today we will analyse SILVER together☺️
The in-trend continuation seems likely as the current long-term trend appears to be strong, and price is holding below a key level of 32.982 So a bearish continuation seems plausible, targeting the next low. We should enter on confirmation, and place a stop-loss beyond the recent swing level.
❤️Sending you lots of Love and Hugs❤️
SPY/QQQ Plan Your Trade For 4-25 : Inside Breakaway patternToday's Pattern is an Inside Breakaway pattern. I suggest this pattern could play a pivotal role in how the markets setup for the May 2 Major Bottom pattern I'm expecting.
You'll see in this video how any move to the upside could present a broadening of the consolidation range - resulting in even bigger price volatility going forward.
Yet, I believe the markets will stall and roll a bit downward/sideways today. Possibly resulting in a move back into the lower consolidation range as we ROLL off resistance.
As I suggested last weekend, I see no reason to assume the markets are "cleared for take-off" yet. Tariffs and political concerns are still driving uncertainty.
I think we are seeing Q1 earnings inflate the markets while the fundamental elements of the global markets are still somewhat unsettled.
I urge traders to HEDGE any open trades going into this weekend. If the markets don't make any clear moves today, hedge any positions you hold into next week.
Gold & Silver are showing signs of minor panic selling. I see that as traders wanting to retest the $3300/$33 levels for Gold/Silver.
I still believe Gold/Silver will skyrocket higher. But, probably not going to happen today.
BTCUSD is making an interesting move higher. Potentially invalidating the previous EPP pattern and/or setting up a very broad consolidation range.
It will be interesting to see how BTCUSD continues to trend over the next few months.
Remember, I'm hopefully helping all of you find ways to improve your trading and find better results.
Get some..
#trading #research #investing #tradingalgos #tradingsignals #cycles #fibonacci #elliotwave #modelingsystems #stocks #bitcoin #btcusd #cryptos #spy #gold #nq #investing #trading #spytrading #spymarket #tradingmarket #stockmarket #silver

Silver INTRADAY uptrend continuation supported at 3247Key Support and Resistance Levels
Resistance Level 1: 3383
Resistance Level 2: 3414
Resistance Level 3: 3457
Support Level 1: 3247
Support Level 2: 3184
Support Level 3: 3112
This communication is for informational purposes only and should not be viewed as any form of recommendation as to a particular course of action or as investment advice. It is not intended as an offer or solicitation for the purchase or sale of any financial instrument or as an official confirmation of any transaction. Opinions, estimates and assumptions expressed herein are made as of the date of this communication and are subject to change without notice. This communication has been prepared based upon information, including market prices, data and other information, believed to be reliable; however, Trade Nation does not warrant its completeness or accuracy. All market prices and market data contained in or attached to this communication are indicative and subject to change without notice.

Silver Holds Ground on Mixed Trade SignalsSilver is trading around $33.50 on Friday morning, continuing to show greater sensitivity to macroeconomic shifts and trade news due to its dual role as both a precious and industrial metal. Recent price movements were shaped by mixed signals in U.S.-China trade relations. Although the Trump administration reportedly considered tariff reductions, Treasury Secretary Scott Bessent clarified that no formal proposals have been made and negotiations have not yet begun.
Technically, silver faces initial resistance at $33.80, with further levels at $34.20 and $34.85 if the upward move continues. On the downside, immediate support is seen at $33.15, followed by $31.40 and $30.20 if further weakness occurs.

Silver to over 500 USD in near futureClear cup and handle pattern, 2023 will be the year of the next Asian financial crisis just like in 1997 triggered either by Thailand or HongKong, only this time it will be Taiwan I believe. Anyone who haven't bought a new PC, laptop or a smartphone yet, do it now, shortages of microchips will be insane.

SILVER GROWTH AHEAD|LONG|
✅SILVER is trading in an
Uptrend and the price made
A bullish breakout of the key
Round horizontal level of 33.00$
Then made a pullback and is
Going up now so we are bullish
Biased and we will be expecting
A further bullish move up
LONG🚀
✅Like and subscribe to never miss a new idea!✅
Disclosure: I am part of Trade Nation's Influencer program and receive a monthly fee for using their TradingView charts in my analysis.

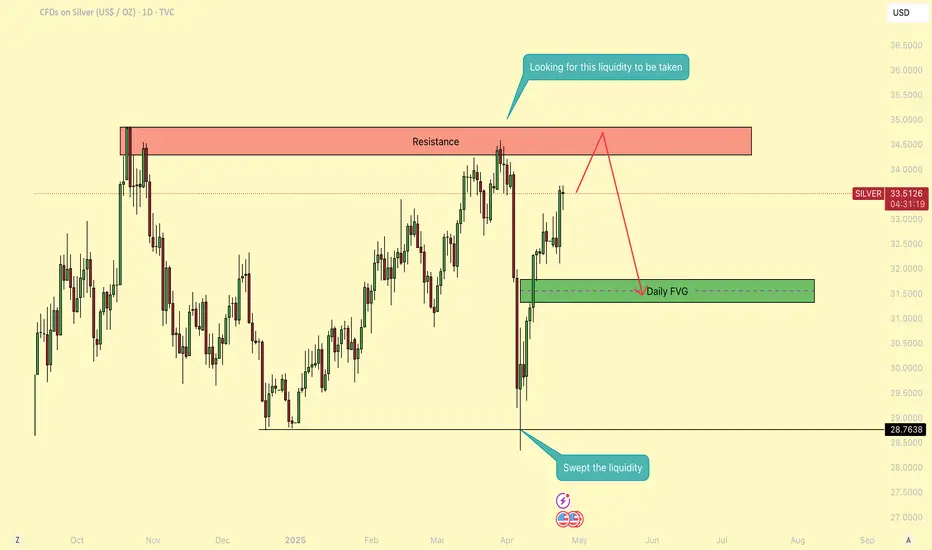
Silver - Is Silver ready to explode to the upside? Since the end of October, the price of silver has been trading within a relatively tight consolidation range, fluctuating between $35 and $28.50. This range has now been tested multiple times on both ends, with the price touching the upper resistance and lower support levels twice, creating a well-defined horizontal structure in the market.
During the most recent decline, silver broke below the $28.50 support, sweeping the previous low and triggering a liquidity grab. This move likely cleared out stop-loss orders positioned beneath that level, providing the necessary fuel for a strong reversal. Following this sweep, the price reacted sharply and began climbing, indicating a shift in momentum and a potential change in market structure.
Currently, silver is accelerating toward the upper boundary of the range, once again approaching the $35 resistance level. Given the previous behavior and the speed of the current move, I anticipate that the price may attempt to sweep the highs above $35, targeting the liquidity resting just above that resistance zone. A rejection from this level is possible, especially considering the presence of a daily Fair Value Gap (FVG) that was left behind during the recent bullish push. If the price pulls back into this FVG and finds support there, it could provide a healthy retracement and set the stage for a more sustained move higher in the medium term.
Overall, the market seems to be positioning itself for a breakout attempt, but the reaction around the $35 level will be crucial in determining whether silver continues upward or enters another phase of consolidation.
If silver manages to break above the $35 resistance and establish support above that level, it could mark a significant shift in market sentiment and open the door for further upside. Holding above this key threshold would likely confirm the breakout from the long-standing consolidation range, signaling strong bullish intent. In such a scenario, we could see increased momentum as sidelined buyers step in, targeting higher levels in the weeks to come.
Thanks for your support.
- Make sure to follow me so you don't miss out on the next analysis!
- Drop a like and leave a comment!
SPY/QQQ Plan Your Trade for 4-24 : Carryover PatternToday's Carryover pattern suggests we'll see similar price action today to what we saw yesterday.
We will very likely see a little support in early trading today, followed by a moderate meltdown-type trend.
I'm not expecting much to happen today - but we could get some news or other data that may prompt some type of bigger move in the markets.
Yesterday evening, I shared an "Update" video with everyone. In that video, I highlighted some of my active trades.
I've gotten a few messages from followers asking if I can share more data related to my trades. I'm sorry, but that won't happen in these FREE Plan Your Trade videos.
I shared some of my trades yesterday to highlight how I had moved into a moderate Short/PUT position, trying to stay ahead of the bigger market trend.
In other words, I'm not chasing the nickels. I'm setup to try to profit from the DOLLARS.
Gold and Silver may stay somewhat muted over the next 48 hours. But, I do expect them to try to melt upward.
BTCUSD appears to be setting up a BULL TRAP. I, personally, don't trust this upward price move because it is counter to the EPP price structure. I could be wrong.
But right now, I just don't trust the upside move in BTCUSD, knowing the SPY/QQQ should move into a deeper MAJOR LOW in early May.
Again, these videos are designed to help you build your skills and find your own style of trading.
I really do hope all of you are benefiting from my continued work to deliver these videos.
GET SOME...
#trading #research #investing #tradingalgos #tradingsignals #cycles #fibonacci #elliotwave #modelingsystems #stocks #bitcoin #btcusd #cryptos #spy #gold #nq #investing #trading #spytrading #spymarket #tradingmarket #stockmarket #silver

SILVER: Target Is Down! Short!
My dear friends,
Today we will analyse SILVER together☺️
The in-trend continuation seems likely as the current long-term trend appears to be strong, and price is holding below a key level of 33.442 So a bearish continuation seems plausible, targeting the next low. We should enter on confirmation, and place a stop-loss beyond the recent swing level.
❤️Sending you lots of Love and Hugs❤️
