SILVER: Will Go Up! Long!
My dear friends,
Today we will analyse SILVER together☺️
The in-trend continuation seems likely as the current long-term trend appears to be strong, and price is holding above a key level of 36.351 So a bullish continuation seems plausible, targeting the next high. We should enter on confirmation, and place a stop-loss beyond the recent swing level.
❤️Sending you lots of Love and Hugs❤️
Silver

SPY/QQQ Plan Your Trade For 6-19: GAP Reversal Counter TrendToday's pattern is a GAP Reversal in Counter Trend mode. I believe this could represent a breakdown in the ES/NQ as the US stock market is closed for the Juneteenth holiday.
Obviously, after the Fed comments yesterday (stating "uncertainty") and with the continued Israel/Iran conflict playing out, it makes sense to me that the US markets would move into a pre-weekend consolidation phase.
Even though the US stock market will be closed, the futures market will likely stay open and will carry some general market sentiment and reactions to news.
Watching Gold/Silver and Bitcoin should be very interesting today. I suspect the markets will continue to consolidate downward today - leading to a potential breakdown seeking support day on Friday.
Buckle up. We'll likely have 3-5+ days of news related to the Israel/Iran conflict and other issues over this weekend. It could be very interesting to see how the global markets move through this news.
Get some.
Happy Juneteenth
#trading #research #investing #tradingalgos #tradingsignals #cycles #fibonacci #elliotwave #modelingsystems #stocks #bitcoin #btcusd #cryptos #spy #gold #nq #investing #trading #spytrading #spymarket #tradingmarket #stockmarket #silver

Gold Spot (XAU/USD) $3400 Incoming again??Gold Spot (XAU/USD) – 1H Chart:
Chart Overview:
Overall Market Context:
Gold is currently retracing after a strong downtrend from a swing high near the supply zone. Price is reacting near a key bullish trend line and a local swing low.
Key Technical Elements:
OBV (On-Balance Volume):
The OBV has broken out of its downtrend resistance, suggesting a potential reversal in volume flow.
This shift implies bullish momentum could be building.
Trendline & Structure:
Price is respecting a bullish trend line, which has acted as dynamic support across multiple touches.
The current swing low sits right on this trend line, suggesting a possible bounce scenario.
Fair Value Gaps (FVGs) – 4H:
Two FVGs are located above current price around the 0.28–0.5 Fibonacci zone, indicating a likely magnet area if price starts to retrace upward.
These FVGs may act as short-term targets or resistance zones.
Fibonacci Retracement:
Price is currently near the 0.618–0.65 retracement zone, a classic golden pocket reversal area.
If price holds this level, a bounce toward the FVGs and supply zone is likely.
Supply Zone:
The major resistance sits above at the supply zone formed around the previous swing highs.
A rejection here could signal a return to range or continuation lower if not broken.
Demand Zone :
Below current price, a strong demand zone is marked, which historically triggered a large upward move.
If price fails to hold the trendline/swing low, this would be the next key support area to watch.
Scenarios:
🔼 Bullish Case:
OBV breakout holds and price bounces from the trendline/swing low.
Price moves up into the FVG zones and attempts to reclaim the previous swing high.
If it breaks above the supply zone, the next logical targets would be the psychological levels (e.g., $3,400+).
🔽 Bearish Case:
Failure to hold the current trendline and swing low.
Break below could lead to a move toward the demand zone, possibly sweeping lows and filling deeper FVGs.
If volume remains weak on bounce attempts, continuation of the downtrend is likely.
Summary:
Gold is at a critical inflection point. The bullish trendline and swing low offer a potential reversal area, supported by a breakout in OBV. A recovery into the FVGs above looks likely if price can maintain this level. However, failure here would lead to a drop toward the demand zone. Traders should monitor volume, OBV continuation, and price action near FVGs for confirmation.

Silver Price Retreats from 2012 HighsSilver Price Retreats from 2012 Highs
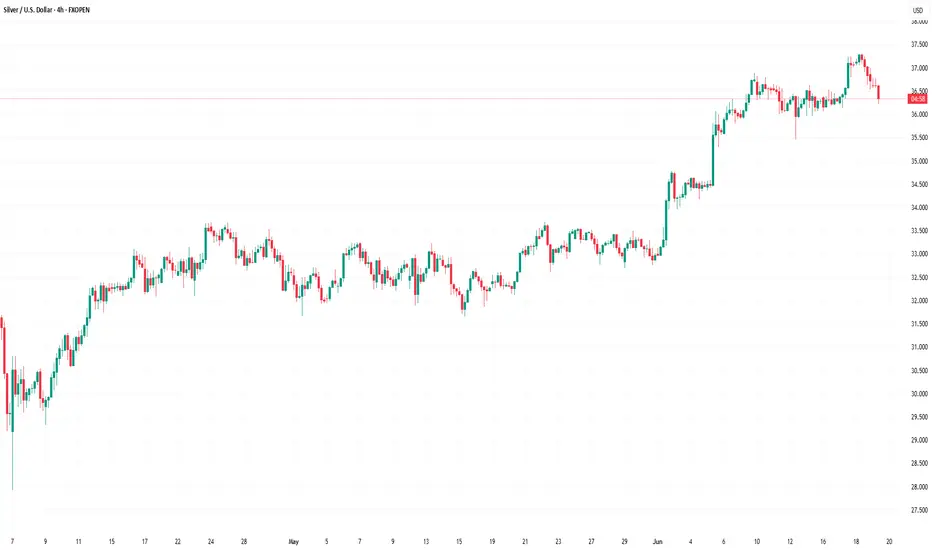
As shown on the XAG/USD chart, the price of silver climbed above $37 per ounce yesterday — a level not seen since 2012. However, this morning, the price has dropped by approximately 2.5% from yesterday’s peak.
The bullish driver behind the rally has been fears that the US could become involved in a military conflict between Israel and Iran. Concerns in financial markets intensified after media reports stated that US officials are preparing for a potential strike on Iran.
Another factor influencing silver's price was the Federal Reserve’s decision to keep interest rates unchanged and maintain a cautious policy stance. Yesterday, Jerome Powell warned that President Trump’s tariffs could fuel inflation (a bullish signal for silver) and complicate the economic outlook.
Technical Analysis of the XAG/USD Chart
In our previous analysis of the XAG/USD chart, we identified an upward channel. This channel remains relevant, though its configuration has shifted.
The price of silver remains in the upper part of the channel (a sign of strong demand). However, two signals suggest a potential correction may develop:
→ A bearish divergence on the RSI indicator;
→ A sharp decline from the channel’s upper boundary (marked with a red arrow), breaking through the local line that divides the upper half of the channel into quarters.
Nevertheless, given the scale of geopolitical risks, there is a chance that the bears may struggle to significantly shift the trend — especially with markets nearing the weekend closure.
This article represents the opinion of the Companies operating under the FXOpen brand only. It is not to be construed as an offer, solicitation, or recommendation with respect to products and services provided by the Companies operating under the FXOpen brand, nor is it to be considered financial advice.
Gold Market Update: Bulls Will target 3750 USD after 3500 USD🏆 Gold Market Mid-Term Update (June 19, 2025)
📊 Price & Technical Outlook
Current Spot Price: ~$3,365
Technical Setup
Inverted H&S pattern forming/completed on higher timeframes — confirms bullish reversal structure.
Reload (buy) zone: $3,250–$3,275 (ideal accumulation range for bulls if price pulls back).
Swing trade setup: Entry: $3,250–$3,275 (reload zone)
Take Profit (TP): $3,750
Support: Major at $3,250–$3,275 (break below = reassess bullish bias).
Resistance: $3,450–$3,500 ; next major resistance: $3,600, then $3,750.
Price consolidating above $3,250–$3,350 is technically healthy — maintaining bullish structure.
🏆 Bull Market Overview
The pullback appears complete; uptrend resumes amid strong macro/geopolitical drivers (inflation, rates, safe haven flows).
Key Levels: $3,000 (macro support), $3,250 (bulls must defend), $3,500 (breakout zone), $3,750 (swing TP).
Short-term dips = buying opportunities — “Buy the Dip” remains favored as long as support holds. Upside targets: Immediate: $3,600 Swing target: $3,750
Summary:
Gold remains in a bullish mid-term structure, with the inverted H&S pattern pointing to higher prices ahead. Bulls look to reload at $3,250–$3,275, targeting $3,750 for swing trades. As long as $3,180–$3,200 holds, buying dips is the play. A sustained breakout above $3,400–$3,600 opens the door for new all-time highs.

Silver Consolidates After Hitting Multi-Year HighSilver holds near $36.75 in Thursday’s Asian session, steady after a slight pullback from its highest level since February 2012. The trend remains bullish, suggesting more upside. A sustained move above $36.45–$36.50 confirmed a breakout from a descending channel, forming a bullish flag. The RSI has eased from overbought, and momentum indicators support a positive near-term outlook.
The first resistance is seen at 37.50, while the support starts at 35.40.
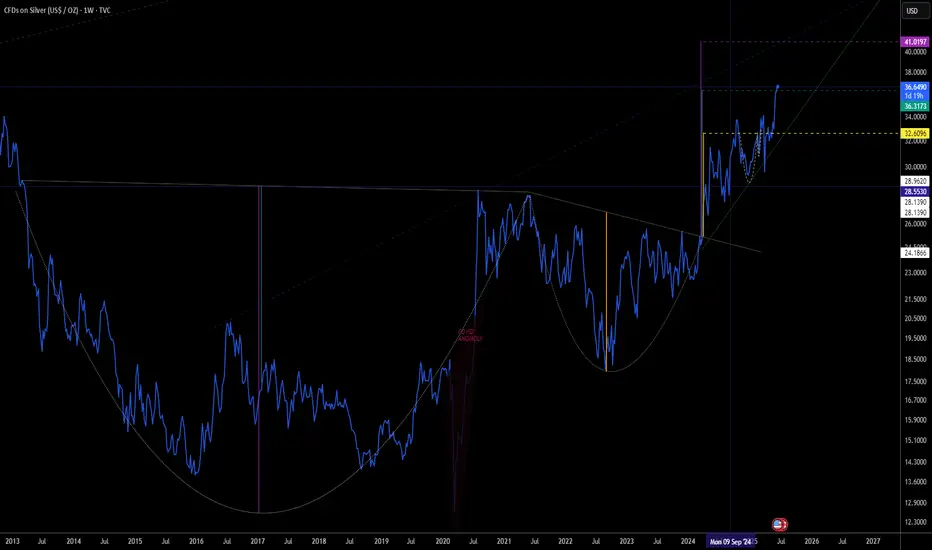
Silver Large Cup & Handle The image is a chart showing the price of silver (CFDs on Silver / USD per ounce) over time, from 2013 through 2025, with future projections. The chart suggests a bullish outlook for silver, possibly forecasting a rise to ~$41 based on historical patterns.
Silver H1 | Overlap resistance at 38.2% Fibonacci retracementSilver (XAG/USD) is rising towards an overlap resistance and could potentially reverse off this level to drop lower.
Sell entry is at 36.83 which is an overlap resistance that aligns with the 38.2% Fibonacci retracement.
Stop loss is at 37.10 which is a level that sits above the 61.8% Fibonacci retracement and a pullback resistance.
Take profit is at 36.21 which is a multi-swing-low support that aligns closely with the 61.8% Fibonacci retracement.
High Risk Investment Warning
Trading Forex/CFDs on margin carries a high level of risk and may not be suitable for all investors. Leverage can work against you.
Stratos Markets Limited (tradu.com ):
CFDs are complex instruments and come with a high risk of losing money rapidly due to leverage. 63% of retail investor accounts lose money when trading CFDs with this provider. You should consider whether you understand how CFDs work and whether you can afford to take the high risk of losing your money.
Stratos Europe Ltd (tradu.com ):
CFDs are complex instruments and come with a high risk of losing money rapidly due to leverage. 63% of retail investor accounts lose money when trading CFDs with this provider. You should consider whether you understand how CFDs work and whether you can afford to take the high risk of losing your money.
Stratos Global LLC (tradu.com ):
Losses can exceed deposits.
Please be advised that the information presented on TradingView is provided to Tradu (‘Company’, ‘we’) by a third-party provider (‘TFA Global Pte Ltd’). Please be reminded that you are solely responsible for the trading decisions on your account. There is a very high degree of risk involved in trading. Any information and/or content is intended entirely for research, educational and informational purposes only and does not constitute investment or consultation advice or investment strategy. The information is not tailored to the investment needs of any specific person and therefore does not involve a consideration of any of the investment objectives, financial situation or needs of any viewer that may receive it. Kindly also note that past performance is not a reliable indicator of future results. Actual results may differ materially from those anticipated in forward-looking or past performance statements. We assume no liability as to the accuracy or completeness of any of the information and/or content provided herein and the Company cannot be held responsible for any omission, mistake nor for any loss or damage including without limitation to any loss of profit which may arise from reliance on any information supplied by TFA Global Pte Ltd.
The speaker(s) is neither an employee, agent nor representative of Tradu and is therefore acting independently. The opinions given are their own, constitute general market commentary, and do not constitute the opinion or advice of Tradu or any form of personal or investment advice. Tradu neither endorses nor guarantees offerings of third-party speakers, nor is Tradu responsible for the content, veracity or opinions of third-party speakers, presenters or participants.

SILVER: Target Is Down! Short!
My dear friends,
Today we will analyse SILVER together☺️
The market is at an inflection zone and price has now reached an area around 36.878 where previous reversals or breakouts have occurred.And a price reaction that we are seeing on multiple timeframes here could signal the next move down so we can enter on confirmation, and target the next key level of 36.687..Stop-loss is recommended beyond the inflection zone.
❤️Sending you lots of Love and Hugs❤️

SPY/QQQ Plan Your Trade For 6-18 : GAP Potential PatternToday's GAP Potential pattern suggests the SPY/QQQ may GAP a bit higher at the open, then move into a melt-up phase, trying to identify resistance, then roll into a topping pattern and move downward.
I believe the recent "rollover" of the markets (initiating last Friday with the Israel/Iran conflict) is still dominating the markets and news related to the ongoing conflict could drive a moderate pullback in US assets.
Headed into the Juneteenth holiday (Thursday, June 19), I suggest traders prepare for the US markets to move into somewhat of a SETTLEMENT mode today - where traders don't want to hold too many open positions into Friday's trading.
Additionally, Gold and Silver could move into a very strong upward price move over the next 4-5+ days. So be prepared for metals to hedge risks when the US stock market is closed.
BTCUSD seems to be struggling into the FLAG APEX. I'm waiting to see if my FLAG count is correct and if we get the breakdown in BTCUSD as I expect.
Get some.
#trading #research #investing #tradingalgos #tradingsignals #cycles #fibonacci #elliotwave #modelingsystems #stocks #bitcoin #btcusd #cryptos #spy #gold #nq #investing #trading #spytrading #spymarket #tradingmarket #stockmarket #silver

Silver Up Slightly as Markets Await PowellXAG/USD rose 0.3% to $37.23 on Wednesday, though gains were capped by a stronger U.S. dollar as investors turned to safe assets amid escalating geopolitical tensions and caution ahead of the Federal Reserve’s decision. Silver’s safe-haven appeal remained, but the firmer dollar made it less attractive for non-dollar buyers. Markets are now watching Fed Chair Jerome Powell’s remarks for clues on future policy and near-term direction for silver.
Resistance is set at 37.50, while support stands at 35.40.

Would you like some more SILVER?I've been talking about it to my community for weeks!! This is the first time I've talked about it here. I hope this will resonate with some of you!

PAAS – High Tight Flag with Silver TailwindsPan American Silver ( NYSE:PAAS ) is forming a high tight flag — one of the most explosive continuation patterns — just as silver starts heating up.
🔹 High Tight Flag Formation
NYSE:PAAS ripped with momentum and is now consolidating in a tight, bullish range.
This is exactly what you want to see — shallow pullback, tight candles, and holding near highs.
🔹 Sector Momentum: Silver Heating Up
AMEX:SLV and /SI are pushing toward multi-year breakout levels.
NYSE:PAAS is riding that same energy, and any continuation in silver could ignite this setup.
My Trade Plan:
1️⃣ Starter Position: Looking to enter on strength through the top of the flag.
2️⃣ Add on Confirmation: Add size on volume surge and breakout follow-through.
3️⃣ Stop Loss: Below flag base — keeping it tight and defined.
Why I Love This Setup:
High tight flags are low-risk, high-reward when paired with macro momentum.
Silver is gaining strength — NYSE:PAAS could lead the miner group if this breaks clean.
Strong structure, clean risk, macro fuel = great setup.

$DXY Dollar stays weak but is it bottommed?Have not many ANY trades based on the US Dollar. Have not been convinced in either way, yet.
TVC:DXY has been weaker lately but not by much. Well, at least compared to its previous low.
However, LONGER TERM we see it's biz as usual.
It is currently fairly oversold on the weekly chart & could be primed to change direction.

SPY/QQQ Plan Your Trade for 6-17: Top Resistance PatternToday's pattern suggests the SPY/QQQ will move into a type of topping pattern, attempting to identify resistance, then roll away from that resistance level and trend downward.
I suggest the news related to the conflict between Israel & Iran may continue to drive market trends with traders moving away from uncertainty near these recent highs.
Silver makes a big move higher. Gold will likely follow later this week or early next week.
BTCUSD moves into a sideways FLAGGING pattern - possibly attempting a BIG BREAKDOWN event over the next few weeks.
Overall, the markets look like they are poised for a very big move - just waiting for the GREEN LINK (GO).
Stay safe. Protect capital and HEDGE.
Get some.
#trading #research #investing #tradingalgos #tradingsignals #cycles #fibonacci #elliotwave #modelingsystems #stocks #bitcoin #btcusd #cryptos #spy #gold #nq #investing #trading #spytrading #spymarket #tradingmarket #stockmarket #silver

SILVER: The Market Is Looking Up! Long!
My dear friends,
Today we will analyse SILVER together☺️
The price is near a wide key level
and the pair is approaching a significant decision level of 36.903 Therefore, a strong bullish reaction here could determine the next move up.We will watch for a confirmation candle, and then target the next key level of 37.240 .Recommend Stop-loss is beyond the current level.
❤️Sending you lots of Love and Hugs❤️

SILVER BEARISH BIAS RIGHT NOW| SHORT
SILVER SIGNAL
Trade Direction: short
Entry Level: 3,714.4
Target Level: 3,384.5
Stop Loss: 3,933.3
RISK PROFILE
Risk level: medium
Suggested risk: 1%
Timeframe: 1D
Disclosure: I am part of Trade Nation's Influencer program and receive a monthly fee for using their TradingView charts in my analysis.
✅LIKE AND COMMENT MY IDEAS✅

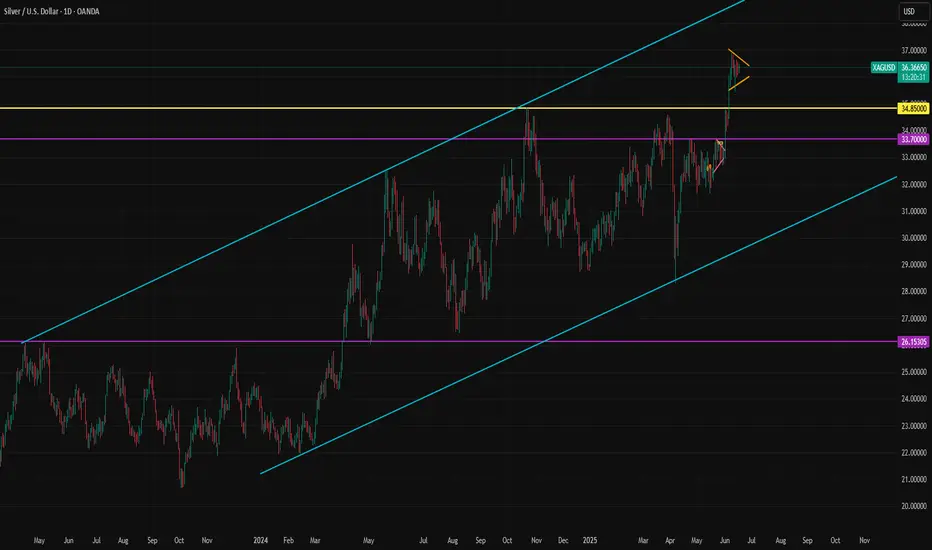
Why Silver Could Outperform Gold in the Coming Months? Silver recently broke out above the key 34.85 resistance level, and this could be a game changer for the medium-term outlook. With rising concerns over government debt, trade uncertainty, and escalating geopolitical risks, gold rallied strongly from 2000 to 3500. Gold and silver typically have a high correlation, and silver tends to follow gold. However, during the latest tariff-driven rally, gold pushed toward 3500 while silver failed to keep up. So, why did gold outperform silver this time?
The answer lies in the demand dynamics. Gold demand primarily comes from the investment side, while silver demand has traditionally been balanced around 50% investment and 50% industrial use. That balance has now shifted significantly. According to the Silver Institute, only 17.8% of 2025 silver demand is expected to come from investments. If we group jewelry and silverware with investment as a “store of value” category, the mix becomes 61% industrial and 39% investment.
This shift has been driven by a surge in silver demand from the electrical and electronics sector. The growth of clean energy and AI technologies has accelerated silver usage. In fact, the electrical and electronics sector is projected to account for 40.5% of total silver demand in 2025. This explains why slowing global trade and economic activity have had a more negative effect on silver compared to gold, pushing the gold/silver ratio to historically high levels.
That said, this same dynamic could fuel silver’s rise in the coming years, supported by long-term trends in clean energy and advanced technology.
The breakout of 34.85 is a significant technical development . Silver has been in an active uptrend channel since 2024, but the 34.85 level repeatedly capped upward moves since October. With this breakout, silver now has room to rise gradually toward the upper boundary of the channel, potentially reaching near 40. Key support levels to watch are 34.85 and 34.45. As long as they hold, the primary direction remains upward. The moves may be gradual but could include sharp surges and continuation patterns like flags.
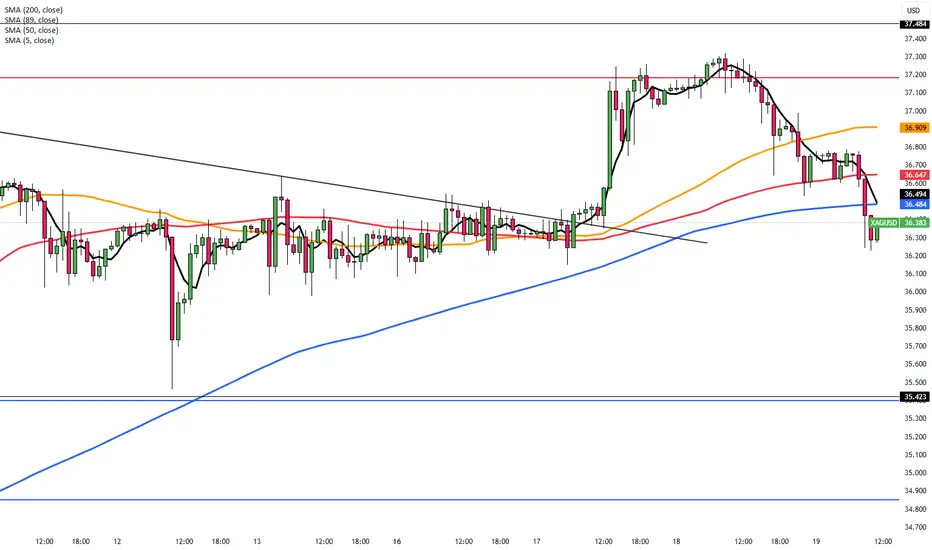
Silver H1 | Rising into a swing-high resistanceSilver (XAG/USD) is rising towards a swing-high resistance and could potentially reverse off this level to drop lower.
Sell entry is at 36.50 which is a swing-high resistance.
Stop loss is at 36.70 which is a level that sits above the 78.6% Fibonacci retracement and a swing-high resistance.
Take profit is at 36.06 which is a multi-swing-low support that aligns closely with the 50% Fibonacci retracement.
High Risk Investment Warning
Trading Forex/CFDs on margin carries a high level of risk and may not be suitable for all investors. Leverage can work against you.
Stratos Markets Limited (tradu.com ):
CFDs are complex instruments and come with a high risk of losing money rapidly due to leverage. 63% of retail investor accounts lose money when trading CFDs with this provider. You should consider whether you understand how CFDs work and whether you can afford to take the high risk of losing your money.
Stratos Europe Ltd (tradu.com ):
CFDs are complex instruments and come with a high risk of losing money rapidly due to leverage. 63% of retail investor accounts lose money when trading CFDs with this provider. You should consider whether you understand how CFDs work and whether you can afford to take the high risk of losing your money.
Stratos Global LLC (tradu.com ):
Losses can exceed deposits.
Please be advised that the information presented on TradingView is provided to Tradu (‘Company’, ‘we’) by a third-party provider (‘TFA Global Pte Ltd’). Please be reminded that you are solely responsible for the trading decisions on your account. There is a very high degree of risk involved in trading. Any information and/or content is intended entirely for research, educational and informational purposes only and does not constitute investment or consultation advice or investment strategy. The information is not tailored to the investment needs of any specific person and therefore does not involve a consideration of any of the investment objectives, financial situation or needs of any viewer that may receive it. Kindly also note that past performance is not a reliable indicator of future results. Actual results may differ materially from those anticipated in forward-looking or past performance statements. We assume no liability as to the accuracy or completeness of any of the information and/or content provided herein and the Company cannot be held responsible for any omission, mistake nor for any loss or damage including without limitation to any loss of profit which may arise from reliance on any information supplied by TFA Global Pte Ltd.
The speaker(s) is neither an employee, agent nor representative of Tradu and is therefore acting independently. The opinions given are their own, constitute general market commentary, and do not constitute the opinion or advice of Tradu or any form of personal or investment advice. Tradu neither endorses nor guarantees offerings of third-party speakers, nor is Tradu responsible for the content, veracity or opinions of third-party speakers, presenters or participants.

Zac will explode WHEN above 10 cents. If silver explodes above $40 dollars, Zac should explode above 10 cents. If so, 28 cents can be reached.

SILVER: Will Go Down! Short!
My dear friends,
Today we will analyse SILVER together☺️
The in-trend continuation seems likely as the current long-term trend appears to be strong, and price is holding below a key level of 36.344 So a bearish continuation seems plausible, targeting the next low. We should enter on confirmation, and place a stop-loss beyond the recent swing level.
❤️Sending you lots of Love and Hugs❤️

SPY/QQQ Plan Your Trade For 6-16 : Up-Down-Up PatternToday's Up-Down-Up Pattern suggests the markets will transition into a moderate upward trending price bar - which is quite interesting in the world we have today.
War and a big weekend of events, protests and other new items could drive market trends over the next few days.
Still, the SPY Cycle Pattern for today is an Up-Down-Up - which suggests last Thursday was an Up bar, last Friday was a Down bar, and today should be an Up bar.
The Gold/Silver pattern is a POP pattern in Counter-trend.
I believe the US markets are benefiting as a safe-haven for capital as the global turmoil drives global investors to seek safety and security for their capital.
That means as long as the world continues to spin out of control, the US markets and the US-Dollar will act as a moderate safe-haven for capital.
Gold and Silver should also benefit from this global chaos.
Bitcoin is benefiting from the strength of the US markets (and the technology sector) as well.
Let's see how this week start to play out. I'm waiting for some more news.
Could be very interesting this week.
Get some.
#trading #research #investing #tradingalgos #tradingsignals #cycles #fibonacci #elliotwave #modelingsystems #stocks #bitcoin #btcusd #cryptos #spy #gold #nq #investing #trading #spytrading #spymarket #tradingmarket #stockmarket #silver

Silver Gains on Tensions, Eyes on FedFriday’s strong U.S. data may support the dollar, as the University of Michigan’s Consumer Sentiment Index rose to 60.5 in June from 52.2, beating forecasts of 53.5 and marking the first gain in six months.
Geopolitical tensions continue to drive safe-haven demand, especially for silver. Israel struck Iranian nuclear and missile sites Friday, killing military officials. On Sunday, Iran began its fourth phase of response, warning of firm retaliation to further Israeli actions.
Markets now turn to Wednesday’s Fed meeting. While rates are expected to stay unchanged, futures still price in two cuts this year, possibly starting in September, supported by last week’s soft inflation data.
Resistance is set at 36.90, while support stands at 35.40.
