Head and Shoulders on Silver bearish price to target $16.30Head and Shoulders officially formed on Daily.
The previous analysis, we were waiting for the pattern to form a Right Shoulder.
Now with the price breaking below the RS, almost confirms the trade entry.
21>7
Price <200 - Bearish (Red back)
RSI<30 - Bearish
Target $16.30
Silveranalysis

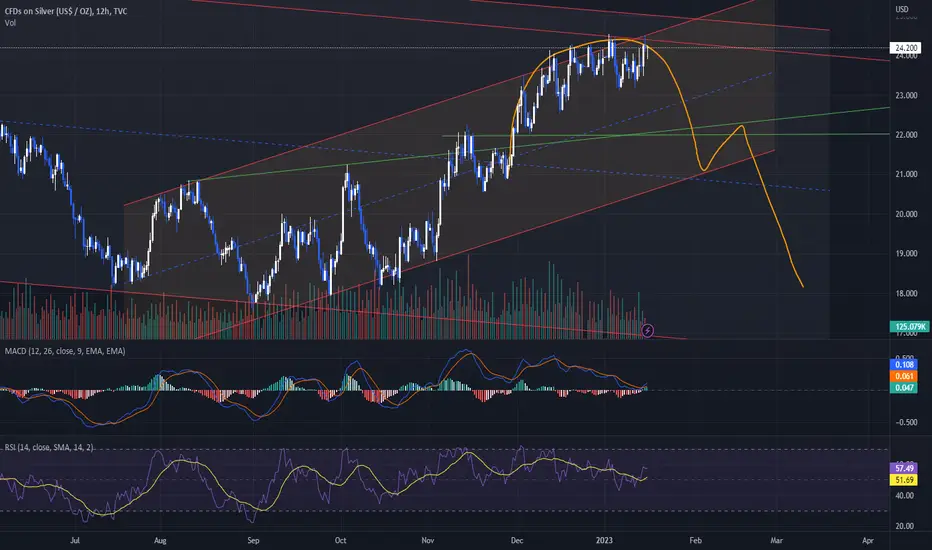
DeGRAM | Silver confluence zoneSilver pulled back to resistance level after a huge sell off.
If the market fails to break through the resistance at 23.500 and fibo extesion level, we can sell from the kill zone.
We anticipate a short-term pullback and even further movement down.
-------------------
Share your opinion in the comments and support the idea with like. Thanks for your support!

XAG/USD sees new YTD low as selloff continuesThe recent gains in precious metals, most notably gold but also silver, were backed by beliefs that a slowing economy would give way to the end of rate hikes by the Fed, and even possibly a few cuts before year-end. The economic data from December backed this view, which led investors to believe that the US economy was struggling, as CPI, PPI, retail sales, and industrial production all fell well below expectations.
The change in expectations about the future of the economy given the sudden and unexpected pickup in economic data has left markets confused for the past few weeks, and those assets that were performing best during the time when investors believed a recession was on the cards - like gold and silver - are now suffering the most.
There is no denying the downward bias in XAG/USD as the pair dips to a three-and-a-half-month low, but the oversold RSI could trigger some consolidation before the downward trend continues. The precious metal seems to have found some small support around $20.40, bouncing back towards Monday’s close at $20.61. That said, the daily candlesticks are still forming lower lows and highs, which suggests that any level of support is most likely to be short-lived unless the fundamental view reverses.
I think it’s only a matter of time before we move lower to the $20 mark, which is an important level in and of itself. This will be a good test of buying demand as there are likely to be some stops placed in and around this psychological round number, which could trigger a small bounce higher. In any case, we may see some consolidation around current levels before getting there, with the potential for an attempted rebound which could fade around $20.80.

This is %100 hypothetical, yet interesting to ponder on. Silver with a potential rounding top forming could lead us into a inverse cup & handle formation.
Silver just gave a strong sell signal with fundamentalsHead and Shoulders formed on the daily of Silver.
The price could next head on up to trap the bulls before the downside (forming a Right shoulder).
21>7 MA
Price <200 - Bearish (Red back)
RSI<30 - Bearish
Target $16.30
ABOUT Silver and why the price could drop
Silver is a precious metal that has been used for coins, jewelry, and decorative purposes for thousands of years.
Silver is a valuable industrial metal, used in a variety of applications such as electronics, solar panels, and batteries.
The price of silver is influenced by supply and demand factors, such as the amount of silver available for sale and the level of demand from investors and industrial users.
If investors perceive that there is less inflation risk or less economic uncertainty, they may shift their investments away from precious metals like silver, which could cause the price to drop. Now that inflation is slowing easing, this is why people could be shifting their money to other markets.
The value of the US dollar, which is often inversely related to the price of silver, can impact the metal's price. If the dollar strengthens, the price of silver normally drops where investors seek other investment options.
If there is a decrease in geopolitical tensions or risks, investors may shift their investment focus away from precious metals like silver, which could cause the price to drop.

silver will be falling in the next weekthe silver XAGUSD will have to make a correction to 21.20$ and maybe to the 21.40 area as well before the continuation of the downtrend to the 20.33 area. also, there is a great probability that the market can go down without making a correction!
that's what I believe. what about you guys? what do you think? tell me your opinion. do you agree or not .??
good luck traders !!


Silver - Beautiful Support Level Hi, this is my new update for Silver. On 9th may 2022 we broke important support level 21.60 - 22.10$ in Silver and after ranging below it for 210 days, we finally broke the resistance on December 1st. In the last couple of days we are testing it, to see if it holds as support level again or not. I expect that we are going to hold the support level, because at the same time we have 100 and 200 days moving averages near the support level, we have also 50 and 200 weeks moving averages, so we are little bit to lucky :)
Another thing we're looking at is that we are in a bullish expanding triangle and at the same we are getting back the bullish momentum in monthly timeframe for the first time since 2021. We have to be cautious too, because if we break the support level, I expect we are going much lower than 20$.

Short Term Silver BearishSilver showing a short term bearish trend.
Spotted an short entry on the upper trendline.
target short term profit at lower trend line.

SILVER SORT - MORE DOWNSIDE!Waiting for a pullback into 23.10435 or 23.57880 to short XAGUSD to a key 4H level at 21.68865
If you agree drop a like and if you have any questions leave a comment :)

Silver -> The Bounce Is InevitableHello Traders,
welcome to this free and educational multi-timeframe technical analysis.
The last three weeks Silver perfectly tested a quite obvious previous weekly support zone, which was now turned resistance and with this weeks candle the market finally rejected the zone towards the downside.
Considering the fact that we are now testing an insanely strong weekly support zone, I do at least expect a short term short covering rally towards the upside, after Fridays harsh dump towards the downside.
From a daily perspective we are also close to retesting previous support, so I am now just waiting for a deeper retest of the support zone, before I will then enter a long position on Silver.
Thank you for watching and I will see you tomorrow!
You can also check out my previous analysis of this asset:

UPDATED SILVER CHARTSold some of my silver today, and buying back in next year. Hope this helps.
We have a bottom around 15.5 next year Cinco De Mayo
Good Luck.

SILVER CHART MINDSETYou have one of these three mindsets when confronting your truth about silver.
Which one you are you?
OR you are hoping for luck.
and the last is, i dont have a clue.
:)
Good luck out there. Maybe mining or panning for silver is a better option for you.

Silver - what nextJust 2 days , i expect silver to start milting , its now in fist target .
I think new low is possible .
Good Luck

SILVER -pt. 4 - Ranging finished, big move triggered?Hello traders!
In the previous posts, linked below, we outlighted two alternative scenearios for silver: either a cycle corrective move still to complete at 16 either a wave 1 in long term uptrend reusumption.
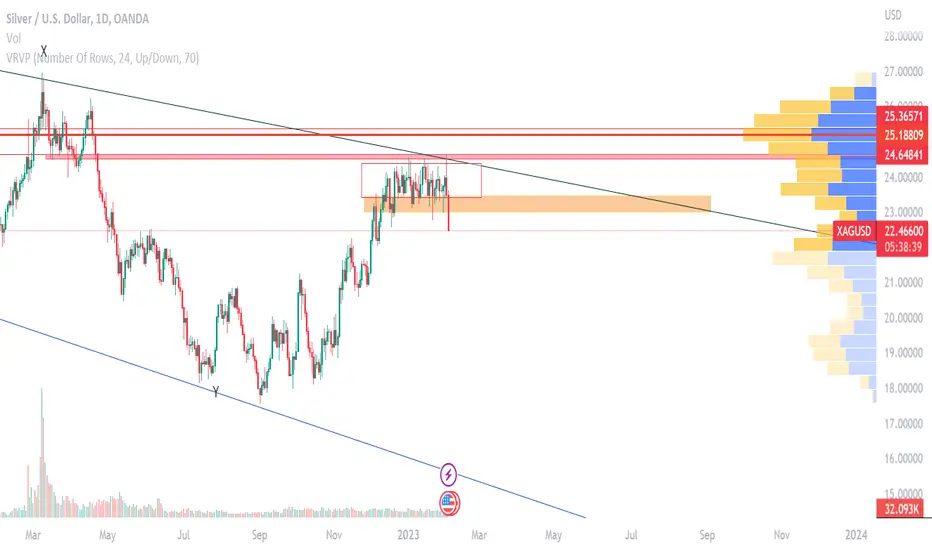
Silver was ranging near the main trendline of this last cycle correction, and has been rejected for the third time in the 24.6 big volume area (see chart).
After this last rejection, price broke the range to the downside suggesting the bearish scenario.
NO FOMO here! We will wait for retest and confirmation to evaluate a short entry.
Grand Silver SupercycleI present the Grand Silver Supercycle. Silver has followed Elliott Wave Theory nicely through the years. The price hit a century low during The Great Depression, beginning what I believe to be the first wave of a supercycle. There is a clear five wave pattern up from this low, peaking in 1980. This is supercycle wave 1. Then, we see a five wave corrective pattern down, bottoming out in the early 90s. Alternatively, a three wave ABC pattern could be drawn. This is where supercycle wave 3 begins. Wave 3 is typically much more prominent than wave 1 in Elliott Wave Theory. For this reason, it makes sense that the next five wave pattern ending in 2011 is only the first subwave of supercycle wave 3. The second subwave corrected to the 2020 low, and we are currently on the third subwave. Within this subwave, we could either be starting a third wave (as shown in the chart) or still be on the corrective second wave. I believe the former is much more likely due to fundamentals.
Price targets within the current subwave were estimated as follows:
wave 3 length = 1.618 X wave 1
wave 3 target = $48
wave 4 length = 38.2% retracement of wave 3
wave 5 length = 1.618 X (wave 3 end - wave 1 start)
I'm more confident on wave 3 ending near $48 than I am of wave 5 ending near $95. There is strong resistance at $50, which coincides with the Elliott target zone. Wave 5 length can vary significantly. For silver at least, fifth waves have traditionally been long ones.
Fundamentals
Elliott Wave Theory is only a tool. It needs to be backed up by fundamentals when forecasting on long time frames. Silver is undervalued due to many years of supply outstripping demand, creating cheap prices. That is in the early stages of changing as now demand outpaces supply. Global silver demand was expected to hit an all time high of 1.21 billion ounces in 2022 (www.silverinstitute.org). This is largely due to increases in demand in both industry (Green Revolution) and personal investment (stackers hedging against inflation). Silver reserves currently stand at 530,000 metric tons (www.statista.com). The current demand is 38,000 metric tons per year. A simple calculation shows existing reserves could be depleted in 14 years. However, this calculation doesn't take into account new discoveries and recycling, which have so far kept pace with demand. Estimates of time to depletion of reserves vary wildly from a couple decades to a few centuries. At the moment, the prime driver of price (in addition to inflation) will be the deficit, not depletion of reserves.
Inflation is a totally different animal that is much harder to forecast long term due to its close relationship to government and Federal Reserve policy. It is more likely that when presented the choice, our leaders choose high inflation over debt default and depression. How this all is going to play out is anyone's guess. It seems for now our leaders are trying to kick the can down the road for as long as possible. If hyperinflation hits, the silver price will reach extraordinary heights.

Silver update Silver looks weak and cant pass the resistance line .
Shorting from here is a steel , and good point .
Still in down trend and we can make lower low before the next pull run .
Good luck

Silver Multi-Timeframe Analysis 30.01Hello Traders,
welcome to this free and educational technical analysis .
Silver is currently testing a very strong weekly support/resistance area amd after this massive runup there is the possibility that we will see a short term correction away from the zone.
On the daily timeframe you can see a beautiful distribution phase, where the market is starting to create lower highs and lower lows, so I am now just waiting for a break of the very strong previous support zone and then a retest,
and then I will definitely enter a short to capitalize on the continuation to the downside.
Thank you for watching and I will see you tomorrow!
You can also check out my previous analysis of this asset:

Silver outperform gold during crisis Silver outperform gold during major crisis.
During each crisis, Gold and Silver always performed exceptionally well compared to many other markets.
In this study, we could see that during major crises, silver outperforms gold.
Commodities are a good inflation hedge asset, precious metals are a good inflation and currencies hedge asset.
Interestingly, prior to each of its extreme peaks, the market did provide us with clues on its first wave.
For the coming extreme, the first wave has just completed its moves. There is always a fundamental story tied to its first wave, follow-by an explosive move. What could be the story this round on its first wave? Covid follow-by high inflation?
CME Micro Silver Futures
Minimum fluctuation
0.005 = $5
0.01 = $10
0.1 = $100
1 = $1,000
Disclaimer:
• What presented here is not a recommendation, please consult your licensed broker.
• Our mission is to create lateral thinking skills for every investor and trader, knowing when to take a calculated risk with market uncertainty and a bolder risk when opportunity arises.
CME Real-time Market Data help identify trading set-ups in real-time and express my market views. If you have futures in your trading portfolio, you can check out on CME Group data plans available that suit your trading needs www.tradingview.com
See following link for the video version.

Silver Trend is downside TodaySilver is looking on downside today and looking to touch again the 22's level. target range will be 22.80 again

DeGRAM | SILVER downward channelSilver is consolidating at resistance on the higher timeframes.
Price action is moving in a downward channel .
If the market fails to break through the resistance level , we can look for selling opportunities.
We anticipate a short-term pullback.
-------------------
Share your opinion in the comments and support the idea with like. Thanks for your support!

Silver has started a new, major impulsive wave 3.The silver market began the initial subwave of a new, major impulsive wave, marked as the third in a sequence. This cyclical pattern can be traced back to the year 1932, with the completion of wave one in 1968, the corrective wave two in 1971, the impulsive wave three in January 1980, the corrective wave four in 1991, and ultimately, a truncated fifth wave that reached its peak in April of 2011. This entire sequence can be considered as the first impulsive wave in an even higher degree. The second corrective wave ended in March of 2020, with support being found at the 0.236 Fibonacci level. Currently, silver is preparing for what is expected to be the most explosive and unpredictable impulsive wave three in a very long-term scale.
Resistance points include:
- $24.69 (0.382 Fibonacci extension level)
- $26.55 (0.238 Fibonacci retracement level)
- $45.29 (0.382 Fibonacci extension level)
- $49.83 (all-time high)
- $83.11 (0.618 Fibonacci; golden ratio)

XAGUSDSILVER touched top line of important correction. I think silver is looking GOLD and DOLLAR INDEX. DXY is really important for this chart, if DOLLAR takes power, SILVER can have good correction.
