Silver Projection!The price is nearing the supply zone. After the retest, if the price closes below and makes a bearish price action structure, then short positions are initiated.
Silveranalysis

XAG/USD "The Silver" Metal Market Heist Plan (Swing/Day Trade)🌟Hi! Hola! Ola! Bonjour! Hallo! Marhaba!🌟
Dear Money Makers & Robbers, 🤑💰✈️
Based on 🔥Thief Trading style technical and fundamental analysis🔥, here is our master plan to heist the XAG/USD "The Silver" Metal Market. Please adhere to the strategy I've outlined in the chart, which emphasizes short entry. Our aim is the high-risk Pink MA Zone. Risky level, oversold market, consolidation, trend reversal, trap at the level where traders and bullish robbers are stronger. 🏆💸"Take profit and treat yourself, traders. You deserve it!💪🏆🎉
Entry 📈 : "The vault is wide open! Swipe the Bearish loot at any price - the heist is on!
however I advise to Place sell limit orders within a 15 or 30 minute timeframe most nearest or swing, low or high level for Pullback Entries.
Stop Loss 🛑:
📌Thief SL placed at the nearest/swing High or Low level Using the 1 Day timeframe (32.000) Day/Swing trade basis.
📌SL is based on your risk of the trade, lot size and how many multiple orders you have to take.
Target 🎯: 27.000 (or) Escape Before the Target
⚙💿XAG/USD "The Silver" Metal Market Heist Plan (Swing/Day Trade) is currently experiencing a Neutral trend (there is a chance to move bearishness),., driven by several key factors.👇👇👇
📰🗞️Get & Read the Fundamental, Macro, COT Report, Quantitative Analysis, Sentimental Outlook, Intermarket Analysis, Future trend targets.. go ahead to check 👉👉👉🔗
Detailed Point Explanation 📋
Fundamentals 🌟: Silver’s dual role ensures resilience, but USD and rates cap gains ⚖️.
Macro 📊: Inflation aids 🔥, but growth and policy risks create volatility ⚡.
Geopolitics 🌐: Safe-haven demand helps 🛡️, though trade wars hurt industrial use 🚨.
Supply/Demand ⚖️: Deficit is a strong bullish driver 📉, despite short-term fluctuations ⚡.
Technicals 📉: Near-term weakness 🐻 within a broader uptrend 🐮.
Sentiment 😊: Balanced ⚖️, with cautious optimism prevailing 🌟.
Seasonal 🍂: Neutral ⚖️, with minor weather-related disruptions ❄️.
Intermarket 🔗: Gold supports 🥇, USD resists 💵 – a tug-of-war ⚔️.
Investors/Traders 👥: Long-term bulls 🐮 vs. short-term bears 🐻 reflect split views ⚖️.
Trends 🔮: Short-term dip 📉, medium/long-term rally potential ⬆️.
Outlook 📝: Mildly bullish ⭐, favoring longs over 6-12 months 🐮.
⚠️Trading Alert : News Releases and Position Management 📰 🗞️ 🚫🚏
As a reminder, news releases can have a significant impact on market prices and volatility. To minimize potential losses and protect your running positions,
we recommend the following:
Avoid taking new trades during news releases
Use trailing stop-loss orders to protect your running positions and lock in profits
💖Supporting our robbery plan 💥Hit the Boost Button💥 will enable us to effortlessly make and steal money 💰💵. Boost the strength of our robbery team. Every day in this market make money with ease by using the Thief Trading Style.🏆💪🤝❤️🎉🚀
I'll see you soon with another heist plan, so stay tuned 🤑🐱👤🤗🤩

XAGUSD Trade Plan: 1D Support, Liquidity Grab, & Bullish Setup!Silver (XAGUSD) is currently exhibiting signs of being overextended, as evidenced by its recent price action on the daily and 4-hour timeframes. The metal has traded into a critical support zone, marked by previous lows on the daily chart. This zone represents a significant area of interest, as it has historically acted as a key level for buyers to step in. However, the current price action has dipped below these lows, eating into sell-side liquidity in the form of stop-loss orders placed beneath this level. This liquidity grab is a classic move often seen in markets before a potential reversal.
On the 15-minute timeframe, the price is consolidating within a range, suggesting a possible accumulation. A break above this range, accompanied by a bullish market structure shift, could signal the beginning of a reversal and provide a compelling buy opportunity. This aligns with the idea of a "spring" in Wyckoff theory, where price manipulates liquidity before reversing direction.
Traders should remain patient and wait for confirmation of a bullish breakout on the lower timeframe before entering long positions. Key factors to monitor include strong bullish momentum, a clear break of the range, and the formation of higher highs and higher lows. Until these conditions are met, caution is advised, as the current downtrend could persist. 📉➡️📈
Key Levels to Watch:
Support Zone: Previous daily lows (now acting as a liquidity zone).
Resistance Zone: The upper boundary of the current 15-minute range.
Trading Plan:
Wait for a break of the 15-minute range to the upside. 🚀
Look for a bullish market structure shift (higher highs and higher lows). 📊
Enter long positions with a tight stop-loss below the range low. 🛡️
Target key resistance levels on the 4-hour and daily timeframes for potential take-profit zones. 🎯
This analysis highlights the importance of patience and discipline in trading. While the current setup is promising, confirmation is key to avoid premature entries. As always, this is not financial advice, and traders should conduct their own due diligence before making any decisions. ⚠️

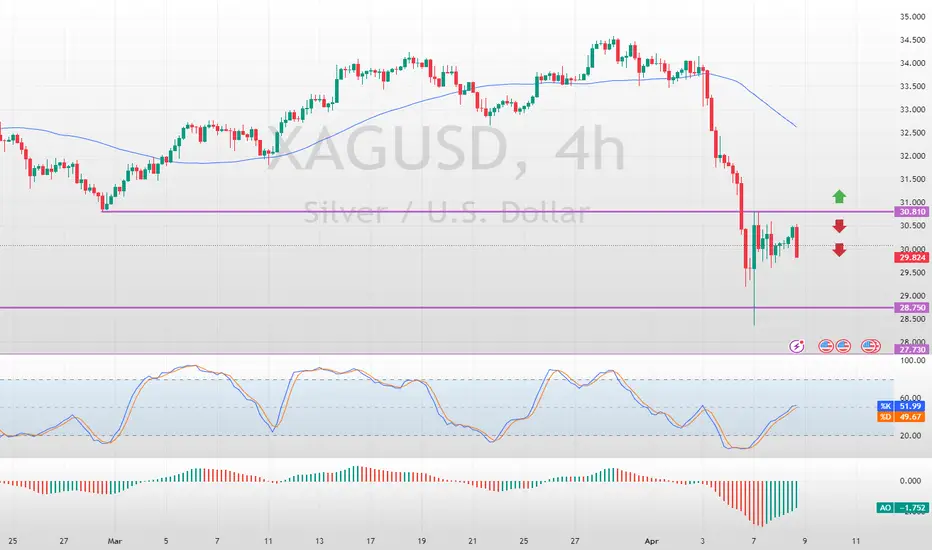
Silver Tested Key Resistance LevelFenzoFx—Silver tested the $30.81 resistance level today. If this holds, the downtrend may resume, targeting $28.75 and possibly $27.73 if selling pressure persists.
A bullish reversal could occur if XAG/USD exceeds and stabilizes above $30.81.
>>> Trade XAG/USD at FenzoFx Decentralized Forex Broker.
Silver’s Deep Retrace: Long Setup with Bullish Potential I’ve entered a long trade on Silver (XAG/USD) after observing a deep retrace to the 0.7 Fibonacci level on the daily timeframe. The entry at $28.96 is positioned strategically based on historical support and the current technical setup.
The stop loss is set at $26.54 to mitigate risk, while the take profit target is $36.00, aligning with a potential bullish continuation. In the bearish scenario, a break below $27.50 will prompt a reassessment and tighter risk management. Conversely, on the bullish side, breaking above $32.50 will strengthen the case for holding towards the TP.
Silver’s price action showcases its potential for a significant bounce back, supported by current geopolitical and macroeconomic conditions.
Fundamentals:
1. Federal Reserve’s Hawkish Stance:
The Fed’s updated projections for rate cuts in 2025 have pressured silver prices, as a stronger dollar and rising Treasury yields (above 4.5%) diminish the appeal of non-yielding assets. However, easing inflation in the long term could rejuvenate demand for precious metals.
2. Geopolitical Tensions:
Although silver traditionally benefits from uncertainty, recent macroeconomic headwinds, such as concerns about tariffs under the new Trump administration and sluggish global economic recovery, have overshadowed its safe-haven status.
3. Industrial Outlook:
Challenges in the industrial demand for silver, particularly from China’s solar panel production slowdown, add pressure. However, as inflation stabilizes and geopolitical risks unfold, silver could regain its industrial and safe-haven allure.
Technicals:
• Entry: $28.96
• Stop Loss: $26.54
• Take Profit: $36.00
• Key Levels:
• Bearish Scenario: Manage position below $27.50.
• Bullish Case: Strength above $32.50 confirms upward momentum.
This setup leverages a confluence of technical retracement, macroeconomic factors, and the potential for a trend reversal. Stay sharp and pay yourself as the market unfolds.
Note: Please remember to adjust this trade idea according to your individual trading conditions, including position size, broker-specific price variations, and any relevant external factors. Every trader’s situation is unique, so it’s crucial to tailor your approach to your own risk tolerance and market environment.

XAG/USD "The Silver" Metal Market Heist Plan(Scalping/Day Trade)🌟Hi! Hola! Ola! Bonjour! Hallo! Marhaba!🌟
Dear Money Makers & Robbers, 🤑💰✈️
Based on 🔥Thief Trading style technical and fundamental analysis🔥, here is our master plan to heist the XAG/USD "The Silver" Metal Market. Please adhere to the strategy I've outlined in the chart, which emphasizes short entry. Our aim is the high-risk Green Zone. Risky level, oversold market, consolidation, trend reversal, trap at the level where traders and bullish robbers are stronger. 🏆💸"Take profit and treat yourself, traders. You deserve it!💪🏆🎉
Entry 📈 : "The heist is on! Wait for the MA breakout then make your move at (33.500) - Bearish profits await!"
however I advise to Place sell stop orders above the Moving average (or) after the Support level Place sell limit orders within a 15 or 30 minute timeframe most NEAREST (or) SWING low or high level.
📌I strongly advise you to set an "alert (Alarm)" on your chart so you can see when the breakout entry occurs.
Stop Loss 🛑: "🔊 Yo, listen up! 🗣️ If you're lookin' to get in on a sell stop order, don't even think about settin' that stop loss till after the breakout 🚀. You feel me? Now, if you're smart, you'll place that stop loss where I told you to 📍, but if you're a rebel, you can put it wherever you like 🤪 - just don't say I didn't warn you ⚠️. You're playin' with fire 🔥, and it's your risk, not mine 👊."
📌Thief SL placed at the nearest/swing High or Low level Using the 1H timeframe (34.200) Day/Scalping trade basis.
📌SL is based on your risk of the trade, lot size and how many multiple orders you have to take.
Target 🎯: 32.800 (or) Escape Before the Target
🧲Scalpers, take note 👀 : only scalp on the Short side. If you have a lot of money, you can go straight away; if not, you can join swing traders and carry out the robbery plan. Use trailing SL to safeguard your money 💰.
XAG/USD "The Silver" Metal Market Heist Plan (Scalping/Day Trade) is currently experiencing a Neutral trend., driven by several key factors.👇
📰🗞️Get & Read the Fundamental, Macro, COT Report, Quantitative Analysis, Sentimental Outlook, Intermarket Analysis, Future trend targets.. go ahead to check 👉👉👉🔗
⚠️Trading Alert : News Releases and Position Management 📰 🗞️ 🚫🚏
As a reminder, news releases can have a significant impact on market prices and volatility. To minimize potential losses and protect your running positions,
we recommend the following:
Avoid taking new trades during news releases
Use trailing stop-loss orders to protect your running positions and lock in profits
💖Supporting our robbery plan 💥Hit the Boost Button💥 will enable us to effortlessly make and steal money 💰💵. Boost the strength of our robbery team. Every day in this market make money with ease by using the Thief Trading Style.🏆💪🤝❤️🎉🚀
I'll see you soon with another heist plan, so stay tuned 🤑🐱👤🤗🤩

SILVER LONG/BUYBy utilizing Fibonacci retracement levels, historical patterns, , we can formulate a hypothesis that the market might follow a similar trajectory if bullish sentiment prevails.

SILVER - Important BreakoutHello Traders !
The Silver price broke the resistance level (33.390 - 32.900).
This key level becomes new support !
So, I expect a bullish move🚀
______________
TARGET: 34.400🎯

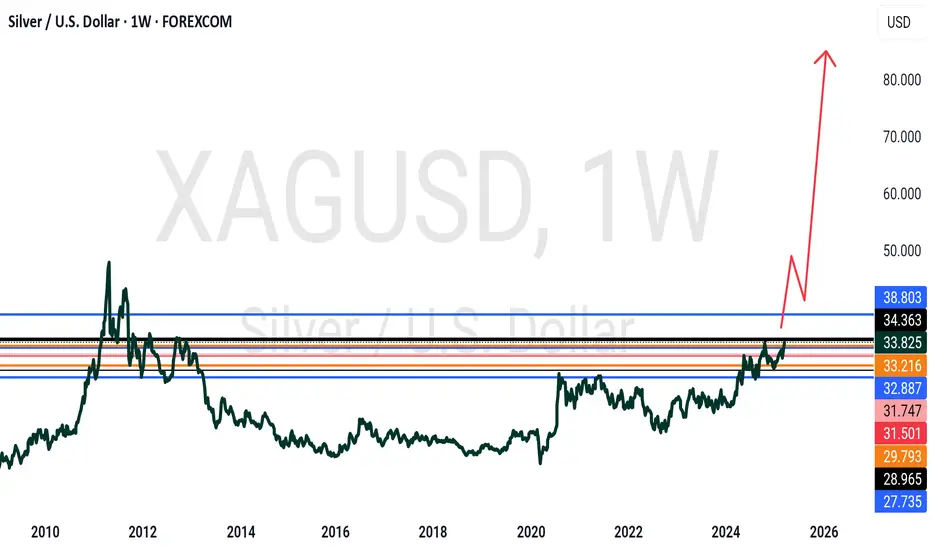
Silver Approaching ATH – Major Breakout Incoming?Silver is showing a strong bullish structure on the weekly timeframe. The price has been consistently forming Higher Highs (HH) and Higher Lows (HL), respecting a long-term ascending trendline that’s acting as dynamic support. This trendline has held multiple pullbacks, confirming strong underlying demand.
Currently, Silver is approaching its All-Time High (ATH) resistance near $34.83 while testing the upper resistance trendline of an ascending channel. A clean breakout above this level could trigger a major rally, potentially setting a new ATH. If the price faces rejection, a healthy pullback toward the support zone around $30 could offer another long-entry opportunity.
The structure remains bullish as long as Silver holds above the trendline support. A successful breakout above $34.83 could lead to a strong bullish continuation.
Still DYOR, NFA
Found this analysis helpful? Don’t forget to like, drop a comment, and follow us for more insights. Thanks for the love!

Silver Insights: Aggressive Strategies and Bullish SentimentHello, friends! I’m excited to share some observations on Silver.
Yesterday, I came across a couple of intriguing portfolios focused on this metal.
The first one is an aggressive call spread at $40-$40.25, while the second portfolio is a "butterfly" spread, positioned slightly lower.
Both portfolios are designed to capitalize on price movement, but the first one could yield a threefold profit with just a little push in its direction. The second one, however, will require some time and ideally needs to reach around $38 by the end of April.
From a technical standpoint, the chart shows a "spring compression", which often leads to the emergence of such portfolios. While I don’t place too much weight on predictive elements, the sentiment remains bullish.
Stay tuned, plan your trades and let’s see how this unfolds!
Always do your own research but do no hesistate visit us to leverage the comprehensive analysis from our team to enhance your trading advantage! 💪💼

XAGUSDBullish trend to continue. Consolidation box breakout. Target should be 34.235 with SL at 33.505

GOLD TO SILVER RATIO ABOUT TO TOP OUT !!OANDA:XAUXAG The current Gold rush and the weak demand in Retail for Silver, Platinum or even Palladium clearly shows that Gold TVC:GOLD is heading for a double top in the coming two to three months against Silver TVC:SILVER , after which Silver will start having the upper hand and totally outperform Gold (add in Platinum and Palladium as well). This would also perfectly coincide with my editorial Silver prediction to break the $45-50 barrier in 2027 from a year ago:

SILVER entered critical zone#xagusd #silver price has been moving well, greed is increased slightly. Now, as seen in the chart, TVC:SILVER must breakout above 36 usd region permanently to be super bullish. Hard declination may cause heavy corrective wave.

Silver is in the bullish trend after testing supportHello Traders
In This Chart XAGUSD HOURLY Forex Forecast By FOREX PLANET
today XAGUSD analysis 👆
🟢This Chart includes_ (XAGUSD market update)
🟢What is The Next Opportunity on XAGUSD Market
🟢how to Enter to the Valid Entry With Assurance Profit
This CHART is For Trader's that Want to Improve Their Technical Analysis Skills and Their Trading By Understanding How To Analyze The Market Using Multiple Timeframes and Understanding The Bigger Picture on the Charts

SILVER- very aggressive move expected, what's next??#SILVER... Market just broke his current resistance area, that was actually 32.40
So keep close it and if market hold 32.40 then it can leads you towards 3 digits.
Yes it can be 100 plus
Good luck
trade wisely
XAG/USD "The Silver" Metal Market Bullish Heist Plan🌟Hi! Hola! Ola! Bonjour! Hallo! Marhaba!🌟
Dear Money Makers & Robbers, 🤑💰🐱👤🐱🏍
Based on 🔥Thief Trading style technical and fundamental analysis🔥, here is our master plan to heist the XAG/USD "The Silver" Metal market. Please adhere to the strategy I've outlined in the chart, which emphasizes long entry. Our aim is the high-risk Red Zone. Risky level, overbought market, consolidation, trend reversal, trap at the level where traders and bearish robbers are stronger. 🏆💸Book Profits Be wealthy and safe trade.💪🏆🎉
Entry 📈 : "The vault is wide open! Swipe the Bullish loot at any price - the heist is on!
however I advise placing Buy limit orders within a 15 or 30 minute timeframe. Entry from the most recent or closest low or high level should be in retest.
Stop Loss 🛑: Thief SL placed at 31.8000 (swing Trade Basis) Using the 2H period, the recent / nearest low level.
SL is based on your risk of the trade, lot size and how many multiple orders you have to take.
Target 🎯: 34.5000 (or) Escape Before the Target
🧲Scalpers, take note 👀 : only scalp on the Long side. If you have a lot of money, you can go straight away; if not, you can join swing traders and carry out the robbery plan. Use trailing SL to safeguard your money 💰.
📰🗞️Fundamental, Macro, COT, Sentimental Outlook:
XAG/USD "The Silver" Metal market is currently experiencing a bullish trend,., driven by several key factors.
💎Market Overview
Current Price: 32.6000
30-Day High: 34.5000
30-Day Low: 30.5000
30-Day Average: 31.5000
Previous Close Price: 32.2000
Change: 0.4000
Percent Change: 1.24%
💎Fundamental Analysis
Supply and Demand: Global silver demand is expected to increase by 10% in 2025, driven by growing demand for silver in industrial applications and investment products.
Mine Production: Global silver mine production is expected to decrease by 5% in 2025, driven by declining ore grades and mine closures.
Recycling: Silver recycling is expected to increase by 15% in 2025, driven by growing demand for silver and increasing recycling rates.
Investment Demand: Investment demand for silver is expected to increase by 20% in 2025, driven by growing investor interest in precious metals.
💎Macro Economics
Global Economic Trends: The ongoing global economic recovery is expected to drive up demand for silver, driven by increasing investor confidence.
Inflation Rate: Global inflation is expected to rise to 3.8% in 2025, potentially increasing demand for silver as a hedge against inflation.
Interest Rates: Central banks are expected to maintain low interest rates in 2025, potentially increasing demand for silver.
Commodity Prices: Commodity prices are expected to rise by 5% in 2025, driven by increasing demand for raw materials.
💎COT Data
Non-Commercial Traders (Institutional):
Net Long Positions: 65%
Open Interest: 120,000 contracts
Commercial Traders (Companies):
Net Short Positions: 25%
Open Interest: 60,000 contracts
Non-Reportable Traders (Small Traders):
Net Long Positions: 10%
Open Interest: 15,000 contracts
COT Ratio: 2.6 (indicating a bullish trend)
💎Sentimental Outlook
Institutional Sentiment: 70% bullish, 30% bearish
Retail Sentiment: 65% bullish, 35% bearish
Market Mood: The overall market mood is bullish, with a sentiment score of +60
💎Future Market Data
3-Month Forecast: 35.0000 - 38.0000
6-Month Forecast: 38.0000 - 42.0000
12-Month Forecast: 42.0000 - 50.0000
💎Next Move Prediction
Bullish Move: Potential upside to 36.0000-38.0000.
Target: 38.0000 (primary target), 40.0000 (secondary target)
Next Swing Target: 42.0000 (potential swing high)
Stop Loss: 29.5000 (below the 30-day low)
Risk-Reward Ratio: 1:2 (potential profit of 5.4000 vs potential loss of 2.7000)
💎Overall Outlook
The overall outlook for XAG/USD is bullish, driven by a combination of fundamental, technical, and sentimental factors. The expected increase in global silver demand, decreasing mine production, and bullish market sentiment are all supporting the bullish trend. However, investors should remain cautious of potential downside risks, including changes in global economic trends and unexpected regulatory developments.
⚠️Trading Alert : News Releases and Position Management 📰 🗞️ 🚫🚏
As a reminder, news releases can have a significant impact on market prices and volatility. To minimize potential losses and protect your running positions,
we recommend the following:
Avoid taking new trades during news releases
Use trailing stop-loss orders to protect your running positions and lock in profits
📌Please note that this is a general analysis and not personalized investment advice. It's essential to consider your own risk tolerance and market analysis before making any investment decisions.
📌Keep in mind that these factors can change rapidly, and it's essential to stay up-to-date with market developments and adjust your analysis accordingly.
💖Supporting our robbery plan will enable us to effortlessly make and steal money 💰💵 Tell your friends, Colleagues and family to follow, like, and share. Boost the strength of our robbery team. Every day in this market make money with ease by using the Thief Trading Style.🏆💪🤝❤️🎉🚀
I'll see you soon with another heist plan, so stay tuned 🤑🐱👤🤗🤩

SILVER MCX OUTLOOK MARCH 2025SILVER MCX:
The Worlds Most Underperforming Asset SILVER, has started to gain some momentum. Today on 13th March 2025 (Thursday) cross all time highs and touched phychological level of 1Lac per Kilogram in INR.
We are currently mildly bullish on Silver MCX, its trading in a rising Wedge Techical Pattern which and expect SILVER to touch levels of wedge pattern Resistance of 1,03,200/- Per Kg (Marked on the Chart) in Next 15 to 20 Days. Currently Weaks low of 96355 should be Stoploss for the long traders.
SILVER is a very volatile commodities do not forget to place stoploss.

Silver finally has a silver lining for 2025 After all my bearishness with market analysis.
There is one metal that is showing semblance of hope and upside.
Gold's baby sister to follow along a Resource train in 2025.
Silver.
Now there are a few reasons we've seen upside inccluding:
Inflation Hedge:
Investors are buying silver as a hedge against rising inflation, keeping prices on the up and up 💰📈
Safe Haven Demand:
With market uncertainty, more people are flocking to silver as a safe haven, pushing its price higher 🛡️🚀
Industrial Demand Boost:
Growing industrial uses in tech and renewable energy are boosting demand for silver, driving prices up ⚙️🔋
Supply Constraints:
Limited mine output and slow supply growth are tightening the market, adding upward pressure on silver ⛏️📉
Bullish Market Sentiment:
Technical trends and positive investor sentiment signal that silver's rally is likely to continue upward 🔮📊
And of course the TECHNICALS agree.
We have seen a price break above the rim of the CUp and Handle.
The price is above the 20MA and 200MA.
So we can see the price is heading up!
What are you thoughts?
Disclosure: I am part of Trade Nation's Influencer program and receive a monthly fee for using their TradingView charts in my analysis.

Recession Fears Extend Silver RallySilver is trading around $33.30 per ounce during Thursday's Asian session, maintaining its upward momentum for the third consecutive session. The precious metal is benefiting from increased safe-haven demand, supported by rising trade tensions and concerns over a potential US recession.
If silver breaks above $32.75, the next resistance levels are $33.15 and $33.80. On the downside, support is at $31.00, with further levels at $30.20 and $29.75 if selling pressure increases.

XAG/USD "The Silver" Metal Market Bearish Heist Plan🌟Hi! Hola! Ola! Bonjour! Hallo! Marhaba!🌟
Dear Money Makers & Robbers, 🤑💰🐱👤🐱🏍
Based on 🔥Thief Trading style technical and fundamental analysis🔥, here is our master plan to heist the XAG/USD "The Silver" Metal Market. Please adhere to the strategy I've outlined in the chart, which emphasizes short entry. Our aim is the high-risk Green Zone. Risky level, oversold market, consolidation, trend reversal, trap at the level where traders and bullish thieves are getting stronger. 🏆💸Book Profits Be wealthy and safe trade.💪🏆🎉
Entry 📈 : "The heist is on! Wait for the breakout (32.0000) then make your move - Bearish profits await!"
however I advise placing Sell Stop Orders below the breakout MA or Place Sell limit orders within a 15 or 30 minute timeframe. Entry from the most recent or closest low or high level should be in retest.
I Highly recommended you to put alert in your chart.
Stop Loss 🛑: Thief SL placed at 32.8000 (swing Trade Basis) Using the 2H period, the recent / swing high or low level.
SL is based on your risk of the trade, lot size and how many multiple orders you have to take.
Target 🎯: 31.2000 (or) Escape Before the Target
Scalpers, take note 👀 : only scalp on the Short side. If you have a lot of money, you can go straight away; if not, you can join swing traders and carry out the robbery plan. Use trailing SL to safeguard your money 💰.
📰🗞️Fundamental, Macro, COT, Sentimental Outlook:
XAG/USD "The Silver" Metal Market is currently experiencing a Neutral trend., driven by several key factors.
🔱Fundamental Analysis
Fundamental factors driving XAG/USD include supply-demand dynamics, industrial usage, and monetary policy.
Interest Rates:
U.S. Federal Reserve: Rates likely at 3-3.5% in Feb 2025, with cuts from 2024 highs (4.5-5%). Lower real yields support silver, though a strong USD caps gains.
Impact: Neutral to mildly bullish for silver as yields decline.
Inflation:
U.S.: Inflation at ~2.5-3%, above the Fed’s 2% target, driving safe-haven and inflation-hedge demand for silver.
Impact: Bullish, though tempered by industrial demand sensitivity.
Industrial Demand:
Silver’s use in solar panels, electronics, and EVs remains strong. Global green energy push (e.g., U.S. infrastructure spending) boosts demand.
Supply: Mining output stable, but disruptions (e.g., Peru strikes) could tighten supply.
Impact: Strongly bullish if industrial growth persists.
Geopolitical Factors:
U.S.-China trade tensions and Trump’s 2025 tariff policies may enhance silver’s safe-haven appeal while boosting Japan/EM currencies, indirectly pressuring USD.
Impact: Mildly bullish.
Gold Correlation:
XAU/USD (gold) often leads XAG/USD. If gold holds above $2600, silver benefits from spillover demand.
Impact: Bullish if gold trends higher.
🔱Macroeconomic Factors
Broader macro trends influencing XAG/USD:
USD Strength: A strong USD (DXY ~100-102) pressures silver, but Fed easing could weaken it to 98-99, supporting XAG/USD.
Global Growth: Projected at 3% for 2025 (per Morgan Stanley), with U.S./China slowdowns offset by India/EU recovery. Industrial metals like silver benefit.
Commodity Prices: Stable oil (~$70/barrel) and copper prices support industrial metals, indirectly lifting silver.
Risk Sentiment: Risk-off flows (e.g., U.S. recession fears) favor silver as a hybrid safe-haven/industrial asset.
🔱Commitments of Traders (COT) Data
Large Speculators: Net long silver contracts at ~50,000 (down from 70,000 in 2024), suggesting reduced bullish bets but no major unwind.
Commercial Hedgers: Net short ~60,000 contracts, hedging production, indicating steady supply expectations.
Open Interest: ~120,000 contracts, rising slightly, implying growing market interest.
Key Insight: Speculative longs cooling off, but no bearish capitulation—supports range-bound or mildly bullish moves.
🔱Market Sentiment Analysis
Sentiment reflects trader psychology:
Retail Sentiment: Assume 60% of retail traders are long XAG/USD (per broker data), with shorts at 32.5000. Contrarian signals hint at downside risk if longs unwind.
Social Media: Mixed sentiment—bullish posts on industrial demand vs. bearish takes on USD strength.
Broker Data: IG Client Sentiment might show 55% long, suggesting mild overcrowding and potential pullback risk.
🔱Positioning Analysis
Combines COT and sentiment:
Speculative Positioning: Net longs suggest cautious optimism, targeting 33.0000-34.0000.
Retail Crowding: Longs clustered at 32.5000-32.7000, risking a stop-loss flush if price dips.
Institutional Flows: Hedge funds likely balanced, with longs eyeing industrial catalysts and shorts betting on USD resilience.
🔱Next Trend Move Outlook
Technical View: At 32.4000, XAG/USD is near its 50-day SMA (32.3000) and below the 200-day SMA (31.9000), indicating consolidation. Support at 31.8500 (38.2% Fibonacci from 26.50-34.87), resistance at 33.0000.
Short-Term (1-2 Weeks): Range-bound between 31.8500-33.0000 unless Fed rhetoric or industrial data shifts sentiment.
Medium-Term (1-3 Months): Upside to 34.0000 if USD weakens or industrial demand spikes; downside to 30.5000 on risk-off/USD strength.
Triggers: Bullish—strong U.S. PPI data or gold rally; Bearish—hawkish Fed or China slowdown.
🔱Overall Summary Outlook
XAG/USD at 32.4000 reflects a balanced outlook. Fundamentals favor upside from industrial demand and inflation hedging, tempered by USD strength and Fed policy uncertainty. Macro trends support silver via global growth and commodity stability, though risk-off shifts could weigh. COT data shows cautious speculation, while sentiment and positioning hint at short-term choppiness. The next move likely stays range-bound (31.8500-33.0000) short-term, with a medium-term bias toward 34.0000 if bullish catalysts emerge. Watch Fed statements, USD moves, and industrial data for direction.
⚠️Trading Alert : News Releases and Position Management 📰 🗞️ 🚫🚏
As a reminder, news releases can have a significant impact on market prices and volatility. To minimize potential losses and protect your running positions,
we recommend the following:
Avoid taking new trades during news releases
Use trailing stop-loss orders to protect your running positions and lock in profits
💖Supporting our robbery plan will enable us to effortlessly make and steal money 💰💵 Tell your friends, Colleagues and family to follow, like, and share. Boost the strength of our robbery team. Every day in this market make money with ease by using the Thief Trading Style.🏆💪🤝❤️🎉🚀
I'll see you soon with another heist plan, so stay tuned 🤑🐱👤🤗🤩

Silver is in the bullish trend after testing supportHello Traders
In This Chart XAGUSD HOURLY Forex Forecast By FOREX PLANET
today XAGUSD analysis 👆
🟢This Chart includes_ (XAGUSD market update)
🟢What is The Next Opportunity on XAGUSD Market
🟢how to Enter to the Valid Entry With Assurance Profit
This CHART is For Trader's that Want to Improve Their Technical Analysis Skills and Their Trading By Understanding How To Analyze The Market Using Multiple Timeframes and Understanding The Bigger Picture on the Charts

$SILVER Head & Shoulders Silver Head & Shoulders with Bearish Divergence on the Weekly at long term resistance...

Xag/Usd Short Idea I was anticipating price to get to 31.847 yesterday but it didn't. Maybe my point of interest is going to get triggered today.
Anticipating a nice rejection in that zone then I'll short silver down to clear some liquidities resting below.
Kindly boost if you find this insightful 🫴
