SILVER (XAGUSD) Key Levels to Watch 🪙
A lot of questions about Silver:
here is my latest structure analysis and key levels for you to watch.
Support 1: 18.72 - 18.95 area
Support 2: rising trend line
Resistance 1: 19.8 - 20.01 area
Resistance 2: 21.06 - 21.23
Consider these structures for pullback/breakout trading.
❤️If you have any questions, please, ask me in the comment section.
Please, support my work with like, thank you!❤️
Silveranalysis

SILVER BUY IDEAHello Traders!!!
We are currently seeing another bullish corrective leg ending and we are likely to see a bullish impulsive leg happening right away a simple ABC pattern here on the Silver/Dollar pair.
We have earlier spotted a demand zone which failed from previous post and now we are currently in our last point of demand so if this holds we are more likely to see silver reach 22.00 level

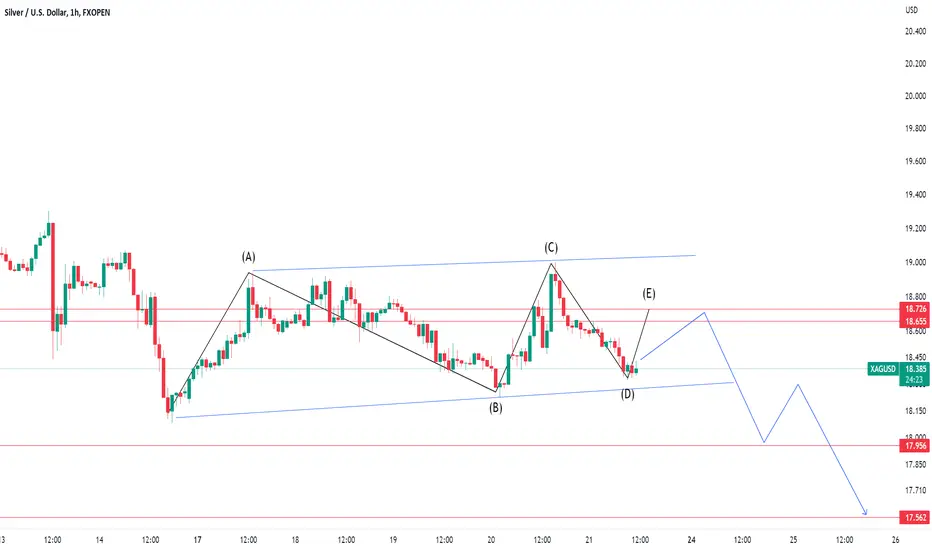
Silver triple top patternSilver formed triple top pattern
In my opinion the next level down will come soon
Good luck

Silver update Why i dont give so much trade on silver
Its clear that silver will play in a range of 19-19.6
Maximum 20$
But looking at daily chart it forming a head and shoulders which means we can go down more
Furthermore , FED is still damaging the market by raising rates .
Iam only trade on selling side i think now its in selling point area
GOOD LUCK

Silver analysis: How far the bear market rally might go?Silver is in the midst of a bear market rally, up 8% in the last two weeks and 13% since the end-of-August lows.
Although silver prices are still 23% below the peak reached in March, recent price movements suggest that silver is attempting to make a trend reversal at these levels.
Slowing market pricing for Fed interest rates next year has prompted the rally in silver prices over the past weeks. Investors reduced their forecasts for interest rates in the second half of 2023, and in the last week they priced in a first drop of 25 basis points after Fed funds are expected to reach a high of 4.9% in the first quarter of 2023.
An asset like silver that is extremely vulnerable to US interest rates has been granted some breathing room by both the decrease in Treasury yields – the US 10y yield has dropped by 30 basis points in the past week – and the weakening of the US dollar – with the DXY index falling below 110. Silver has been strongly and inversely correlated with the US dollar performance throughout the year.
The Federal Reserve meeting next week poses a concern because it could reignite hawkish arguments about the need to curb inflationary increases, which might halt the silver's rally. However, understanding how likely the Fed views a recession in 2023 will be critical, given the market builds many of its expectations for the conclusion of the hiking cycle next year on this matter.
A new attempt to break the 23.6% Fibonacci retracement level (2022 max-min range) can be seen on the daily silver technical chart. Sellers fought back hard at this level in September, pushing prices below the $19.7–20 zone. This level was breached in early October, causing prices to rise to $21.1-21.2 (38.2% Fibonacci).
Momentum indicators indicate that bullishness is gaining traction. The 14-day RSI surpassed 50 days once more, and the MACD indicates a bullish crossover close to the zero line.
If silver is successful in breaking over $19.8, a new overshoot toward $21.1 or $21.6 (200-day moving average) is possible. At that point, sellers might resume offering fierce pushback. Next Wednesday, a very hawkish Federal Reserve could return to exert downward pressure, leading to a retest of the 18.2 support level.
Idea written by Piero Cingari, forex and commodity analyst at Capital.com

░🔮░SILVER FORECAST | 1W ░🔮░COMEX:SI1!
Eve is out sick right now (I temporarily broke her during an update). So I am posting solo no Eve, no Gordon.
I placed layed this forecast out in May when I posted this 30 day forecast. That played out here:
So far this one is looking good and very accurate.
What do you think? Will this forecast play out? Will we see (around) double the price in Oct 2023?

//Bullish Silver ChartThis Compression Set shows Silver being poised and Ready to Break O U T !! Long

Silver updateWe wait the back test to 19$ and buy there
Our levels will be 19.3 -19.6-20 -21 maximum
I think from 21 will dump hard
200 MA still a problem for silver
GOOD LUCK

Silver update Have been rounding around our target 19$
Now its clear that its going to 18.8 $
I will update if any confirmation occur in price
GOOD LUCK

SILVER (XAGUSD) Potential Pullback 🪙
Silver reached a peculiar confluence zone yesterday.
We see a perfect match between a horizontal demand zone and 382 retracement of the last bullish impulse.
I expect a bullish movement to 19.62
❤️If you have any questions, please, ask me in the comment section.
Please, support my work with like, thank you!❤️

Sell silverWe sell silver to 18.8
And then we may buy
Failed to pass 19.3
Back test is a must
Good luck

Silver view Silver will go down sooner or later (Fact)
First , dollar still not finished it run .
Second , false candle in monthly , weekly ,daily (mentioned above )
Third , raising rate and rightening .
Forth , chart pattern shows we must retrace the same percentage of consolidation
Any ways if we dont cross 21 $ dollars we will come back easily to 18 $
Thats my over all view
GOOG LUCK

Silver update Its ok to have a wrong trade , but not to stuck in trade is more important .
We sold 18.6-19 $
It will come back again one week maximum and then we collect profit when it reach 17.5 $ minimum low target
21 $ can be a target in Monday session
We will buy up to 20-21 maximum ill inform and update .
GOOD LUCK


silver analysisWe have a downward silver trend and the possibility of forming such a pattern!
OANDA:XAGUSD
Silver update Silver is a sell today
We wait to test the 18 maybe today we will teat it
If its go up a little its a sell reward
Dont buy it today
GOOD LUCK

Silver prepare to sell hard We can make lower low
We bought this morning was a good profit now prepare to sell within 30 min or now
Target the day low
GOOD LUCK

Silver update Continuation to 18.8 is possible
We still way far in our target minimum target is 19.3 $
I believe its now for buying even with trading
Safety trades now in buying
GOOD LUCK

Taf's Gun to the HeadTrade Idea : Buy Silver at market
Reasoning: Medium term trend line stretching from 1 September was resepected multple times and we could respect it again now.
Entry:18.446
TP:19.000
SL:18.199
RR:2.24
Disclaimer – Signal Centre. Please be reminded – you alone are responsible for your trading – both gains and losses . There is a very high degree of risk involved in trading. The technical analysis , like all indicators, strategies, columns, articles and other features accessible on/though this site is for informational purposes only and should not be construed as investment advice by you. Your use of the technical analysis , as would also your use of all mentioned indicators, strategies, columns, articles and all other features, is entirely at your own risk and it is your sole responsibility to evaluate the accuracy, completeness and usefulness (including suitability) of the information. You should assess the risk of any trade with your financial adviser and make your own independent decision(s) regarding any tradable products which may be the subject matter of the technical analysis or any of the said indicators, strategies, columns, articles and all other features.

Silver Has Not Bottomed YetThere is a probability silver might test the green box. Thats below 17. There I can be sure XagUsd has bottomed. Overall I’m bullish silver. It will be $90-$100 in 2020s.

Silver over view Before its formed a head and shoulder pattern and its look like inverse pattern now .
Two scenario here :
First , we go to 19 area and drop so its consolidation pattern .
Or we go up to 21 as its reverse head and shoulder pattern .
Otherwise , if it drop bellow 17 it will go to 14 $ sooner or later .
GOOD LUCK
I THINK BUYING HERE IS GOOD ALSO

Silver , we buyLets make it clear silver is over sold in couple time frames
Risking the sell at that point can be dangerous.
We buy gradually in red lines we sell the blue .
We might have drop again ill inform you, now its a buy to me
GOOD LUCK
