short silver near 17.47/17.53 Target 17.00Short silver near 17.47/17.53 Sl above 17.60 Target 17.00 Thanks just Trade with proper money management.
Silvercharts

Short silver near 18.10/18.13 sl above 18.20 Target 17.74Short silver near 18.10/18.13 sl above 18.20 tp 17.74 Thanks

XAGUSD Weak DowntrendPerfect touches on the EMA line, a retest is possible however I think this weak downtrend will be broken after a small pullback from the double top formed, silver may follow gold and palladium in its recent bullish nature. A bearish triangle can also be observed.

Waiting for SilverIf you like this idea, don't forget to support it clicking the Like Button!
Hi guys. This idea is a long term analysis of the Silver bullish trend (probably bullish).
My tactic for silver is to wait until the point (C) is reached and to expect for candle confirmation of bullish trend continuation.
If you are looking for a short-term trade on Elliott corrective waves, I suggest you look to the related copper idea.
Disclosure: My ideas contain statements and projections based on assumptions on capital markets, and therefore inherently subject to numerous risks and uncertainties.
Before buying or selling any stock you should do your own research and reach your own conclusion or consult a financial advisor. Investing includes risks, including loss of principal.
I am not a financial advisor.


Silver 4h short idea!XAGUSD potential short setup, price currently below 4h 50ma and has set a new lower low. Targeting the 127% fib extension. Look at my account for a big picture long trade idea

Silver Long Term Bullish Trend with 3 Possible Scenarios Currently bullish on silver with the following scenarios to be considered
A. Price breaks 18.20 resistance and continues higher to 18.70 or beyond
B. Short term pullback to 9ema zone before we continue higher and break resistance
C. A larger pullback to do more formal retest of the broken 17.40 area
All daily trend signals have flipped bullish (9ema, 20ma, ichi cloud twisting green), MACD also signaling green, the STOCHRSI is signalling a pullback in the near future.
Silver is a buy, any puts i'm in are for hedging.

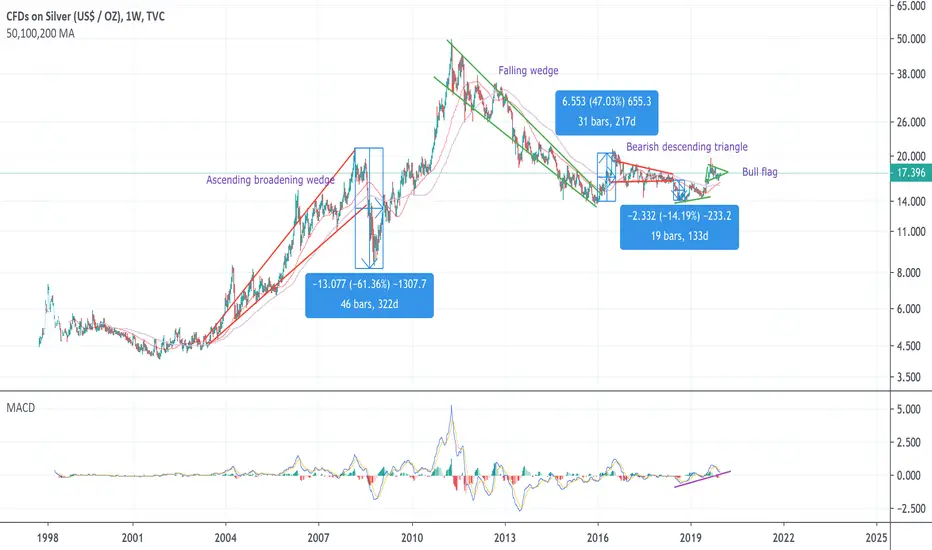
Silver Chart AnalysisIn this long term chart of silver, a ascending broadening wedge is present, which led to a bearish breakdown. A falling wedge which led to a bullish breakout. A bearish descending triangle, and a recently formed bull flag that may lead to further upsides. Rising MACD supports this idea.
SIL/SLV Ratio Favoring Silver BullsOne for the #silver bugs. The $SIL / $SLV ratio looking to post back-to-back weekly closes above horizontal resistance.
Silver miners outperforming silver: #notbearish

SILVER POTENTIAL TRADE OPPORTUNTIES Potential opportunities on silver for the next days. I will update following this analysis , so follow to get the notifications of potential trades entries :)

Silver & other commodities have more downside, SILVER TO $16.00!Commodities are feeling the downside pressure due to the strong US dollar, there is money flowing out safe-haven assets into the equity market since it's been climbing to all-time highs.
Silver forms a very interesting pattern and has been doing so since the start of September when it fell drastically from the strong rally. The pattern involves a strong 1-2-day drop then consolidation, slight pop into the broken support now resistance then another stern drop forming a downward channel for the past 3-4 months.
We expect the continuation, a slight slow pop on weak volume into $17.45 resistance based on the broken low and top of the channel then strong drop through $16.75 into $16.00 potentially.
Disclaimer: This idea is for educational purposes only, this is not a definite trading/investing signal. Trading is risky and should be taken at your own accord.


Silver Breaks A Daily Downtrend Line And Ascending TriangleSilver prices recently broke out of a daily ascending triangle as well as a downtrend line. I believe that as long as Silver stays above the lower
trend line in the ascending triangle, it could move higher.

Silver Losing Momentum In silver, we had a strong move upwards from the $17/oz range to a high of roughly $19.755/oz. Recently, however, the price has failed to maintain momentum to regain those highs and has steadily pushed lower in an evident regression trend on the daily chart from 05 Sep 2019 to the present. I believe that silver will retest the $17/oz range, and from there, we will have a stronger confirmation on the short term direction of silver's price. As well the gold to silver ratio rebounded from a yearly low of roughly 1XAU:79.38XAG to currently 1XAU:84.89XAG. In the meantime, I believe silver to be a short trade. However, in the long run, silver seems to be bullish as the gold to silver ratio is at historical peak levels.

Silver Poised For A Mega MoveAt the time of publishing this research report, Gold is trading at $1488 and silver is at $17.50. Gold dropped more than 1% on Friday which makes the prices plunged from $1510 to $1480($30 move). The Donald J.trump tweet on Friday had a significant impact on the market in which he showed optimism ahead of his meeting with Chinese Vice Premier Liu He at the White House on Friday afternoon.
Please, note-Our Trading position for gold and silver is active in our portfolio.
Trump tweeted: “Good things are happening at China Trade Talk Meeting. Warmer feelings than in the recent past, more like the Old Days. I will be meeting with the Vice Premier today. All would like to see something significant happen!”
The announcement of a possible partial trade deal between the U.S. and China boosted investors' risk appetite which drove the stock market higher and pressured precious metals complex.
The Interest rate cuts has played a major role in the steep incline which we have witnessed in the precious metals complex however right now markets are pricing in a lesser chance of a rate cut in October, with the latest estimates from the CME FedWatch Tool projecting a 67% chance of a cut versus the 87% chance just a couple of days ago.
Old comments-You need to keep in mind that at the moment it seems that markets have gotten ahead of themselves and pricing in a more than 80% chance of looser U.S. monetary policy however if the fed won't cut rates or even if easing will get delayed then it will turn to be negative for the entire precious metals space.
Britain and the EU have fixed there next meeting on the Brexit deal which also helped to boost investors' risk appetite and brought positivity back into the market.
Old comments-Technical levels to watch out for, Advises and recommendation from Goldsilveranalyst
Although we understand all the factors mentioned which are supporting the price of Gold are still there including continuous fall in yields, geopolitical risks, fears of the industrial economy and notions of Quantitative easing coming from the major central banks of the world but despite the bullish momentum which we are witnessing,we have doubts about the sustainability of Gold's surge. Prices moved up substantially, and even though gold prices can reach $1585, we believe investors should lock in some profit at these levels.
Gold has had a great run over the last year, up 17%. It has been a perfect storm of sorts for Gold , especially on the interest-rate front. With long-term interest rates declining globally, Gold has been an attractive alternative to debt,"
Gold is an excellent alternative to any risk, including economic instability and geopolitical tensions. However, at these levels, Gold is just too expensive. The two metals we recommend considering right now are platinum and silver . Both are historically quite cheap versus Gold , and in our opinion, may offer more upside potential should gold keep grinding higher,".
"The price of platinum has mostly traded above the price of Gold , but that is not the case today. For those looking for an alternative to Gold , we recommend consideration of platinum and silver ,"
Summary-our macro research report suggests that the room for the equity market and the DXY to move higher from the level they are currently at- still exist,investors needs to be aware and cautioned what media is portraying and should research the market on there own,or should take the advise by the seasoned analysts however there shouldn't be any conflict of interest involved with in the advise itself. Even though the possibility for the equity market to grow even higher still exist we recommend investors to stay away from the stock indices as the reward doesn't worth the risk in itself. Our independent bias towards the precious metals complex remains bearish until gold breaks above $1,525 an ounce as breaking above would support more investors and traders to long gold with heavy conviction. Until that happens our bearish conviction will remain within the precious metal sector.
Data to watch
Next week’s biggest data release will be the U.S. retail sales on Wednesday, which are estimated to come in at 0.3% in September. The U.S. Beige book is also scheduled for publication on Wednesday.
“Retail sales are a key measure of optimism. Any weakness there should help gold .
Other key data sets to watch include the NY Empire State manufacturing index out on Tuesday and Thursday’s slate of numbers such as U.S. housing data, industrial production, and the Philly Fed manufacturing index.

Elliott Wave View: Has Silver Started the Next Leg HigherShort term Elliott Wave view suggests the rally in Silver (XAGUSD) to 17.79 ended wave (1) as a 5 waves impulse. The pullback to 17.24 in the metal ended wave (2) with the internal as a double zigzag. Down from 17.79, wave W ended at 17.27, wave X bounce ended at 17.64, and wave Y ended at 17.24. The metal has broken above wave (1) and resumed higher within wave (3).
Up from 17.24, wave ((i)) ended at 17.48, wave ((ii)) pullback ended at 17.31, wave ((iii)) ended at 17.8, and wave ((iv)) ended at 17.80, above from there it ended wave ((v)) of 1 at 18. Expect the metal to pullback in wave 2 of (3) in 3, 7, or 11 swing before the rally resumes. We don’t like selling Silver. As far as pivot at 17.24 low stays intact in the dips, expect the metal to extend higher.

Silver SLV XAG - Silver's up! Buy the dip. Buy physical silver!Silver looking good. Gold looking good. Bitcoin looking good. Litecoin looking good. I'm bullish on all of them.
I'd be stocking up on all of these, and get the real thing. Get the physical metal that you can hold in your possession. For cryptocurrency make sure you have your private keys.

SLV XAG Silver - Stop loss update, long the dipI'm playing silver in a bullish macro trend, so I'm still long. However we could see a significant pullback, shaking out weak hands and traders before a higher high. Short traders could be right depending on the degree of retracement.
However I'm not looking to short. I'm looking to long the pullback.


SILVERFirst a perfect reaction of the .382 swing high to swing low and now a rejection of the 618. Levels to watch are a possible triangle trendline but buying that trendline would be to risky. Better buy would breakout of the downtrend triangle with a retest. If we get back to the 382 at 17.4 we could either have a V-shape reaction or we could smash through, that would mean short the retest of the 382 with a target at 16.1 the 618 fib.


Silver Fundamental Analysis – September 16th 2019Here are the key factors to keep in mind today for Silver trades:
New Zealand Performance of Services Index: The New Zealand Performance of Services Index for August was reported at 54.6. Forex traders can compare this to the New Zealand Performance of Services Index for July which was reported at 54.8.
UK Rightmove House Prices: UK Rightmove House Prices for September decreased by 0.2% monthly and increased by 0.2% annualized. Forex traders can compare this to UK Rightmove House Prices for August which decreased by 1.0% monthly and which increased by 1.2% annualized.
Chinese Retail Sales: Chinese Retail Sales for August increased by 7.5% annualized. Economists predicted an increase of 7.9% annualized. Forex traders can compare this to Chinese Retail Sales for July which increased by 7.6% annualized.
Chinese Industrial Production: Chinese Industrial Production for August increased by 4.4% annualized. Economists predicted an increase of 5.2% annualized. Forex traders can compare this to Chinese Industrial Production for July which increased by 4.8% annualized.
Chinese Fixed Assets ex Rural: Chinese Fixed Assets ex Rural for August increased by 5.5% annualized. Economists predicted an increase of 5.7% annualized. Forex traders can compare this to Chinese Fixed Assets ex Rural for July which increased by 5.7% annualized.
Chinese Property Investment: Chinese Property Investment for August increased by 10.5% annualized. Forex traders can compare this to Chinese Property Investment for July which increased by 10.6% annualized.
Chinese Surveyed Jobless Rate: The Chinese Surveyed Jobless Rate for August was reported at 5.2%. Forex traders can compare this to the Chinese Surveyed Jobless Rate for July which was reported at 5.3%.
Final Italian CPI: The Final Italian CPI for August increased by 0.4% monthly and 0.4% annualized. Economists predicted an increase of 0.5% and of 0.5%. Forex traders can compare this to the Italian CPI for July which increased by 0.5% monthly and by 0.5% annualized. The Final Italian Harmonized Italian CPI for August was reported flat at 0.0% monthly and increased by 0.5% annualized. Economists predicted a decrease of 1.7% and an increase of 0.5%. Forex traders can compare this to the Italian Harmonized Italian CPI for July which decreased by 1.8% monthly and which increased by 0.5% annualized.
US Empire Manufacturing Index: The US Empire Manufacturing Index for September is predicted at 4.0. Forex traders can compare this to the US Empire Manufacturing Index for August which was reported at 4.8.
Should price action for Silver remain inside the or breakout above the 17.400 to 18.150 zone the following trade set-up is recommended:
Timeframe: D1
Recommendation: Long Position
Entry Level: Long Position @ 17.800
Take Profit Zone: 19.600 – 20.000
Stop Loss Level: 17.200
Should price action for Silver breakdown below 17.400 the following trade set-up is recommended:
Timeframe: D1
Recommendation: Short Position
Entry Level: Short Position @ 17.100
Take Profit Zone: 15.900 – 16.500
Stop Loss Level: 17.400
