Is SILVER run over? It appears that we are still in a massive bear channel and this was a bear market rally. Both TVC:GOLD and TVC:SILVER appear to be overbought. Silver is showing a massive weekly shooting star. Might see another leg up (within the channel)but then a decline to find another bottom. Looks like it got all the FOMOs out there. Unless we break out of this bear channel staying bearish.
Silvercharts

Silver Looks Friggin BullishHello Traders,
There has been a lot of talk about the precious metals recently (Gold / Silver) with many different reasons for the resurgent interest in precious metals ranging from the classic "store of value" to "finite resource" to "growing lack of trust in fiat currencies".
From a Fundamental Analysis point of view I don't really know anything about Silver apart from the basics so if you are reading this and know your stuff about Silver please put it in the comment section.
This chart is from a TA perspective.
Since the beginning of 2002 the price of Silver went on a bull run which peaked in April 2011. That run lasted about 10 years with gains in the region of 1125%. Very nice if you were long on Silver. From an Elliot Wave perspective the price printed a nice set of bullish impulse waves.
Then over the course of the next 4.5 to 5 years the price retraced to the 0.786 Fibonacci level, pretty much to the wick. WickHunter loves it when the market obeys Fibonacci. This entire move looks like a massive Wave 1 and Wave 2 has been completed and price is gearing up for a wave 3.
"If" this is the case and tbh that's exactly what it looks like, then Silver could go to the moon here.
I've used the Fibonacci extension tool on that wave 1/2 and plotted the 1.618, 2.618, 3.618 and 4.236 extensions as targets.
Nobody knows which of the targets will be hit, only time will tell.
WickHunter

Elliott Wave View: How High Can Silver Go?Since forming the low on November 2018 at $13.9, Silver has rallied 40% to current price of $19.4. The move higher from $13.9 low took the form of a 5 waves impulsive Elliott Wave structure. On the 1 hour chart below, we can see wave (4) pullback ended at $16.92. The metal has since resumed higher in wave (5) with subdivision as another impulse in lesser degree. Up from $16.92, wave 1 ended at $18.65 and wave 2 ended at $18.02.
Near term, while dips stay above $18.02, Silver should continue to see more upside. We don’t like selling Silver and expect buyers to appear to buy the dips in 3, 7, or 11 swing. This view is valid as far as pivot at $18.02 low stays intact in the first degree. Possible target to the upside is 2.618% Fibonacci extension from Nov 2018 low which comes at $20.2 – $20.3 area. This is likely going to end only wave ((3)) in higher degree from Nov 2018 low, so it won’t end the entire rally yet. After it reaches the target of $20.2 – $20.3, Silver has chance to do a larger pullback to around $18 – $19 in wave ((4)) before another leg higher to end 5 waves up from November 2018 low.
Silver Cup and Handle - $90.00 USD Target?Silver has a clear cup and handle formation present (and looking to be resolving) on the monthly chart.
Given the price action in silver recently (check out my earlier analysis which predicted this most recent surge as well as the move up in gold in July) it is worth looking at the longer-term trajectory for silver to determine whether we should be selling, buying or staying on the sidelines.
It is worth noting that pattern analysis is an art, not a science, however it is a fact that the longer the time frame the pattern is observed (e.g. monthly vs. daily patterns) the more validity is tends to have.
The measured move from the base of the cup to the ridge of the cup pattern projects an eventual target of close to $90.00 USD (well north of 300% from present levels)
With this in mind, this pattern will likely resolve over YEARS, not weeks or months, but given the strong tailwind that this could provide for silver and silver associated investments, it is worth considering how you will play (if at all) this market.

Silver impulseSilver hitting resistance here at the low volume node/.618 retrace and 1.618 extension of wave 1. Looking for a 4 wave retrace here, will buy the 3 wave correction and stop under the low. If we end up going deeper its possible this is more bullish as a 12 12, but we can let the action show us that. Its been a while since I have posted ill try to get some more charts out there, interesting times to be a trader!


SILVER- SHORT PLANShort Plan for Silver.
We have had a big run-up and are approaching a key confluence of sell zones.
Idea is to go short on the touch of sell zone marked in Dark blue on 4h inside a bigger sell zone red from weekly.

Elliott Wave View: Silver Remains SupportedShort Term Elliott Wave structure from the chart below suggests the rally in Silver to $17.5 ended wave (3). The metal then pullback in wave (4) to 16.91 with internal structure as a triangle. Triangle is labelled as ABCDE with subdivision of each leg in 3 waves. Triangle is therefore a 3-3-3-3-3 structure. In this case, wave A ended at 16.5, wave B ended at 17.39, wave C ended at 16.83, wave D ended at 17.19, and wave E ended at 16.91. We can also see each leg in the triangle subdivides in another 3 waves.
The metal has resumed higher in wave (5). Up from 16.91, wave 1 ended at 17.77 and wave 2 pullback ended at 17.49. Wave 1 subdivided as a 5 waves impulse structure. Wave ((i)) ended at 17.14 and pullback in wave ((ii)) ended at 16.96. Up from there, wave ((iii)) ended at 17.74, wave ((iv)) ended at 17.55, and wave ((v)) of 1 ended at 17.77. Silver still needs to break above 17.77 to confirm the next leg higher has started and avoid a double correction. We don’t like selling the metal. As far as pivot at 16.91 stays intact, expect Silver to extend higher.

Analysis of SILVER 27.08.2019The price above 200 MA, indicating a growing trend.
The MACD histogram is above the zero lines.
The oscillator Force Index is above the zero lines.
If the level of resistance is broken, you should follow the recommendations below:
• Timeframe: H4
• Recommendation: Long Position
• Entry Level: Long Position 17.800
• Take Profit Level: 18.150 (350 pips)
If the price rebound from resistance level, you should follow the recommendations below:
• Timeframe: H4
• Recommendation: Short Position
• Entry Level: Short Position 17.500
• Take Profit Level: 17.400 (100 pips)
USDJPY
A possible short position in the breakdown of the level 105.55
GOLD
A possible long position at the breakout of the level 1536.00
USDCHF
A possible long position at the breakout of the level 0.9815
GBPUSD
A possible long position at the breakout of the level 1.2255


Silver FTWTrend line from 2016 is well in tact and looks like this is the beginning of a significant upcycle. PM’s have always had an inverse relationship with equities and I watch the news closely to determine price targets. Trade war with China won’t have news until near end of August. I believe silver (and gold) will continue to rise until any news of resolution. No resolution = more bull.

MEDIUM TERM(XAUXAG): WAVE COUNT|BULLISH TARGETS+STRUCTURAL [TA]Commodity and Fixed Income Series : Part 1 Commodities ( Ratios+the most popular and widely traded Commodities )
The Essential note s from this chart are the following( Indicator analysis included in the comments ): {4.5 minute read}
To begin with the easiest part of the chart. The supports were identified on the quarterly chart which will be linked in the comments. There are 3 main support levels :1. ~80(RED LINE) 2. ~70-66(BLUE LINE) 3. ~58-60(GREEN LINE)
Somewhat more difficult part of the chart are the bullish targets . There are 2 main targets and 1 psychologica l. The 2 main targets were derived based on fibonacci extensions from the quarterly chart #1 ~94, #2 ~110 ; and the obvious psychological target is circa: 100 .
Q: What is the method used to label the Wave count?
-Following the ABC correction(2008-2011), gold has clearly outperformed silver. This is partially because of the new production methods that were introduced after 2012( more cost-effective extraction of silver as a byproduct while mining for other metals). In effect, this boosted the supply of silver relatively to gold; positively affecting the gold-to-silver ratio . Hence, the W-X-Y-X-Z Wave count fits the best into the current chart structure.
Q: Bullish on silver? - Not yet . As it can be observed from the chart, prior to the ABC correction(2008-2011) ; there was a boom in the demand for gold as the primary metal of value used as a protection against inflation . This pattern should occur during the next recession, yielding a potential target for the ratio of around ~110.
Other worthy notes: 2020 Election will have an impact on practically every market; Commodities are no exception . Nevertheless, in the medium term , I am relatively more bullish on silver in comparison to gold . This is supported by continuously downtrending volume as we progress through the bullish channel(pitchfork) . The ABC orange labelled correction is obviously a far fetched idea, since we do not know the timing nor the absolute top for the ratio yet. It's included just for the sake of general market principles.
P.S. I do realize the chart is quite hard to be understood, mostly because it is labelled to the smallest and extreme detail. If there are any poor understandings of the labels, I'd be able to answer any additional questions in the comment s.
>>I do not share my ideas for the likes or the views. This channel is only dedicated to well informed research and other noteworthy and interesting market stories.>>
However, if you'd like to support me and get informed in the greatest of details, every thumbs up or follow is greatly appreciated !
Step_Ahead_oftheMarket- {Make sure to check out my previous series on US(SPX) Sector including 11 episodes of the major US sectors}
This chart is a continuation to one of my most popular charts from last week:
Full Disclosure : This is just an opinion, you decide what to do with your own money. For any further references or use of my content for private or corporate purposes- contact me through any of my social media channels.

H4 LONG TRADE ON SILVER - TREND is your FRIENDQuick summary of how i usually view the markets.
In terms of market movement, i tend to view them as either Ranging or Trending market environments.
- Trending environment means that price has a general direction it is heading based on High Time Frames market structures. BULLISH Market structure refers to higher highs and higher lows, while BEARISH Market structure refers to
lower highs and lower lows.
- Ranging environment means that price usually just oscillates within the range with no clear direction. This is also refer to chopping markets, making it harder to trade since there is no clear trend. Hence, usually i drew up a range and
take trades around the range low / high and trade it to the other side. EG Long range low, targeting range high.
For spotting of trade opportunities, i look to take trades near High Time Frame structure. By refining my entry, stop loss and target based on Low Time Frame structure, i am able to maximize my Risk:Reward ratio of the trade setup by aligning with the Macro trend.
Setup type: H4 Significant Flag
Levels of confluence:
1) Weekly Range Low
2) H4 Demand zone proven itself previously when price dipped into it and rallied to make another higher high (Confirmation of demand)

Silver stackers should see a bounce shortlyThanks for viewing everyone.
This is typical TA, it might go up or it might go down (and I told you so in either case). But stick around anyway.
After silver's top of almost $50 in 2011 it has made a clearly identifiable ABC formation correction of the intervening 8 years. If you squint just right, you can see the 5 wave wave (C) down too (complete with shallow wave 4 triangle and deep wave 2 correction. Wave 4 does not cross-over any of wave 1 price action (orange box - that also denotes the steepest price change - normally seen in wave 3). Recently there is a bottom forming after a quick rise from $13.700 to over $21 and a slow and steady price drop back to the swing low (low of 13.635 in December 2015). What I tentatively expect is a bounce from that level to around $22 (hopefully higher - very possibly lower).
Retrospective fibonacci targets (to gauge if the correction is complete) are for wave (C) to equal wave (A) at ($13.768) and a 1.618 extension of wave 1 (at $17.032). Both have been met or exceeded. In my view this is a buy zone and I will be buying each month that the price is below $17.
A word of caution; looking back a little ways into the price history (not displayed) pre-1980 to today. Silver rose from a sub-$2 base to exceed $50 in 1980. It then completed an ABC correction down to mid $4 range. This was followed by a weak wave C bounce and then the price slowly sunk lower to bottom at $3.50 in 1992 (10 years later). So, while the count holds up the price still slipped slightly lower in $ terms (more in % terms) before trying to set a new higher high. So, what? So, I am prepared for a potentially very long accumulation phase (last one 20 years) and also a potential price subsidence to below $10 (which will not change my plan). Remember everyone, no weak hands okay. Silver has been seeing increasing industrial demand but has been dropping investment demand.
Why silver? Why not buy on an up-trending asset?
1. Silver is an asset with zero counter-party risk, and is my choice as a hedge against a (more plausible every day) debt crisis,
2. charts never repeat exactly, it could bounce strongly - but I don't expect it to set up for a new bull-run just yet,
3. The gold to silver ratio is indicative of silver being undervalued on a relative basis (hopefully when the GSR normalises to below 40 I will trade silver for gold - silver is my vehicle to acquire more gold,
4. If there is a currency / inflationary crisis, there will be little warning and I want to be in at the bottom for the next move up,
5. Silver is money,
6. COT commitment of traders reports show commercial traders reducing short positions significantly,
7. Commercial banks have created the worlds largest ever silver stockpiles - removing supply from the market.
Asset allocation: 50% fixed income instruments, 30% low PE ratio (low debt, high return, recession resistant) stocks, 5% diversified commodity ETF (at a 30 year low), 7.5% silver, 2.5% gold, and 5% crypto.
While I am here, I would like to plug bullionstar dot com in Singapore. They have low premiums, cheap vault storage of 0.59%pa (silver - lower for gold). E.g. A Johnson Matthey 100oz silver bar (as at right now- prices change per minute) is USD1545.05 for a low volume purchase on 1-9 bars (cheaper than one US based site I just checked at USD1575) and zero sales tax on bullion. I will likely choose their 1kg zero spread bar (at low volumes it has a spread but it is lower than normal) and possibly small nibbles from their bullion savings program BSP where I can buy as little as 1g at a time. I just thought I would pass than on because it took me a long time and searching multiple countries to find silver at a reasonable price.

Silver Elliott Wave View: Impulse Move Favoring More UpsideSilver rally from May 28, 2019 low is unfolding as an impulse Elliott wave structure favoring more upside to take place. The near-term pullback to $14.87 low ended wave ((ii)). Up from there, the metal made a strong rally to the upside and ended wave ((iii)) at $16.58 high. The internals of that rally unfolded in lesser degree 5 waves structure where wave (i) ended at $15.31 high. Wave (ii) pullback ended at $15.03 low, wave (iii) ended at $16.46 high. Then pullback to $16.22 low ended wave (iv) and a rally to $16.58 high ended wave (v).
Down from there, the 3 swings pullback to $16.04 low ended wave ((iv)). While above there, wave ((v)) remain in progress looking to extend higher 1 more time before wave 3 ends & pullback in wave 4 takes place in 3, 7 or 11 swings. The minimum extension area for wave ((v)) of 3 i.e inverse 1.236%-1.618% extension area comes at $16.72-$16.93. From where the metal can potentially see a pullback in 3, 7 or 11 swings before more upside can be seen. We don’t like selling the stock & expect intraday buyers to appear in 3, 7 or 11 swings within wave 4 pullback at a later stage. As far as a pivot from $14.88 low stays intact.

LONG CDE - Company just broke out of a 8 year down trendCDE is a great buy here as the stock has broken out of a 8 year down trend starting in 2011. CDE has lagged other silver miners slightly during these recent silver breakout ().
They are optimizing recovery and costs at current claims and have a great deal of exploration and potential for new claims in the works. They have suffered from aggressive short selling as of late - see: fintel.io , but this should just fuel a spike in the stock as Silver moves to its next resistance point of $17.30. Technically resistance at $5.20, then $5.75.

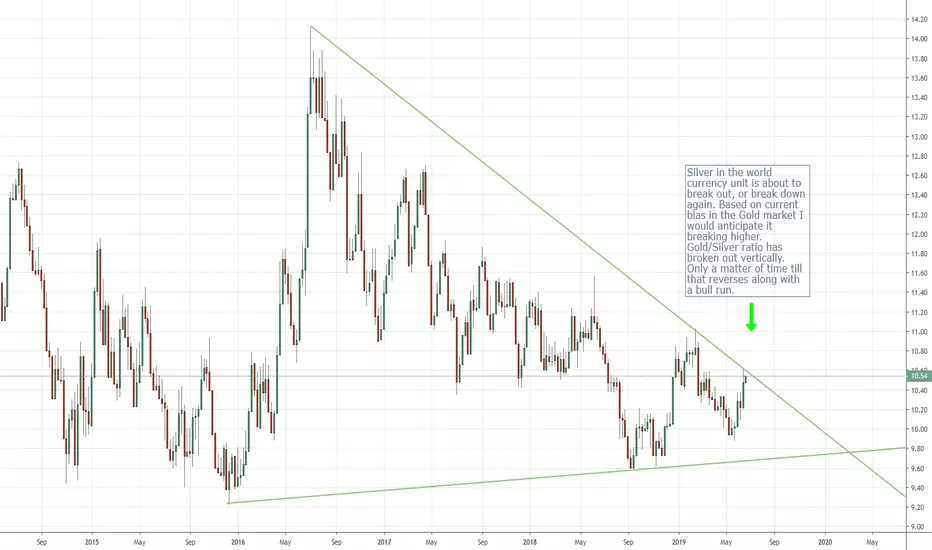
World Silver Price about to Break Out!Silver in the world currency unit is about to break out, or break down again. Based on current bias in the Gold market I would anticipate it breaking higher. Gold/Silver ratio has broken out vertically. Only a matter of time till that reverses along with a bull run.
THE WHITE METAL WILL SKY-ROCKET LIKE NO OTHER IN THE LONG TERMThe bull run in the precious metals complex which officially ended in Oct 2011 dragged the prices of the white metal to up to 50USD per ounce. That was a staggering 393% growth which took the prices from 10USD to 50USD however from there we have seen more than 70% correction in silver prices. The interesting part is even when gold is able to break it's 6 years long term resistance which stands at $1400, the Silver chart still looking dead and the gold-silver ratio is currently trading at 93 which is the highest in 30 years, so the question is what is really happening with silver?
1-We have already informed you that silver is known as a proxy for gold. Silver is known to be much more volatile than gold that's why it often is seen that when gold becomes expensive more and more investors tend to invest in silver in order to gain significant profit due to its high volatile nature however Recent report suggests that many investors are now looking towards alternative currencies such as bitcoin.
2-when you try to look at the 100-year historical chart of Gold vs silver prices you will be able to find two major bulls runs within the precious metal sector. The first one happened in 1971 which is known as a Nixon shock. The Nixon shock was a series of economic measures undertaken by United States President Richard Nixon in 1971, in response to increasing inflation, Nixon Shock is a phrase used to describe the aftereffect of a set of economic policies touted by former President Richard Nixon in 1971. Most notably, the policies eventually led to the collapse of the Bretton Woods system of fixed exchange rates that went into effect after World War II. From 1971 to 1973 The gold prices surged in a significant manner(36USD per ounce to 130USD per ounce) however silver underperformed gold within the years and rose only from 1.40USD per ounce to 2.01USD per ounce, It took almost 2 years for silver to outperform gold when new money flooded into the silver market. After that Silver prices rose from 1.40USD to 36USD which was an astonishing growth compared to the yellow metal.
Second major bull run occurred after housing market crisis on 2007, It took few years for silver to outperform gold as we have witnessed in 1971 however the only difference this time was that outperformance of silver was significantly higher compared to 1971.
Please note-We have not mentioned Jp morgan manipulation in the silver market as that would imply writing a book in itself
Ending this article with a quote-“History doesn’t repeat itself but it often rhymes,”


XAGUSD (SILVER) SETS TO MAKE A NEW HIGH IN WAVE (C) OR (3)The XAGUSD (SILVER) daily chart shows that the rally from 13.88 low is a classic five-wave impulse.
According to Elliot wave principle, a three-wave corrective pattern follows every impulse move and the bearish move after the completion of the impulse in Silver exhibits this characteristic.
.
The corrective wave unfolded as a double three combination structure with an expanded flat in wave A, a double zigzag in wave B and wave C unfolded as a simple zigzag pattern.
.
The corrective pattern also retraced about 50-61.8 of the impulse wave and reversing from a key support zone.
.
If this wave count is correct, Silver is expected to make a bullish impulsive move above the previous high at "$16.18" in wave (C) or (3).
.
Thanks for reading!

Silver Buy & SellAs shown in the chart, i believe silver is on its C leg, could extend further into the blue area or just go up from here. My TP & Sell zones are only a rough idea of where i think market will touch before it goes back down again.
DISCLAIMER
Please note that this chart is an opinion based chart only. Please trade at your own risk

7.5yr RSI trendline observations (monthly)As illustrated via the solid blue RSI trendline, monthly futures have been accumulating pressure for about 7.5yrs. In our view, a monthly close above $16.15 would result in large capital inflows not seen since 2003. Risk associated with entering at present levels may be partially mitigated with a timely exit if weekly values close below $14.75. From a purely geopolitical perspective (gold/silver ratio, price history and mining supply conditions aside), silver securities offer credible hedge value.
