SILVER LONG: POSSIBLE BREAK OF HEAD AND SHOULDER PATTERNA possible break of an inverted head and shoulder pattern looking to long for a reversal of trend. CAPITALCOM:SILVER
Silverlong

SILVER ($US/OZ) | LONG DISCUSSION Hi all, hope you have all had a fabulous trading week! Decided to share my technical analysis on what i think could mark the beginning of a long-term move up to 39.650 on SILVER ($US/OZ), I’m essentially waiting for further support to be established along a pre-established long term resistant line that was broken back in July, 2020, I'm hope to hold for some significant time as i believe this to take quite some time to play out so I’m remaining patient on further indicators to mark the continuation of the upward move, thanks all for your time and wish you all an amazing weekend ahead!

SILVER...A BULLISH GOLD MINE?TECHNICALES
XAG/USD has finally come to a bearish end lasting over 120 days! An amazing performance from the metal in comparrison to the dollar.
The pair has made a bullish break out of the trend line on Thursday this week and tried to come back in but wicked out, continued bullish and there is our bullish confirmation!
On its way up i expect it to play around the regresstion trend till resistance zone of 24.641 strong bearish movement may come into play from then but will not come back to daily resistance zone bring at 22.435.
FUNDAMENTALS TO LOOK OUT FOR
SUNDAY, OCTOBER 17
02:00
USD IMF Meeting
MONDAY, OCTOBER 18
11:30
USD Fed's Quarles speech
20:00
USD Monthly Budget Statement(Sep)

Silver is Ready to Reverse Downward trendSilver seems to be left behind amid major interest for crude, aluminum and natural gas. While silver prices are ending the week with quite a strong upside move showing intentions to leave a downward channel that has been forming since June 2021.
Let’s take a closer look at the silver price chart and start with the “Morning star” candlestick pattern that has been forming on a weekly timeframe chart for the last five weeks. In this pattern the “Morning star” is presented by three candlesticks in the same area. And this pattern is formed close to the strong support level at $22.06-22.12 per ounce. This support level was confirmed in September and November 2020.
It is worth noting that the downward movements since September 7 have been in a form of a downward wedge that is considered as a reversal pattern. Moreover, the resistance of this pattern is already broken to the upside. Considering the height of this wedge, we may have $24.84-24.94 per ounce as a target for silver prices. The second target, considering the width of the wedge, may be projected at $25.60 per ounce.
At the moment silver prices are trying to break the resistance of the 4.5-month downward channel. And for this to happen prices should reach $23.90 per ounce.
We may see multiple technical upside signals on the daily and weekly timeframe charts.
My forecast is that silver prices may reach even $26 per ounce in the coming weeks to meet the resistance line formed by January and May peaks. If the $26-26.30 landmark would be broken we may have room for further upside movement to $29-30 per ounce. In this case, the upward trend would be established and we would have an upside movement to the height of the consolidation that started in June 2020, and that would guide us to $36-37 per ounce.
James Anderson, Chairman and CEO of Guanajuato Silver Company suggests that silver prices may reach $40 per ounce by the middle of 2022. "If we have a weak economy coupled with a drive towards needing and using more silver, you're going to have base metal mines shutting down that produce silver as by-product, just as an enormous demand for silver comes to the fore," he said. "In that environment, you could easily see silver go to the $40 price range. But it is more likely we will see silver at $30 before it hits $40. I can see it hitting $40 halfway through next year."

Silver - LONGSILVER has been trading in a horizontal channel for 2 months. It looks like what appears to have been a breakdown has now reversed. An inverse head shoulders pattern pattern has formed and currently we are testing the downtrend resistance line. If broken, a great entry will be on the retest of the head and shoulders neckline. A target being the mid channel resistance.

AG LONGDear gamblers,
Seems that AG has retraced enough. We open long right at 12.33 USD with stop loss at 10 USD looking to target 40 middle term.
Silver is a "commodity" that attracts me because of its scarcity and industrial need for batteries.
Let's see if it plays out.
** This is not financial advice, do your own research before risking money ***
Kind regards,

DXY / US Dollar rejected 3 times! Maybe a turn point...Looking like US Dollar is rejecting for third time! So we might get a turn on Euro pairs like EUR/CAD and Gold / Silver / Oil. Watch out might get a short covering rally in all these pairs everyone is selling!!! Be careful on shorting....

SILVER : GARTLEY PATTERN IN RANGE AREA | BUY SETUP 🔔Welcome back Traders, Investors, and Community!
Check the Links on BIO and If you LIKE this analysis, Please support our Idea by hitting the LIKE 👍 button
Traders, if you like this idea or have your own opinion about it, please write your own in the comment box . We will be glad for this.
Feel free to request any pair/instrument analysis or ask any questions in the comment section below.
Have a Good Day Trading !

Silver Correction CompletingSilver is in the latter stages of potentially completing its corrective cycle. The sequence should complete on the next new low to test the confluent support zone of 21/20/50, watch for bullish reversal patterns to develop here to deploy long exposure targeting a move back through the internal trend line resistance through 23 enrolee to a test of the primary trend line resistance towards 26.00

SILVER 4HSILVER
4 HOUR TIME FRAME
LONG POSITION
As you can see there is another drawing linked to this one but the previous drawing is a short position.
BOTH CHARTS ARE NOT FINANCIAL ADVICE BUT PERSONAL IDEAS.
If you like my analysis give it a thumbs up.
If you are spectacle or have any questions on both charts please feel free to leave a comment below or send me a direct message.
SolarFX

LONG SILVERLong silver with 21.40 stop loss.
Risk reward so logical.
Chart so clear. So, do not hesitate.
Good luck fellas

SILVER COMMODITY WHICH BOTH BASE AND PRECIOUS METAL SUPPORT BUT STILL UNDERPERFORMING...CURRENTLY IN NO TRADING zone...if 22 then It will best for short for target 20.50..

Silver- New leg up?As I said in my previous Silver analysis, as long as the price stays above 22.20 support, bulls hold the upper hand.
At this moment, on H1 chart and smaller time frames, we can see a small pennant forming which can lead to continuation.
The confirmation comes with the price above 22.65-22.70 zone and the parget can be 23.50

Silver Long IdeaH1 Time frame
Silver breakout ascending triangle
Tight Stoploss Big profit
Lets see that

Silver- Where to buy?After breaking above the trend line resistance on Friday, and confirming the drop under 22 as a false break, Silver has riched a high around 22.7
Now XagUsd is in a normal correction and this can be a good opportunity for bulls to load long positions
A good place for this is 22.30 support and a break back below 22 would invalidate this bullsih scenario
23.50 could be the target

Silver Potential reversal Silver possible reversal . Wedge pattern and support zone. first target wedge upper trend line and after break may be massive spike possible.

Silver- Buy dips is my strategySimilar to Gold, Silver also has reversed strongly yesterday and at this moment is trading in confluence resistance as well.
A break to the upside would confirm reversal on medium-term and also a false break of support
Buy dips is my strategy and I will remain bullish as long as the recent low is not violated


$200 Silver ???Pulling back to the monthly chart, silver could be breaking out of this multi-year wedge. If it breaks and holds then the target is just over $200.

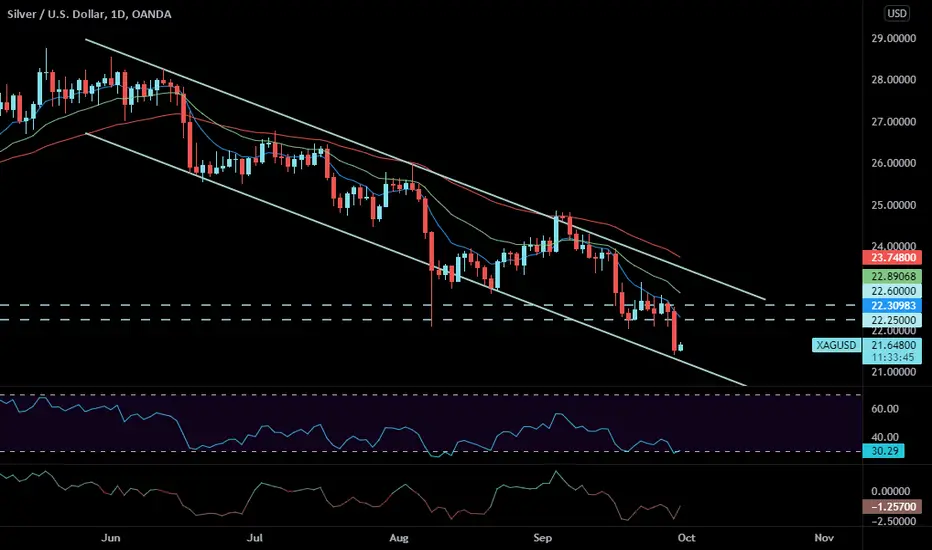
Silver ReboundingSilver prices XAGUSD seem to rebound after testing the lower boundary of the descending channel on the daily timeframe.
Prices may hit $22.25 - $22.60 resistance levels consecutively.
Buy SilverMIC for target of 63000Hi,
In Daily chart, Morning star pattern formed and yesterday's bullish candle confirming the reversal of trend. Buy SilverMIC Nov futures at CMP of 60681 to 60750 for a target of 62800 to 63000 in 8-10 trading sessions. Please maintain the stop loss at 59400

Long on SilverAfter the drop in silver's price at the major support, I'm expecting a bullish reaction from the buyers and the price will take off The entry.
Take this opportunity for massive results.
--------------------------------------------
Best Regards, Reda Souhail™

First Majestic: Turnaround soon? 😢😢😢It has not been a particularly good year for the First Majestic stock. However, we expect a turnaround just above the support line at $12.56. If the bulls can turn the course around there, big-time upward movements await us. If the price falls below the support line, we will see one-digit prices.
Happy trading!
