Is SILVER run over? It appears that we are still in a massive bear channel and this was a bear market rally. Both TVC:GOLD and TVC:SILVER appear to be overbought. Silver is showing a massive weekly shooting star. Might see another leg up (within the channel)but then a decline to find another bottom. Looks like it got all the FOMOs out there. Unless we break out of this bear channel staying bearish.
Silvershort

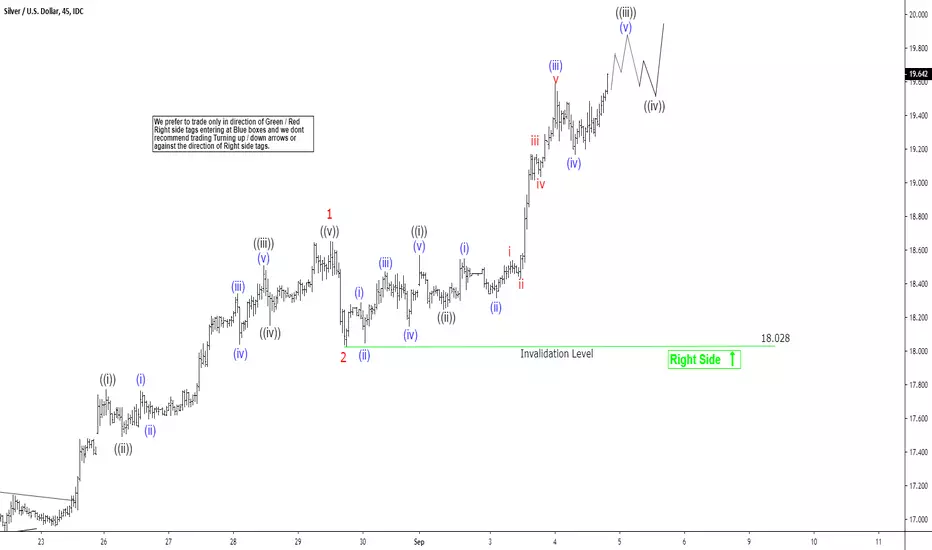
Elliott Wave View: How High Can Silver Go?Since forming the low on November 2018 at $13.9, Silver has rallied 40% to current price of $19.4. The move higher from $13.9 low took the form of a 5 waves impulsive Elliott Wave structure. On the 1 hour chart below, we can see wave (4) pullback ended at $16.92. The metal has since resumed higher in wave (5) with subdivision as another impulse in lesser degree. Up from $16.92, wave 1 ended at $18.65 and wave 2 ended at $18.02.
Near term, while dips stay above $18.02, Silver should continue to see more upside. We don’t like selling Silver and expect buyers to appear to buy the dips in 3, 7, or 11 swing. This view is valid as far as pivot at $18.02 low stays intact in the first degree. Possible target to the upside is 2.618% Fibonacci extension from Nov 2018 low which comes at $20.2 – $20.3 area. This is likely going to end only wave ((3)) in higher degree from Nov 2018 low, so it won’t end the entire rally yet. After it reaches the target of $20.2 – $20.3, Silver has chance to do a larger pullback to around $18 – $19 in wave ((4)) before another leg higher to end 5 waves up from November 2018 low.

Short silver - Back to $16 support.Silver is overbought in our opinion.
Shorting back to support $16.

SILVER- SHORT PLANShort Plan for Silver.
We have had a big run-up and are approaching a key confluence of sell zones.
Idea is to go short on the touch of sell zone marked in Dark blue on 4h inside a bigger sell zone red from weekly.

Elliott Wave View: Silver Remains SupportedShort Term Elliott Wave structure from the chart below suggests the rally in Silver to $17.5 ended wave (3). The metal then pullback in wave (4) to 16.91 with internal structure as a triangle. Triangle is labelled as ABCDE with subdivision of each leg in 3 waves. Triangle is therefore a 3-3-3-3-3 structure. In this case, wave A ended at 16.5, wave B ended at 17.39, wave C ended at 16.83, wave D ended at 17.19, and wave E ended at 16.91. We can also see each leg in the triangle subdivides in another 3 waves.
The metal has resumed higher in wave (5). Up from 16.91, wave 1 ended at 17.77 and wave 2 pullback ended at 17.49. Wave 1 subdivided as a 5 waves impulse structure. Wave ((i)) ended at 17.14 and pullback in wave ((ii)) ended at 16.96. Up from there, wave ((iii)) ended at 17.74, wave ((iv)) ended at 17.55, and wave ((v)) of 1 ended at 17.77. Silver still needs to break above 17.77 to confirm the next leg higher has started and avoid a double correction. We don’t like selling the metal. As far as pivot at 16.91 stays intact, expect Silver to extend higher.

Analysis of SILVER 27.08.2019The price above 200 MA, indicating a growing trend.
The MACD histogram is above the zero lines.
The oscillator Force Index is above the zero lines.
If the level of resistance is broken, you should follow the recommendations below:
• Timeframe: H4
• Recommendation: Long Position
• Entry Level: Long Position 17.800
• Take Profit Level: 18.150 (350 pips)
If the price rebound from resistance level, you should follow the recommendations below:
• Timeframe: H4
• Recommendation: Short Position
• Entry Level: Short Position 17.500
• Take Profit Level: 17.400 (100 pips)
USDJPY
A possible short position in the breakdown of the level 105.55
GOLD
A possible long position at the breakout of the level 1536.00
USDCHF
A possible long position at the breakout of the level 0.9815
GBPUSD
A possible long position at the breakout of the level 1.2255

silver sellexpecting down move from here, i'll buy if i see it breaking the top, PLS LIKE AND FOLLOW IF YOU SEE IM ALWAYS GETTING THE TOP AND BOTTOM

8-6-2019- Silver Surfer, lows coming for Silver/ USD?Shakeout as silver posts new low
Educational and entertainment purposes only- not financial advice

SILVER (XAGUSD) | Sell OpportunityHi,
A bit risky trade opportunity but some price action criteria matching almost perfectly with each other inside the blue box.
It is a counter-trend trade and that's why it is pretty risky!
Do your own research and if this matching with mine then you are ready to go!
Please, take a second and support my effort by hitting the "LIKE" button, it is my only fee from You!
Best regards,
Vaido


XAGUSD Silver, ready for a correction?After an impressive bull run, Silver had a very indecisive day on Friday printing a huge sideways candle. This could lead to a correction move to retest the 15.6 level that was broken without a retest.
We also see that RSI has entered overbought territory. That, by itself means nothing but after that clean bullish move could mean that the price needs some oxygen before continuing running.
Lets look at the 4H chart:
I felt artistic and decided to hand draw the Price Action I am expecting to see :))
The price sky rocketed from 15.18 resistance area all the way to 16.6 where bears started to take control. This could well be profit taking on a Friday but could also mean that the price is correcting. The price has been overbought for a while and retesting the 15.6 level or even the 15.18 level would be a healthy sign.
This being said 16.11 is a very important area. If the price breaks below, it will be my signal to get ready to jump into that corrective move. I will be looking at exact entry and exit points when/if that happens.
Do you think Silver will continue its bullish run or not? Please let me know in comments!

Silver , another impulseSilver will complete 3rd wave , completing it's last 5th wave, then after correction there will be another impulse , probably, up to 17.5-19$

Silver - Short ideaWaiting for price to move up a bit more. Currently in a bull flag. Waiting to see how deep the correction is.
Will look for price action around:
- Triple top region (15.673) - This also meets the descending pink trendline
- The descending yellow trendline, which is a long term descending trendline (15.8 - 16)


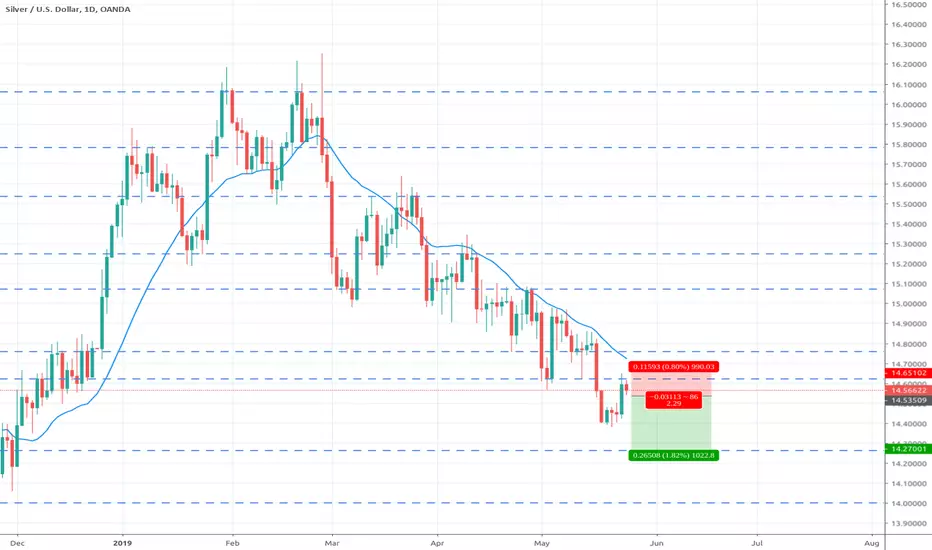
Shorting Silver Some MoreSilver looks like to be continuing going down. The big banks probably need to buy some more physical Silver, so they are pushing the price down in the paper / futures market. I will probably buy some physical silver as well. But as a trader I will short it. Most retail traders are bullish, which is a good indication we will go lower.
Here is the entry in my trading log:
Date Pair Direction Trade Trend Level Signal Entry
2019-05-26 XAUUSD Short With trend Down Horizontal Resistance Indicision break

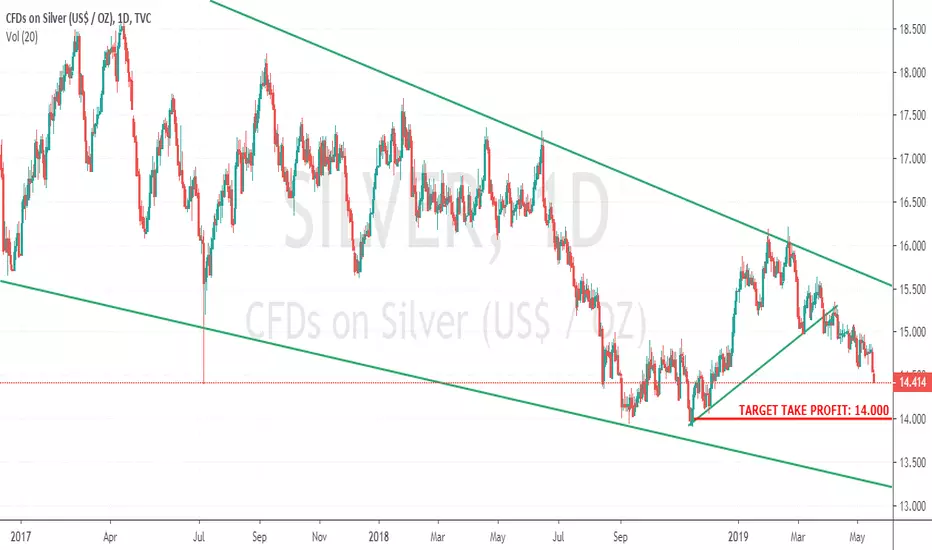
SILVER DAILY TIMEFRAME SHORTSilver is set to follow it's long lost posh cousin, gold, on the sell-off. This is quite a risky trade considering the large pullbacks in the silver market. Plus there is the notion of entering a short when the market is already oversold. But we don't care about indicators, do we? Surely i entered a short trade on the last gold trade when the stochastic oscillator was heavily oversold, but i came out with some profits. The only perk was i had to go and write an exam the following day, while holding the trade and when i came back home to the Wi-Fi zone, it had barely moved. It only started moving when i was relaxing thinking of of how to get rid of my headache. Still, we won the trade so that's that. My entries on the trade are as follows:
Entry: now or never!!!
Stop loss: 14.583
Take Profit: 14.000 or sooner!!!
SILVER SILVER Trades using Blue Sky Plus Indicator. Spend less time in doing analysis. Just plain follow the indicator. Message or Comment to get a trial of the indicator.

Silver stepping lower?Silver has been making lower lows and lower highs. This indicates price is trending down. Price has moved back to the moving average. In other words: it has reversed to the mean. From here there is a high probability prices will continue moving lower with the trend. If price moves up past the recent high, then the trade is invalidated. I have entered at market with a stop above the recent swing high and a take profit target at the lows of December 2018.
This is my entry in the Samurai Trading log :
Date Pair Direction Trade Trend Level Signal Entry
2019-05-07 XAGUSD Short With trend Down Dynamic Resistance Indicision Market

A short and interesting opportunity #XAGUSDA downward trend in H4 with confirmation of Stochastic which is in its selling area.
Entry price:14.91
Take profit: 14.58
Stop loss: 15.10

