Silver Short OpportunitySilver broke the resistance cloud, and continued to fall for a bit. CFT also is showing a good short possibility.
Silvershort

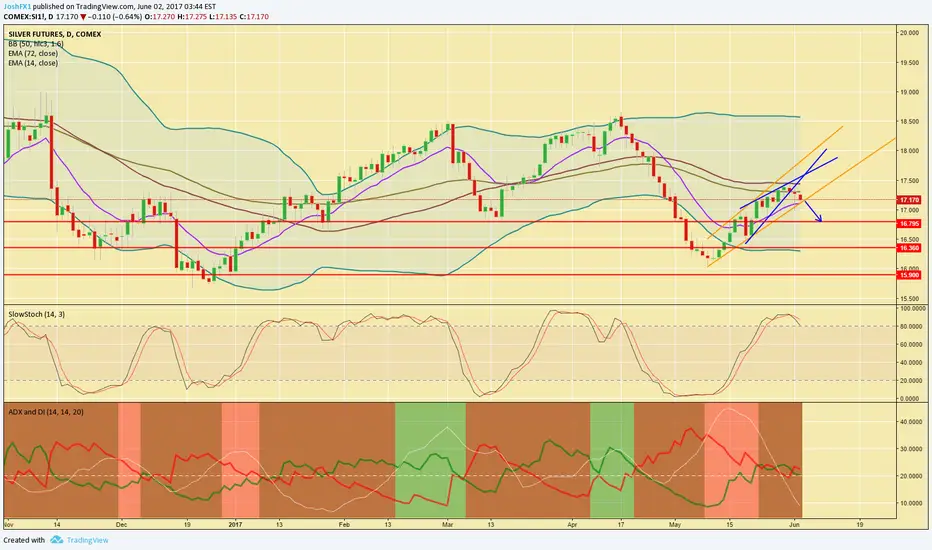
GOOD SHORT POSSIBLE FOR SILVER (XAGUSD)Strong possibility that XAGUSD will continue to fall.
We can see that there is a channel of ABC and 12345 waves which are quite consistent.
It's still very early as it may be ending its channel.
It's now important to look for a flag or a correction that confirms a BULLISH movement, the formation of an uptrend channel as it breaks out.
Signifying a reversal instead. (In Blue)
A strong BEARISH movement followed by a flag will confirm the short.
Let me know what you think!

Silver Trend ChangeAs always guys trade with your own mind, if have any question feel free to leave a comment.
TVC:SILVER

Silver Ready For Bounce BackSilver on the daily time frame is now at the lower range and looks ready for a bounce back up.
As you can see the shape of the range is a bullish wedge. Meaning: a high chance to break to upper range and continue in an upwards trend.
How ever as you can see theres still a bit of space left. My prediction is that after going to the upper range, there will be 1 more wave down to the lower range before a bounce that will break the upper range and lead to a new trend up to 18.400.
Trading advice: Buy The Dips
SL: 15.200, take small buy positions and be ready/able to add more buys every 0.400 dip or 0.200 increase
TP: 17.800-18.400

Silver downward breakout 5-July-2017 [Weekly]Silver breakout on the Higher-Low's (HL) trend.
Short-term
Resistance zone: 16.50-17.00
Support zone: $15.50
Long term
Major resistance: $21
Major Support $14

Case for shorting Silver Case for Silver short is high
RSI and MACD down and
support has become resistance at 16.85

Silver ShortArea of interest at 17.32 Short
- Respected weekly support channel Since February 29th
- Wedge pattern forming in weekly time frame
- Harmonic move A,B,C,D
- RSI Divergence down
- Most often When EMA is broken on 4 hour chart, the trend continues
- Target 1 15.33
- Target 2 14.25
Good luck in trading!

GOOD PROFITS ON SILVER!BUT NOW WHAT?Very good entry on this last counter leg bounce of silver.
A lot of traders ask me now what?
Now the current trend line on hourly chart has lust broken.You can wait for a re-test of the trend line nad short it.
Keep in mind that fundamentals stay unchanged supporting a price near 15$/OZ area.
TECHNICALLY
1.WE CAN SEE THE 61,8% FIB RETRACEMENT OF THE INITIAL DOWNTREND THAT PRICE TRIED AND COULDN'T CHANGE THE MID-TREND UP.
2.MARKET GEOMETRY MEANING THAT IF WE DO THE SAME PROCESS AS WE DID AT MY PREVIOUS ARTICLE WE COPY THE ED RED LINE AND WE TAKE THE E'D' RED LINE THAT OCCURS AND WE PLACE IT AT THE CURRENT BOUNCE.
3.THE PRICE LINE THAT OCCURS IS AROUND 15,300$/OZ AREA THAT IT HAPPENS TO BE THE TOP LINE OF THE DESCENDING MID-TERM CHANNEL.
4.WE HAVE RSI DIVERGENCE ALREADY ON 1H AND 4H CHARTS.
5.STOCHASTICS IN OVERBOUGHT AREA.
6.THE 15,300$/OZ IS ALSO THE 1,618% FIB EXTENSION OF THE LAST E'D' COUNTER TREND BOUNCE WE HAD.
7.AT 15,300$/OZ WE HAVE A STRONG RESISTANCE ALSO AND A BULLISH ADVANCE PATTERN COMPLETION WHICH I WILL POST A NEW ARTICLE SOON.
8.AS WE SEEN AT HISTORY PRICE AFTER EACH SELL-OF RALLY DIDN'T RETRACED ABOVE 88,6% FIB RETRACEMENT INCLUDING THE WICKS SO WE WILL PLACE THE BUY STOP ABOVE THIS AREA.
POSSIBLE TRADE:
FIRST TARGET AT 16,300$/OZ AT PREVIOUS LOW STRUCTURE AND 61,8% FIB RETRACEMENT OF THE UPWARD MOVE.
SECOND TARGET AT 15,300$/OZ AREA FOR THE REASONS MENTIONED ABOVE.
BUY STOP AT 18,100-18,500$/OZ DEPENDS ON RISK APETITE ABOVE PRECIOUS HIGHS AND ABOVE 78,6-88,6% FIB RETRACEMENT OF THE LAST COUNTER RALLY.
THANK YOU FOR SUPPORT!
HAPPY TRADING!


Silver Sentiment Back To Sub 17When look at silver on the daily time frame you can see that it has broken the lower range of a small channel and is now heading to the lower
range of the bigger channel.
Given by the looks of the Indicators it looks like theres enough selling pressure and strength for silver to break through this lower channel and 14 EMA level.
The previous up wave got rejected at the 72 EMA instead of breaking it. If you can see this also often means that price will retrace back.
Entry: 17.100-17.300 area.
Tp: 16.700 > 16.300 > 15.800
Sl: 17.700
Silver still BearishSilver is still bearish when looking at the indicators.
I expect it to touch the lower range around 17.5 and
a possible break of the range from that point. The past
years silver seemed most comfortable in the 15.500-16.800
zone.
This sunday we have the french elections, I personally expect
that Le Pen wont win, giving the Euro a boost on monday. However
I also see a decrease in safe havens because of this which means gold
and silver will drop even though the euro will climb.
Trading advice: Sell the spikes or if your equity allows it sell it at
current market price and be ready to add more along the way or spikes.


Reversal in Bullish Thesis on SilverA couple weeks ago I expressed a bullish thesis on silver given the chart patterns, and if the charts acted the way I thought they would've if the underlying asset was truly bullish, we would've gone past the 18.50 level. However, at that level it appears to have created a double top over the course of two months. If it closes below it's 50 and 200 MA I will look to reverse my thesis completely and try to play this thing on the short side.
After reading from some of the greatest traders in the world (Seykota, Drunkenmiller, etc.) one thing that I have noticed is their ability to change their mind on a dime and go with the trend. Time to put my money where my mouth is.
In terms of getting stopped out, I would look to place my stop right above the 200 MA, which would express a change in the trend. However, I don't want to put it so close to the 200 MA that I get stopped out on a false breakout if that would be the case.
Still trying and testing different stops. Learning.
All the best,
RC

Short on Silver, with low risk intended.Still experimenting XABCD, Fib, and all the basic rest.
Stop loss at 18.60, few capital at risk.
No target settle, to each is own feeling I guess.
Cheers :)
PS : Long would be a good strategy for very long term, what ya'll think ?
Bearish SilverBoth a short term and long term position have been cast. I'm still trying to incorporate the fib circles to the charts, but beyond that, even more basic chartism seems to indicate this too.

Short Silver on Strong Resistance above 18For silver we can see a strong Resistance around 18 level its rejected that area many times if hold below we can see a drop towards 16.5-16.7
Advice to sell in range of 17.45-17.7 sl 18.1 TP 16.5

Short on Silver for Long-Term ?!Dont know why will fall to that lvl's ...! Maybe i'm wrong ... who know !

Silver (yearly view/possible scenarios)There was a clear break of the downtred with wedge formation towards the end of 2016. A strong support was established at 17.20 (blue line). If it bounces back up, we might expect a new test of 18.50 level (green line). If key support line fails to hold, we could see price going as low as 16 to 15.80. Shorting seems like an interesting position in the short term.
*Important: The silver market is highly controversial and there's clear evidence of insider influence/manipulation of price in the past, so take everything with a grain of salt.

To FED or not to FED, that is the question!My vision on Silver is still the same as described over a month ago:
Price of XAGUSD reached 200 day moving average (green line) while 18.24$/oz is a 0.618 fibo.
Please also have a look at the stochastic indicators below the chart.
In my perception price of silver will move slightly up or sideway, touching red box.
The main downward move will happen in mid-March when J.Yellen will decide or not decide on changing interest rates.

Silver Mid-term Short OpportunityHello Traders,
Today we would like to present you TVC:SILVER as it seems to decline in near future. Let us break down the analysis.
Starting with the fundamentals/macro overview as usual:
TVC:SILVER is currently not a very much watched instruments in the financial market, however it shows some interesting pattern. These pattern we would like to provide you.
As TVC:SILVER is in our trading watchlist for commodities combined with TVC:GOLD for the precious metals, it may shows some capital outflows coming in near future for mid-term.
After President Trump will talk in front of the congress by 2:00AM gmt in which he may give a statement of his tax reform and budged plan. "World financial markets will be scrutinizing the 9 p.m. address in the House of Representatives for specifics of how the Republican president aims to make good on promises to tackle tax reform, boost infrastructure spending and simplify regulations he says are harming business." (source Reuters) His content of the speech and tone will be important. He says to bring "one of the best tax reforms which the U.S. had in quite a long time."
In addition markets predicts with a probability of 62.0% vs. 31.0% (yesterday) a rate hike of 25 basis points. This may confirm bearish sentiment towards precious metals as we currently see in TVC:GOLD as well, as it forms our well said bearish pattern.
However, keep in mind that the speech by President Trump at 2:00AM gmt could completely change the picture in worst case.
As we look at our intermarket indications we we get confirmed with our statement, as they currently warn for a big upside moves on mid-term. They mention a short-midterm outflow of capital!
We always mention the importance of intermarket flows, as we believe that investors only repark their money due to sentiment and global macro-economic conditions. Therefore, we always keep in mind the in-and outflows with the help of our intermarket indications that lead us towards better timing when making a trading decision. As you might know that timing is one of the most important things when it comes to trading.
As seen in the chart, our two of our intermarket indications showing a divergence and currently moving in selling territory which might indicate a soon outflow of capital towards other asset classes. One of them is currently turning south ( Silver vs. Currencies). We take into regard always the BIG 4: Currencies, Bonds, Stocks and Commodities.
Looking at the technical perspective and current trading range, we see a clear trend channel in where TVC:SILVER currently moves. However, it currently flirts with a decisive zone (our 50% Resistance Level). Around that level it will be decided what trend direction we see next. As market bounced several times at the drawn trend line above that red drawn decisive range, we might see sooner or later trend reversal patterns. Together with all our analysis, this might confirm our standpoint that TVC:SILVER might move to the downside (first turquoise box or further to the second turquoise box) before continuing long term bullish trend. This move may be initiated in the next 0-3 weeks. If we see a bearish pattern we might take advantage of getting at least a 4:1 Risk/Reward out of the trade.
So, summarizing everything together, we believe that TVC:SILVER might fall to the downside at least on mid-term before continuing long term bullish trend. This underlines our intermarket indications that are currently diverging bearish. The fundamental perspective may give Silver a driver to to potential bearish sentiment around the decisive territory as we soon get interesting trading setups.
We wish you much success,
The Secrets2Trade Team

Silver short advice on Strong supply zoneSilver sell advice on Strong Supply zone.
Sell in range of 18.22-18.6 sl above 19 tp 17.2
