SILVER - SELL IDEABefore price shoots up its going to drop again, wait for it to break consolidation and dump it to highlighted area
Silversignal


#SILVER - #XAGUSD is showing a good sell setup ! hello my friends traders ,
as you see the price is really weak against the 61.80 fibo and it respects this level, But pay attention once the price hits or near to hit the 100% level take your partial profits or close your trade if you don't want to be under stress or simply if you are confident you will break even and let the price do whatever it wants .
If you wanna thank me, Please support my free analysis by dropping likes, follow me and why not you can comment as well :)
IMPORTANT: If you want me to manage your account don't hesitate to contact me :)
Enjoy!

Silver may have some ways to go before it breaks out.Silver seems to be forming a bullish downward trending flag pattern, which is bullish to the upside. It will break out eventually, probably when we exit this deflationary period due to the virus and we enter the high inflationary period that follows due to intense monetary stimulus which as preceded.

What You Think? (SILVER) Triple bottom for a sideways break to the upside?
You like these prices or think she going to RIP south?
I'm adding long term.
HODL

Looks Juicy!!! (Silver)50% fib retracement triple hit for support.
Starting to compress in sideways pennant.
Red circles represent a key level that I'm watching.
Think I will begin to accumulate silver for a very long term hold around these prices.
If broke 13.67 than I'd be concerned.

Silver Futures shortIf the price enter inside the channel and breaks the Blue TrendLine ..so silver for short..TP1 is 15.1 and TP2 is 14.95

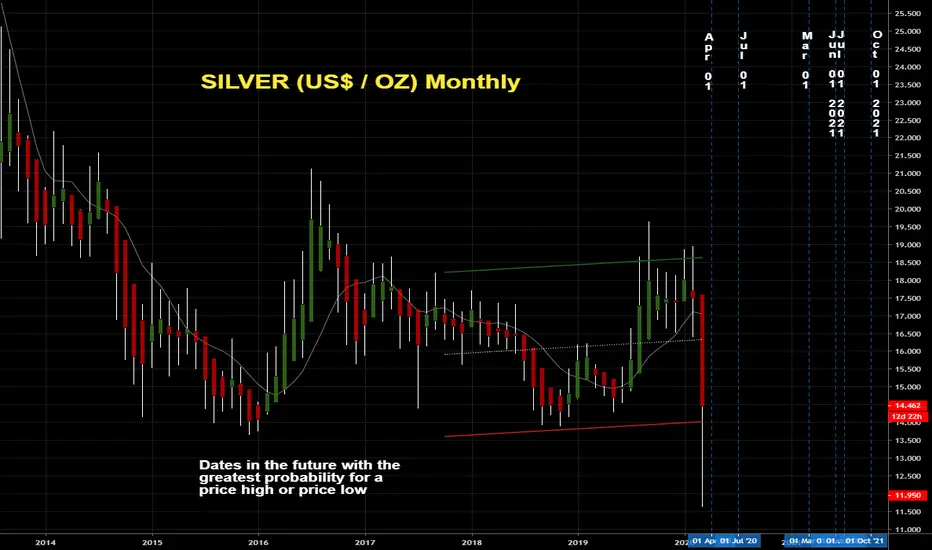
SILVER (US$ / OZ) Monthly, Weekly, & DailyDates in the future with the greatest probability for a price high or price low.
The Djinn Predictive Indicators are simple mathematical equations. Once an equation is given to Siri the algorithm provides the future price swing date. Djinn Indicators work on all charts, for any asset category and in all time frames. Occasionally a Djinn Predictive Indicator will miss its prediction date by one candlestick. If multiple Djinn prediction dates are missed and are plowed through by same color Henikin Ashi candles the asset is being "reset". The "reset" is complete when Henikin Ashi candles are back in sync with Djinn price high or low prediction dates.
One way the Djinn Indicator is used to enter and exit trades:
For best results trade in the direction of the trend.
The Linear Regression channel is used to determine trend direction. The Linear Regression is set at 2 -2 30.
When a green Henikin Ashi candle intersects with the linear regression upper deviation line (green line) and both indicators intersect with a Djinn prediction date a sell is triggered.
When a red Henikin Ashi candle intersects with the linear regression lower deviation line (red line) and both indicators intersect with a Djinn prediction date a buy is triggered.
This trading strategy works on daily, weekly and Monthly Djinn Predictive charts.
Trades made when the monthly, weekly and daily arrows are pointing in the same direction are the most profitable.
This is not trading advice. Trade at your own risk.

SilverIdea for XAGUSD
Top can be seen to be suggested perfectly by the Fibonacci spiral
price can be seen to trade along the 1 fib level within the Fibonacci circle
The bullish divergence might provide enough momentum for a bounce up to the level indicated however i think the spiral indicated will be the bottom.
Currently under the 200MA also.
The transition between fib rings within the circle may create some volatility.

Silver Rising WedgeSilver has formed a rising wedge
I expect after a final push the wedge will breakdown, i cant be sure though its just TA
The rising wedge pattern is a bearish continuation pattern
This is a short time frame 1H

Silver fractalSome silver fractals, what i mean by 'equilibrium crossover' is the point where the rising wedge breaks down into the falling wedge, producing the bullish pattern. After some more movement down within the wedge upward movement can be expected as per the falling wedge pattern. Used a mirror support level for a possible reversal point for silver.

SILVER (US$ / OZ) MonthlyDates in the future with the greatest probability for a price high or price low
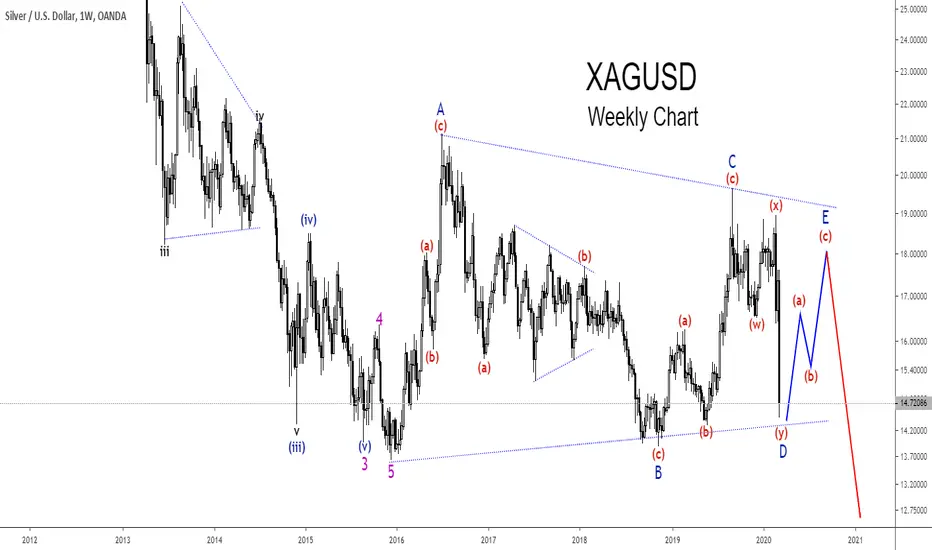
Price of Silver Is Trading In a Triangle, What Does This Mean?In the market, there are no guarantees, only probabilities. That is why traders must always look and prepare for different scenarios.
If you have been following my analysis on Silver for a while you have probably seen some of my analysis suggesting Silver could rally to around $22 articles.
However, my bias has changed in the last few weeks as the price is unable to move in five-wave higher to break 2019 high. Instead, XAGUSD has been moving sideways. This behavior reminds me of more and more of a triangle correction under construction.
See the idea on the chart above.
The Elliott Wave Principle states, that triangles are sideways corrective patterns, constructed of five waves, labeled A-B-C-D-E, where each wave is smaller than the previous one unless it is an expanding triangle.
It appears that the Silver exchange rate has almost completed wave D to the downside during Friday's session. If this count is correct, we should expect another rally in the face of wave E, which would complete the whole triangle.
By any means, if my assumption of a triangle is right, wave D should not breach wave B low, and wave E should stay below wave C high. According to the Elliott Wave Principle, triangles precede the last move of the larger sequence. That is, Silver should resume its larger degree downtrend as soon as the correction is over.
What's your thought about Silver?
XAGUSD. Price for silver began its long-awaited growth!Hello dear subscribers!
In the previous chart for silver,
the price began to rise, the buy zone is still active.
Do not miss the moment.
The target is just above 17.40000.
Good luck.
If you liked this idea, please like and subscribe to my profile.
This idea does not provide the financial advice.

SILVER (US$ / OZ) DailyDates in the future with the highest probability for price direction reversals

SILVER can see geting power slowly exepcting higher pus in price
ENTRY: 17.300+-
TP: 17.500
TP2: 17.700
TP3: 17.900
SL: 17.080
Chart time frame - 4H
Time for reaching TP - 1-2D
Follow, Like, Share or Comment
Thanks on supporting!
All best!

SILVER short trade setup scenario!!Plan : wait for price to bounce off from resistance level or supply zone --> wait for the rejection candle pattern to form e.g. bearish engulfing, pinbar etc --> SELL
**Disclaimer** the content on this analysis is subject to change at any time without notice, and is provided for the sole purpose of assisting traders to make independent investment decisions.
Traders!! if you like my ideas and do take the same trade like i do, please write it in comment so we can manage the trade together.
_____________________________________________________________________________________________________________________
Thank you for your support ;)
GWBFX

XAGUSD. Does this mean growth?Hey.
In just 4 days, the Silver price managed to fall from the resistance level to the support level.
For now, I would not recommend buying or selling silver. Because in this case it is a big risk, however,
the price will rise in the near future and will reach its target at a key level. Be careful. I wish you good luck.
If you liked this idea, please like and subscribe to my profile.
This idea does not provide the financial advice.

Silver/USD bullish signsHello.
Few noticements here on weekly time frame on silver:
Double bottom (red marks)
Good, clean looking reversed head and shoulders
After breaking the 200 ema (red line) it used it as support. If you compare this to previous movement it could be possible that we see upward movement as as long as we stay on top of it.
Same happened on the 20 ema (yellow line) four weeks back. Tested it 3 times but bulls took the lead.
Also downtrend (greenline) is broken with and nice looking cross on 50 (brown) and 200 ema which both are bullishs signs
Just simple speculation ;)
If you do trades always use stop loss
-Jebu


Silver Inverse Head and Shoulders Pattern. $20 /oz by Mid SummerClear inverse head and shoulders pattern could lead to a breakout in silver, finanly above $20/oz. Leading the way for a bull run in the PM's.

XAGUSD SilverUSD 1 Hour Fun Fact: Gold global production in 2018 was 3,260 metric tons and Silver was 27,000 metric tons. This is a ratio of 1 : 8.28, the “price” ratio is currently 1 : 89
Spotted another reversal on the 1 hour:
Previous Analysis:
This is not trading/financial advice.

short silver near 17.47/17.53 Target 17.00Short silver near 17.47/17.53 Sl above 17.60 Target 17.00 Thanks just Trade with proper money management.
