Waiting for SilverIf you like this idea, don't forget to support it clicking the Like Button!
Hi guys. This idea is a long term analysis of the Silver bullish trend (probably bullish).
My tactic for silver is to wait until the point (C) is reached and to expect for candle confirmation of bullish trend continuation.
If you are looking for a short-term trade on Elliott corrective waves, I suggest you look to the related copper idea.
Disclosure: My ideas contain statements and projections based on assumptions on capital markets, and therefore inherently subject to numerous risks and uncertainties.
Before buying or selling any stock you should do your own research and reach your own conclusion or consult a financial advisor. Investing includes risks, including loss of principal.
I am not a financial advisor.
Silversignal

Silver updatingIf I am staying bullish on Silver in the medium to long-term, price consolidation continues in the short-term. Hence, a return of the price to the support area at $ 16,650/17,100 is likely in the coming days.

Silver Prediction for Spring 2020My prediction for silver is a rally which will last until Spring 2020 where it will hit the early $20's/oz. This is based on the pretty perfect technical breakout we saw a month back, which has now back tested and is preparing for the next leg higher. This is all happened while the gold/silver ratio is weakening quite dramatically relative to gold.

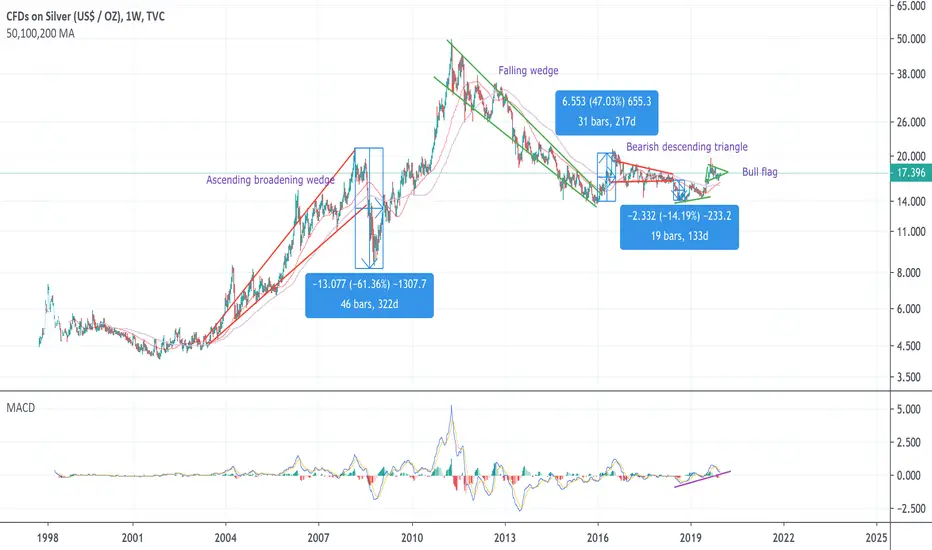
Silver Chart AnalysisIn this long term chart of silver, a ascending broadening wedge is present, which led to a bearish breakdown. A falling wedge which led to a bullish breakout. A bearish descending triangle, and a recently formed bull flag that may lead to further upsides. Rising MACD supports this idea.
Silver & other commodities have more downside, SILVER TO $16.00!Commodities are feeling the downside pressure due to the strong US dollar, there is money flowing out safe-haven assets into the equity market since it's been climbing to all-time highs.
Silver forms a very interesting pattern and has been doing so since the start of September when it fell drastically from the strong rally. The pattern involves a strong 1-2-day drop then consolidation, slight pop into the broken support now resistance then another stern drop forming a downward channel for the past 3-4 months.
We expect the continuation, a slight slow pop on weak volume into $17.45 resistance based on the broken low and top of the channel then strong drop through $16.75 into $16.00 potentially.
Disclaimer: This idea is for educational purposes only, this is not a definite trading/investing signal. Trading is risky and should be taken at your own accord.


Silver Losing Momentum In silver, we had a strong move upwards from the $17/oz range to a high of roughly $19.755/oz. Recently, however, the price has failed to maintain momentum to regain those highs and has steadily pushed lower in an evident regression trend on the daily chart from 05 Sep 2019 to the present. I believe that silver will retest the $17/oz range, and from there, we will have a stronger confirmation on the short term direction of silver's price. As well the gold to silver ratio rebounded from a yearly low of roughly 1XAU:79.38XAG to currently 1XAU:84.89XAG. In the meantime, I believe silver to be a short trade. However, in the long run, silver seems to be bullish as the gold to silver ratio is at historical peak levels.

$21 / oz silver by mid year 2020This is a real possibility now that the downtrend for the last month or so is about to break. We are also seeing great weakness in the gold/silver ratio which means we should see silver outperform gold in the coming months. Therefore $21/oz is possible should the gold/silver ratio drop to around 70-77 depending on the price of gold. Watch the breakout.

SLV XAG Silver - Stop loss update, long the dipI'm playing silver in a bullish macro trend, so I'm still long. However we could see a significant pullback, shaking out weak hands and traders before a higher high. Short traders could be right depending on the degree of retracement.
However I'm not looking to short. I'm looking to long the pullback.


Silver Fundamental Analysis – September 16th 2019Here are the key factors to keep in mind today for Silver trades:
New Zealand Performance of Services Index: The New Zealand Performance of Services Index for August was reported at 54.6. Forex traders can compare this to the New Zealand Performance of Services Index for July which was reported at 54.8.
UK Rightmove House Prices: UK Rightmove House Prices for September decreased by 0.2% monthly and increased by 0.2% annualized. Forex traders can compare this to UK Rightmove House Prices for August which decreased by 1.0% monthly and which increased by 1.2% annualized.
Chinese Retail Sales: Chinese Retail Sales for August increased by 7.5% annualized. Economists predicted an increase of 7.9% annualized. Forex traders can compare this to Chinese Retail Sales for July which increased by 7.6% annualized.
Chinese Industrial Production: Chinese Industrial Production for August increased by 4.4% annualized. Economists predicted an increase of 5.2% annualized. Forex traders can compare this to Chinese Industrial Production for July which increased by 4.8% annualized.
Chinese Fixed Assets ex Rural: Chinese Fixed Assets ex Rural for August increased by 5.5% annualized. Economists predicted an increase of 5.7% annualized. Forex traders can compare this to Chinese Fixed Assets ex Rural for July which increased by 5.7% annualized.
Chinese Property Investment: Chinese Property Investment for August increased by 10.5% annualized. Forex traders can compare this to Chinese Property Investment for July which increased by 10.6% annualized.
Chinese Surveyed Jobless Rate: The Chinese Surveyed Jobless Rate for August was reported at 5.2%. Forex traders can compare this to the Chinese Surveyed Jobless Rate for July which was reported at 5.3%.
Final Italian CPI: The Final Italian CPI for August increased by 0.4% monthly and 0.4% annualized. Economists predicted an increase of 0.5% and of 0.5%. Forex traders can compare this to the Italian CPI for July which increased by 0.5% monthly and by 0.5% annualized. The Final Italian Harmonized Italian CPI for August was reported flat at 0.0% monthly and increased by 0.5% annualized. Economists predicted a decrease of 1.7% and an increase of 0.5%. Forex traders can compare this to the Italian Harmonized Italian CPI for July which decreased by 1.8% monthly and which increased by 0.5% annualized.
US Empire Manufacturing Index: The US Empire Manufacturing Index for September is predicted at 4.0. Forex traders can compare this to the US Empire Manufacturing Index for August which was reported at 4.8.
Should price action for Silver remain inside the or breakout above the 17.400 to 18.150 zone the following trade set-up is recommended:
Timeframe: D1
Recommendation: Long Position
Entry Level: Long Position @ 17.800
Take Profit Zone: 19.600 – 20.000
Stop Loss Level: 17.200
Should price action for Silver breakdown below 17.400 the following trade set-up is recommended:
Timeframe: D1
Recommendation: Short Position
Entry Level: Short Position @ 17.100
Take Profit Zone: 15.900 – 16.500
Stop Loss Level: 17.400


Analysis of SILVER 27.08.2019The price above 200 MA, indicating a growing trend.
The MACD histogram is above the zero lines.
The oscillator Force Index is above the zero lines.
If the level of resistance is broken, you should follow the recommendations below:
• Timeframe: H4
• Recommendation: Long Position
• Entry Level: Long Position 17.800
• Take Profit Level: 18.150 (350 pips)
If the price rebound from resistance level, you should follow the recommendations below:
• Timeframe: H4
• Recommendation: Short Position
• Entry Level: Short Position 17.500
• Take Profit Level: 17.400 (100 pips)
USDJPY
A possible short position in the breakdown of the level 105.55
GOLD
A possible long position at the breakout of the level 1536.00
USDCHF
A possible long position at the breakout of the level 0.9815
GBPUSD
A possible long position at the breakout of the level 1.2255


Silver stackers should see a bounce shortlyThanks for viewing everyone.
This is typical TA, it might go up or it might go down (and I told you so in either case). But stick around anyway.
After silver's top of almost $50 in 2011 it has made a clearly identifiable ABC formation correction of the intervening 8 years. If you squint just right, you can see the 5 wave wave (C) down too (complete with shallow wave 4 triangle and deep wave 2 correction. Wave 4 does not cross-over any of wave 1 price action (orange box - that also denotes the steepest price change - normally seen in wave 3). Recently there is a bottom forming after a quick rise from $13.700 to over $21 and a slow and steady price drop back to the swing low (low of 13.635 in December 2015). What I tentatively expect is a bounce from that level to around $22 (hopefully higher - very possibly lower).
Retrospective fibonacci targets (to gauge if the correction is complete) are for wave (C) to equal wave (A) at ($13.768) and a 1.618 extension of wave 1 (at $17.032). Both have been met or exceeded. In my view this is a buy zone and I will be buying each month that the price is below $17.
A word of caution; looking back a little ways into the price history (not displayed) pre-1980 to today. Silver rose from a sub-$2 base to exceed $50 in 1980. It then completed an ABC correction down to mid $4 range. This was followed by a weak wave C bounce and then the price slowly sunk lower to bottom at $3.50 in 1992 (10 years later). So, while the count holds up the price still slipped slightly lower in $ terms (more in % terms) before trying to set a new higher high. So, what? So, I am prepared for a potentially very long accumulation phase (last one 20 years) and also a potential price subsidence to below $10 (which will not change my plan). Remember everyone, no weak hands okay. Silver has been seeing increasing industrial demand but has been dropping investment demand.
Why silver? Why not buy on an up-trending asset?
1. Silver is an asset with zero counter-party risk, and is my choice as a hedge against a (more plausible every day) debt crisis,
2. charts never repeat exactly, it could bounce strongly - but I don't expect it to set up for a new bull-run just yet,
3. The gold to silver ratio is indicative of silver being undervalued on a relative basis (hopefully when the GSR normalises to below 40 I will trade silver for gold - silver is my vehicle to acquire more gold,
4. If there is a currency / inflationary crisis, there will be little warning and I want to be in at the bottom for the next move up,
5. Silver is money,
6. COT commitment of traders reports show commercial traders reducing short positions significantly,
7. Commercial banks have created the worlds largest ever silver stockpiles - removing supply from the market.
Asset allocation: 50% fixed income instruments, 30% low PE ratio (low debt, high return, recession resistant) stocks, 5% diversified commodity ETF (at a 30 year low), 7.5% silver, 2.5% gold, and 5% crypto.
While I am here, I would like to plug bullionstar dot com in Singapore. They have low premiums, cheap vault storage of 0.59%pa (silver - lower for gold). E.g. A Johnson Matthey 100oz silver bar (as at right now- prices change per minute) is USD1545.05 for a low volume purchase on 1-9 bars (cheaper than one US based site I just checked at USD1575) and zero sales tax on bullion. I will likely choose their 1kg zero spread bar (at low volumes it has a spread but it is lower than normal) and possibly small nibbles from their bullion savings program BSP where I can buy as little as 1g at a time. I just thought I would pass than on because it took me a long time and searching multiple countries to find silver at a reasonable price.

Gold / Silver Ratio PredictionExpect the gold/silver ratio to leap higher as silver underperforms Gold. Gold will rally but silver will remain muted, at least for a while. Then as the Gold/Silver ratio hits resistance at around 100 a clear buying opportunity for silver will emerge. Gold should rally as the Gold/Silver ratio collapses and therefore Silver is a screaming buy at these levels. Inflation picking up will be the key for silver and the gold/silver ratio collapsing. The Fed will lower interest rates, attempt new rounds of Qe to avoid a recession, but unfortunately all they will achieve will be inflation. Follow the breakdown of the ratio as it hits the upward resistance line, then it'll be off to the races for the pm bull market.


A Bullish Reversal In SilverOn the Silver daily chart has formed an Inverse Head and Shoulders. However, before to open a bullish position, it is wise to wait for the break of the resistance at $ 15.00 which, in all likelihood, will push the price to $ 15.50/15.60 area.

Elliott Wave View: Silver Extending LowerShort term Elliott Wave view on Silver (XAGUSD) suggests that the decline from February 21, 2019 ($16.21) is incomplete. Structure of the decline from $16.21 is unfolding as a zigzag Elliott Wave structure. Wave B of this zigzag structure ended at $15.63. Wave C lower has started and should subdivide in 5 waves. Down from $15.63, wave ((i)) ended at $14.88 and wave ((ii)) ended at $15.34. The internal of wave ((i)) subdivides as 5 waves of lesser degree. Wave (i) of ((i)) ended at $15.35 and bounce to $15.58 ended wave (ii) of ((i)). The metal then turned lower in wave (iii) of ((i)) and ended at $14.95. Wave (iv) of ((i)) ended at $15.16 and wave (v) of ((i)) ended at $14.88.
Bounce in wave ((ii)) unfolded as a zigzag Elliott Wave structure in lesser degree. Wave (a) of ((ii)) ended at $15.8, wave (b) of ((ii)) ended at $15.08, and wave (c) of ((ii)) ended at $15.34. Silver has since resumed lower and broken below wave ((i)) at $14.88, suggesting the next leg lower has started. We don’t like buying the bounce and expect bounce should find sellers in 3, 7, or 11 swing as far as pivot at $15.34 stays intact

#XAGUSD Signal Monthly We are looking at a model of XAGUSD (Silver) On the monthly chart :
Clear and confirm Double bottom
we recommend buying now-Entry price: 15.47
Stop Loss: 15.00
Take Profit: 16.20

EUR/USD BullishEURUSD, Eur bottom formed, it may take time to hit target, 11th december crucial for brexit deal, 19th december FOMC. $index high probability weakness ahead.

Silver is almost ready for take offWhile gold has been rallying, silver has been silently consolidating getting ready for lift off....
Last daily candle close was a bullish engulfing, which makes me confident to long any retrace down to 14.650 region, stop loss below bullish engulfing candles low....
