SILVER Potential 10% Short term !Hello fellow traders!
As you can see today we have a current opportunity in our prospects. However we patiently wait with our orders untill it will be filled at the right time in order to catch the breakout!
Right now gold/silver ratio is decreasing also creating momentum on the silver side.
Let me know if you have any ideas or like the contont, it would be highly appreciated
Silverusd


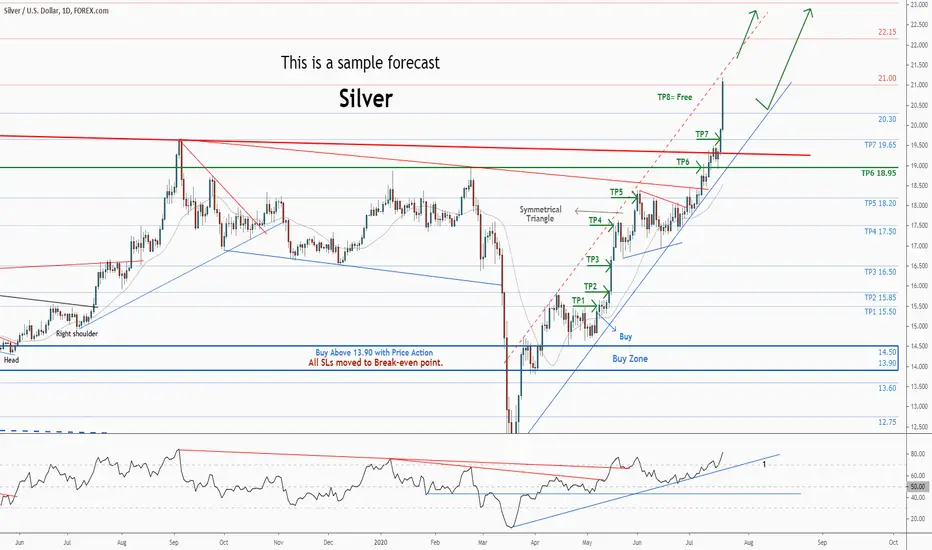
SILVER Technical Analysis UpdateMidterm forecast:
. 18.95 is a major support, while this level is not broken, the Midterm wave will be uptrend.
. We will close our open trades, if the Midterm level 18.95 is broken.
Technical analysis:
. While the RSI uptrend #1 is not broken, bullish wave in price would continue.
. A trough is formed in daily chart at 17.35 on 06/24/2020, so more gains to resistance(s) 22.15, 23.05, 25.10 and more heights is expected.
. Price is above WEMA21, if price drops more, this line can act as dynamic support against more losses.
. Relative strength index (RSI) is 83.
❤️ If you find this helpful and want more FREE forecasts in TradingView
. . . . . Please show your support back,
. . . . . . . . Hit the 👍 LIKE button,
. . . . . . . . . . Drop some feedback below in the comment!
❤️ Your Support is very much 🙏 appreciated! ❤️
💎 Want us to help you become a better Forex trader ?
Now, It's your turn !
Be sure to leave a comment let us know how do you see this opportunity and forecast.
Trade well, ❤️
ForecastCity English Support Team ❤️
SILVER Technical Analysis UpdateMidterm forecast:
18.95 is a major support, while this level is not broken, the Midterm wave will be uptrend.
We will close our open trades, if the Midterm level 18.95 is broken.
Technical analysis:
While the RSI uptrend #1 is not broken, bullish wave in price would continue.
A trough is formed in daily chart at 17.35 on 06/24/2020, so more gains to resistance(s) 22.15, 23.05, 25.10 and more heights is expected.
Price is above WEMA21, if price drops more, this line can act as dynamic support against more losses.
Relative strength index (RSI) is 83.
❤️ If you find this helpful and want more FREE forecasts in TradingView
. . . . . Please show your support back,
. . . . . . . . Hit the 👍 LIKE button,
. . . . . . . . . . Drop some feedback below in the comment!
❤️ Your Support is very much 🙏 appreciated! ❤️
💎 Want us to help you become a better Forex trader ?
Now, It's your turn !
Be sure to leave a comment let us know how do you see this opportunity and forecast.
Trade well, ❤️
ForecastCity English Support Team ❤️

Silver Long Term Analysis Silver has been performing very accurately from my TA compared to Gold at the moment. It has successfully created a higher high for inverted Head and now we should look out for the completion of the inverted right shoulder to break crucial resistance. I'm currently looking at $17.20 - $17.70 accumulating range for IRS (Inverted Right Shoulder) and act as a Support Range as well for a range period of 179 days. (Bear in mind as indicated on the graph where if it takes a longer duration to complete our IRS cycle then the support range increases linearly). We need to break $21 - $21.45 Crucial Resistance range to break the existing price trend for Silver.

Silver to hit $400 by 2026?Assessing the G/S ratio and my prediction of $10,000/oz by 2026, the price of silver could potentially hit $400/oz by this time as inflation runs out of control.

SilverBuy Silver using three Trend lines yellow, green and red trend lines . Buy at 19.3 price near the green line .Target of 19.98 around 3.51% - Yellow line. Stop Loss is the red line around 0.45% If it starts breaking the red trend line . You can also take a Short Position when it crosses red line. . Then it can go Down. Also RSI there seems more room for upward movement. For risk of 0.45 % there is an upside of 3.51%

[SILVER/USD] One Of The Best Silver Trades In Our Lives!Hello and welcome everybody!
Today I want to share this Legendary silver trade that I spotted ( and for sure many other silver/gold bugs did too)
I'm already in this trade actually. I bought silver at the 2020 Q1 March bottom lol.
That is the lower white line at 14 usd. So practically Ze Bottom.
Bought it physical though in case fiat crashes/hyperinflation/civil war occurs so I got something to buy food with if we see a doomsday scenario.
The top white line is the silver All-Time-High price.
The green line is Ze buy-in line with a candle close over the green line on the weekly chart as buy trigger.
The green line is above all resistance in that area and will work as support for a test of the All-Time-High 120% away.
Stoploss for me would be a weekly candle that closes below the green line :)
We are looking at the monthly chart because it is the most relevant timeframe for this trade.
Last time silver went for the all-time-high it only took about 190 days after break of the green line to reach the top.
Remember it is highly likey that silver smashes through the old all-time-high and nobody knows where that bull-run will end.
When to sell? Many options. I dont really know tbh. I bought in lower so it is just a free ride for me right now.
Option #1
Sell below magical numbers/former resistance ( pyramiding out/ scaling out )
1# sell 33% at 33 usd (red line)
2# sell 33% at 39 usd (red line)
3# sell 33% at 43 usd (red line)
Option 2#
Hold and hope silver breaks all-time-high and if silver is rejected the sell trigger is a red monthly candle after the test of the old all-time-high.
Many other options. I would pick option #2 and buy-in again if the all-time-high is broken :) I will likely throw up a new trading idea by them :)
Good luck and stay positive & never give up.
Confucius_The_Great

SILVER IDEA 2020 - 2025Silver looks to be breaking out of a shorterm downward resistance and has recoved from a false breakdown of the primary support line. It looks to me as if the next target will be $21.25 before a pullback occurs bouncing off the converging lines, before a breakout to $26.25 and another consolidation before reaching new highs of $50 and beyond later in the decade.

SILVER Weekly Technical Analysis UpdateMidterm forecast:
. While the price is above the support 16.50, resumption of uptrend is expected.
. We make sure when the resistance at 18.95 breaks.
. If the support at 16.50 is broken, the short-term forecast -resumption of uptrend- will be invalid.
. We will close our open trades, if the Midterm level 16.50 is broken.
Technical analysis:
. While the RSI support #1 at 45 is not broken, the probability of price decrease would be too low.
. A trough is formed in daily chart at 17.35 on 06/24/2020, so more gains maximum to Major Resistance (18.95) is expected.
. Price is above WEMA21, if price drops more, this line can act as dynamic support against more losses.
. Relative strength index ( RSI ) is 67.

SILVER Weekly Technical Analysis UpdateMidterm forecast:
. While the price is above the support 16.50, resumption of uptrend is expected.
. We make sure when the resistance at 18.95 breaks.
. If the support at 16.50 is broken, the short-term forecast -resumption of uptrend- will be invalid.
. We will close our open trades, if the Midterm level 16.50 is broken.
Technical analysis:
. While the RSI support #1 at 45 is not broken, the probability of price decrease would be too low.
. A trough is formed in daily chart at 17.35 on 06/24/2020, so more gains maximum to Major Resistance (18.95) is expected.
. Price is above WEMA21, if price drops more, this line can act as dynamic support against more losses.
. Relative strength index (RSI) is 67.

Silver showing some symmetryMinor trendline is best zone for buy
Wedges can be seen to be displaying symmetry within Head and shoulders pattern.

Silver bullish ScenarioHello Traders,
Today we'll take a look at silver on a 2 hour chart. Personally i think we are still on a bullish trend, i see a possible triangle formation as wave 4 or a double correction (WXY) I expect market to go about 19.560
Thanks.


Silver to 20 usd dollarYou can see from the previous idea in the related ideas that silver reached 18 usd
We have the same pattern so silver can go to 20 usd
Silver is very bullish because there is QE and dollar is weak
Same for all precious metal
Technical aspect 3-5 Elliot wave ??
Good luck

SILVER D1 12 JUN I am looking for buying opportunity
as I always say , in this market I am just buyer
do not forget USD is weak so looking for buying in other pairs

SILVER - What's the next move? I'm looking for a SHORT!Morning TradingView fam :-)
Today I'm looking at Silver and planning my next move. It's moving in a strong upward direction, however I'm looking to take advantage of a short term pullback in the mean time.
With the approach to strong resistance, I'll be watching for reversal signs before I enter a short. As we are travelling in a big channel, these will likely be reversal candlesticks.
Potential for a short!
TRADE SPECIFICS:
ENTRY - 18.45804
TAKE PROFIT - 17.42419
STOP LOSS - 19.04570 (A bit high to clear some wicks - highlighted on chart for you)
RISK to REWARD - 2.47
If you like my ideas, please LIKE and FOLLOW me! :-)
Reminder - this is not financial advice, simply an idea. Please do your own research before entering any trades and ensure you use risk management such as stop losses.
Remember, there is only 5 outcomes when you enter a trade:
1. Break Even
2. Small Win
3. Small Loss
4. Big Win
5. Big Loss
Eliminate #5 from your future options.
Happy Hunting!

XAGUSD. Silver will grow further!Hello dear subscribers!
The price of gold and silver performed well during the crisis.
The fall was strong, however, in a short period of time,
valuable metals were able to quickly recover after a large fall.
The price of these resources will rise even at least to the level of resistance,
there is a target.
Good luck to you!
If you liked this idea, please like and subscribe to my profile.
This idea does not provide the financial advice.

SILVER USD DOLLAR HORLY CHART FOR TRADE NEXT WEEKAs we seen in chart Silver trade in support resistance levels for last few days....on next week if silver sustain above 17.629 level then we go long for the target of 18.160 and 18.657 ..... If silver break its support lave of 16.504 then we go short for the target of 15.884.

Taking Profit. 15% (SILVER)Silver looks really good on the large timeframes but I will be exiting here for a nice 15% move.
The 12hr and daily look to be retracing as we fire red in a potential rising wedge.
Will try to capture a re entry on a pullback. I want to take these profits and reinvest into some other good trend reversals that I see from other options.
Will look for the next crossover on these timeframes for re entry. If we bleed out and break support we can look for a big short out of the wedge channel.
Have an awesome day! 😁
🥇 MLT | PRO TRADERS

SILVER ($SILVER): Silver Might Not Glitter like Gold, But...✨ Drop a comment asking for an update, we do NEW setups every day! ✨
Like, Comment & Follow to help the community grow 🎉🎉
---
Silver is following Gold's lead and showing us some bullish price action. With the FED money printers going, the move to precious metals is logical. Let's look for an entry to make some money off this silver uptrend.
Resource: www.wsj.com + www.cbsnews.com
---
1. Fractal Trend is showing an uptrend (Aqua bar color) on the 1 hour timeframe as ETH continues to show strength.
2. With this strategy, we are looking for long setups in a uptrend and as such want to enter long on retests of bullish order blocks plotted by Orderblock Mapping (Aqua line color) and/or bullish S/R levels plotted by Directional Bias (Aqua line color).
3. Right now we are looking for a long entry off the recently formed S1 bullish orderblock with a target of the R1 minor pivot point.
4. Our stoploss is placed below the price action at S1 to avoid any liquidity hunt. We will exit the position if our stoploss is hit or if Fractal Trend changes color.
5. Below we can see some other levels of interest to watch if S1 cannot hold.
Good luck metal heads!

The DOW Jones / Silver ratio looks to be topping.The DOW/Silver ratio looks to be topping. If the ratio breaks below the red support line, expect a silver bull market over the next few years and the stock market will underperform.

Massive Green Engulfing! (SILVER)Green arrow points to where your signal was to go long on silver.
This one was analyzed around mid $14 for a buy entry on a long term move.
The 3day is a beautiful green impulse.
Now we are creating distance from the initial buy, more space = better trade.
No stress with this one as I will hold for a long term hold.
Will update this if I see any key signs for any reversal.
For now, we are solid. ✌😁🥇
